

Oil Price Talking Points
The price of oil struggles to extend the recent series of higher highs and lows amid a smaller-than-expected decline in US inventories, but crude may stage a larger recovery over the coming days as it clears the opening range for December after defending the August low ($61.74).
Oil Price Recovery in Focus as Crude Clears December Opening Range
The price of oil trades back above the 200-Day SMA ($70.03) after slipping below the moving average for the first time in 2021, and the current environment may keep crude afloat as the Organization of Petroleum Exporting Countries (OPEC) plan to “adjust upward the monthly overall production by 0.4 mb/d for the month of January 2022.”
However, fresh data prints coming out of the US warn of slowing demand as stockpiles narrow 0.24M in the week ending December 3 versus forecasts for a 1.705M decline, and it remains to be seen if OPEC and its allies will react to the US data prints as output increases for the third consecutive week.
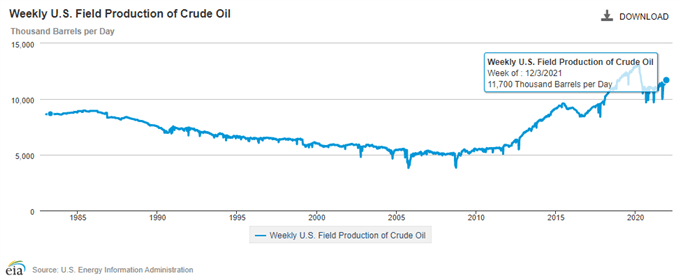
A deeper look at the report from the Energy Information Administration (EIA) shows weekly field production of crude climbing to 11,700K from 11,600K in the week ending November 26, and the gradual recovery in US output may push OPEC and its allies to retain the current production schedule in 2022 as the Omicron variant poses a threat to the global economy.
In turn, signs of easing demand along with the gradual rise in supply may lead to potential shift in the broader trend as the price of oil appears to have reversed course following the failed attempts to clear the October high ($85.41), but crude may stay afloat ahead of the next OPEC and non-OPEC Ministerial Meeting on January 4 as it trades back above the 200-Day SMA ($70.03) going into the end of the year.
With that said, lack of momentum to test the August low ($61.74) appears to be generating a near-term rebound in the price of oil, and crude may stage a larger recovery over the coming days as the Relative Strength Index (RSI) bounces back from oversold territory to indicate a textbook buy signal.
Oil Price Daily Chart
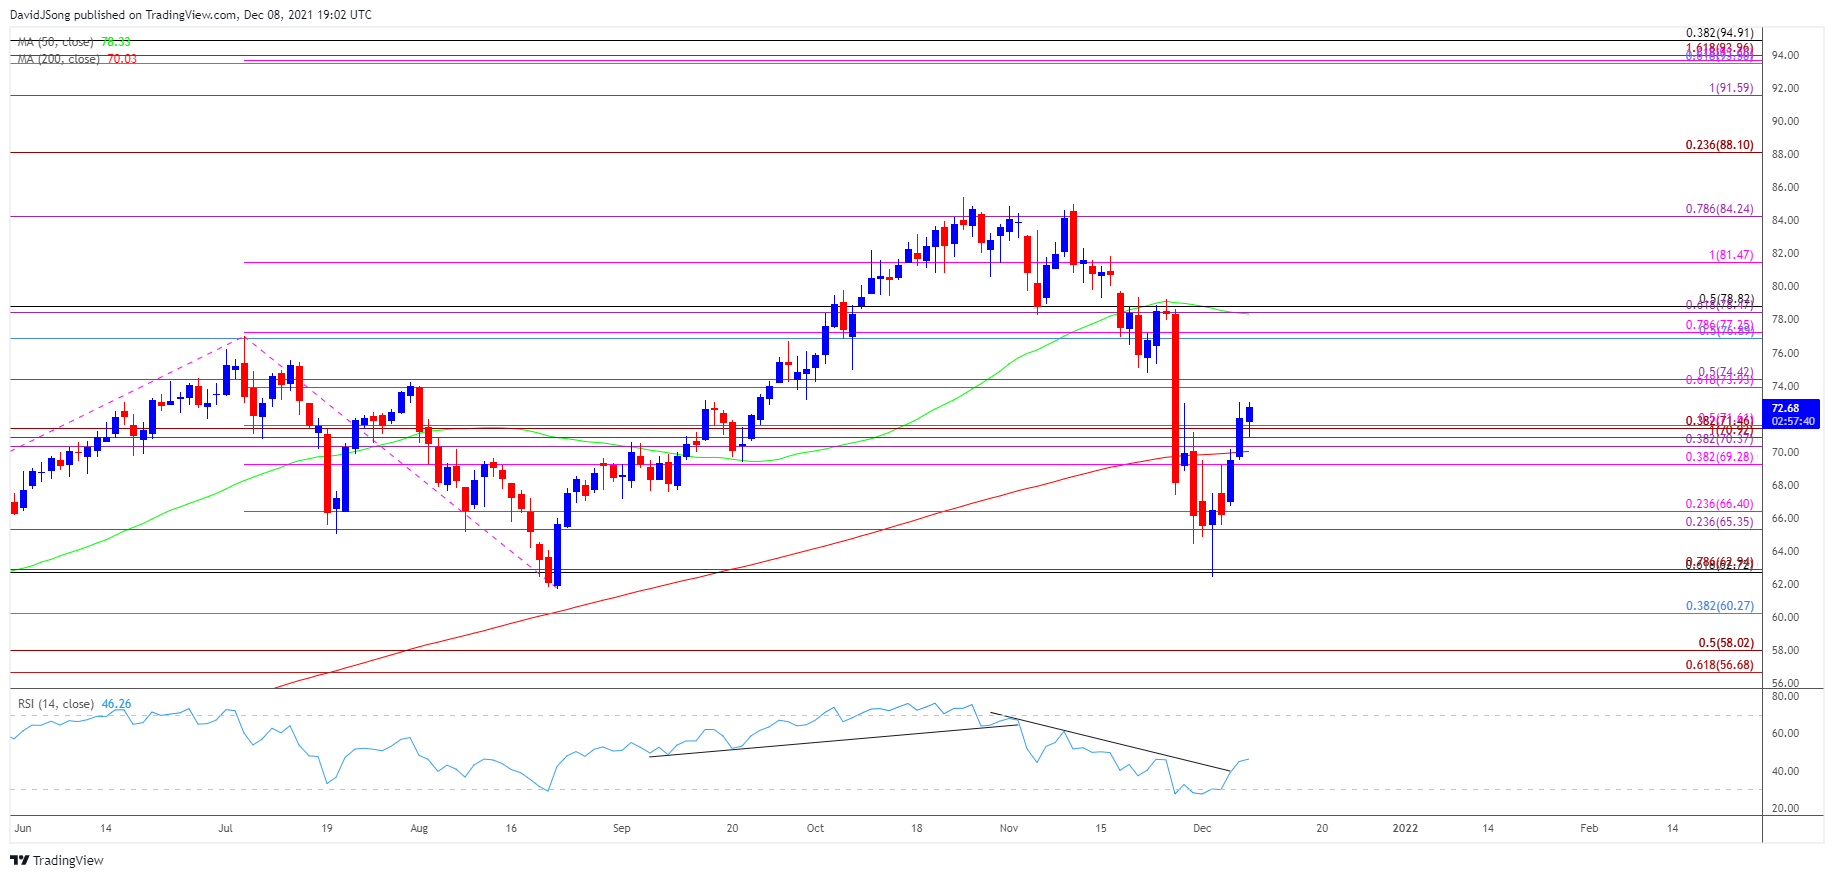
Source: Trading View
- Keep in mind, the price of oil cleared the July high ($76.98) after defending the May low ($61.56), with crude trading to a fresh yearly high ($85.41) in October, which pushed the Relative Strength Index (RSI) above 70 for the first time since July.
- However, the price of oil reversed ahead of the October 2014 high ($92.96) as the RSI fell back from overbought territory, with crude now trading below the 200-Day SMA ($70.03) for the first time in 2021.
- Nevertheless, lack of momentum to test the August low ($61.74) has pushed the price of oil back above the moving average, with the move back above the Fibonacci overlap around $70.40 (38.2% expansion) to $71.70 (5% expansion) bringing the $73.90 (61.8% expansion) to $74.40 (50% expansion) area on the radar.
- The next region of interest comes in around $76.90 (50% retracement) to $77.30 (78.6% expansion) followed by the $78.50 (61.8% expansion) to $78.80 (50% expansion) area.
— Written by David Song, Currency Strategist
Follow me on Twitter at @DavidJSong
Be the first to comment