

Joe Raedle/Getty Images News
Introduction
Houston-based Occidental Petroleum (NYSE:OXY) released its third quarter 2022 results on November 8, 2022.
Note: This article updates my previous article on Occidental Petroleum, published on September 30, 2022. I have been following OXY quarterly results since 2017. Before analyzing the third quarter results, it is essential to look at the company’s assets portfolio from the November presentation.
OXY Assets portfolio (OXY Presentation)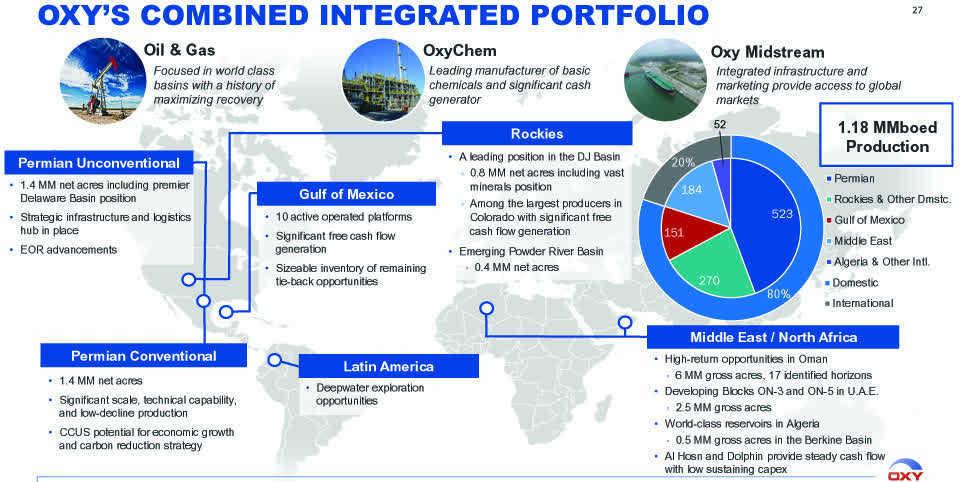
OXY presents three distinct segments, with the Oil & Gas segment representing the largest. The Permian Basin represents 44.3% of the total oil equivalent production in 3Q22 (including International production).
1 – 3Q22 results Snapshot
Occidental Petroleum reported third quarter 2022 adjusted earnings of $2.44 per share, falling short of analysts’ expectations but well over the $0.87 per share made last year. The increase can be attributed to operating efficiencies and significantly higher commodity prices.
Net income was $2.52 per diluted share, strongly contrasting with $0.65 per share in 3Q21.
Total revenues were $9.501 billion, which was better than expectations.
- Oil and Gas revenues were $7,098 million, up 43.3% from 3Q21.
- Chemical revenues were $1,691 million, up 21.1% from 3Q21.
- Midstream & Marketing revenues were $1,005 million, up 43.2% from last year.
It was a solid quarter in terms of balance sheet despite a weakening production down 3.6% from the same quarter a year ago.
OXY 3Q22 Highlights (OXY Presentation)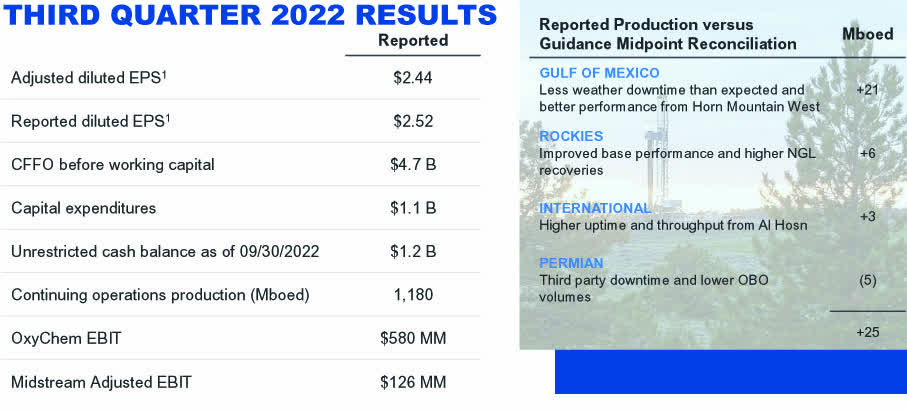
CEO Vicki Hollub said in the conference call:
We delivered another strong quarter operationally and financially, enabling us to further advance our shareholder return framework as we made meaningful progress toward completing our $3 billion share repurchase program. We achieved our goal of reducing the face value of our debt to the high-teens and plan to continue repaying debt through the remainder of this year before allocating a higher percentage of cash flow to shareholder returns next year.
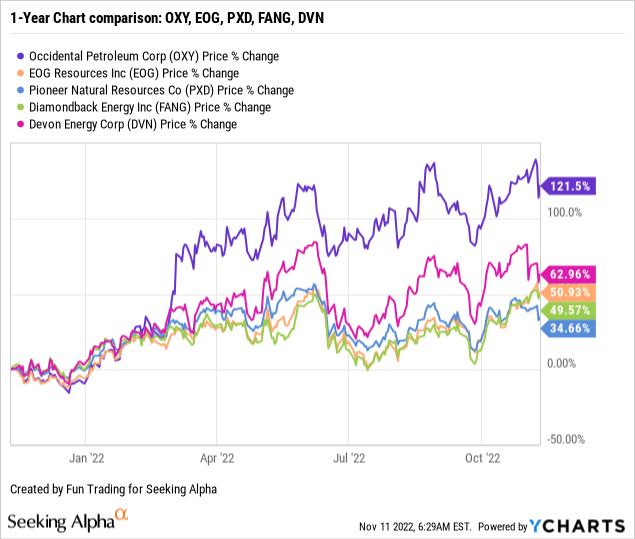
2 – Stock Performance
Occidental Petroleum is up 122% on a one-year basis. The excellent recovery was led by higher commodity prices reaching over $94 per barrel and Buffett’s renewed interest in Berkshire Hathaway (BRK.A, BRK.B), increasing its stake in the company to 20.7% after buying nearly 6 million in September.
3 – Investment Thesis
The investment thesis is always a significant issue here because OXY’s high valuation is already factored into the stock price, and any faux pas, whatever insignificant, can have a terrible effect on the stock price, as we noticed a few days ago.
Buffett’s buying spree has propelled the stock price artificially to new highs pushing the stock to a much higher valuation than fair if we compare it to a few other strong companies in this industry.
Still, I see it as an inflated level that could be a substantial negative if the world economy falters due to over-reasonable commodity prices, weakening the world stability where emerging countries bear the brunt of the pain. Furthermore, the stock is hanging on Buffett’s whim, and any change of heart on his part would be catastrophic for the stock. Do not discount this eventuality; look at what happened to Barrick Gold a few years back.
The oil sector is characterized by highly volatile periods requiring short-term trading using the LIFO method to turn this investment profitable. In the OXY case, savvy investors are not counting on significant dividends but only a steady valuation increase which is risky by definition.
Thus, trading short-term OXY using at least 30% of your entire position is compelling. This two-level strategy has prevailed in my marketplace, “The Gold and Oil Corner,” and I believe it is the most rewarding. However, only US investors can use LIFO. Please read my note at the end of this article.
Occidental Petroleum – 3Q22 Quarterly Financial Table: The Raw Numbers
| Occidental Petroleum | 3Q21 | 4Q21 | 1Q22 | 2Q22 | 3Q22 |
| Revenues in $ billion | 6.79 | 7.91 | 8.35 | 10.68 | 9.39 |
| Total Revenues and others in $ Billion | 6.82 | 8.01 | 8.53 | 10.74 | 9.50 |
| Net income in $ Million | 828 | 1,537 | 4,876 | 3,755 | 2,746 |
| EBITDA $ Million | 3,582 | 4,381 | 4,908 | 6,627 | 5,473 |
| EPS diluted in $/share | 0.65 | 1.37 | 4.96 | 3.47 | 2.52 |
| Operating cash flow in $ Million | 3,118 | 3,092 | 3,239 | 5,329 | 4,267 |
| Capital Expenditure in $ Million | 645 | 757 | 897 | 1,001 | 1,077 |
| Free Cash Flow in $ Million | 2,473 | 2,335 | 2,342 | 4,328 | 3,190 |
| Cash and cash equivalent $ Billion | 2.06 | 2.76 | 1.91 | 1.36 | 1.23 |
| Total debt in $ Billion | 30.92 | 29.43 | 25.73 | 21.56 | 21.02 |
| Dividend per share in $ | 0.01 | 0.13 | 0.13 | 0.13 | 0.13 |
| Shares outstanding (diluted) in Million | 957.7 | 972.6 | 936.7 | 1,018.3 | 1,002.5 |
| Oil Production | 3Q21 | 4Q21 | 1Q22 | 2Q22 | 3Q22 |
| Oil Equivalent Production in K Boe/d | 1,160 | 1,189 | 1,079 | 1,147 | 1,180 |
| Global oil price (world) ($/b) | 68.74 | 75.39 | 91.91 | 107.72 | 94.89 |
| Global Natural gas price (world) ($/MMBtu) | 2.89 | 3.86 | 3.66 | 5.03 | 7.08 |
Source: Occidental Petroleum and Fun Trading
* Estimated and summed by Fun Trading
Analysis: Revenues, Free Cash Flow, Net Debt, and Oil & Gas Production
1 – Quarterly revenues and others were $9.501 billion in 3Q22 (net sales were $9.390 billion)
OXY Quarterly Revenues history (Fun Trading) Occidental Petroleum’s 3Q22 total revenues and others were $9.501 billion, up significantly from $6.815 billion a year ago and down 11.5% QoQ.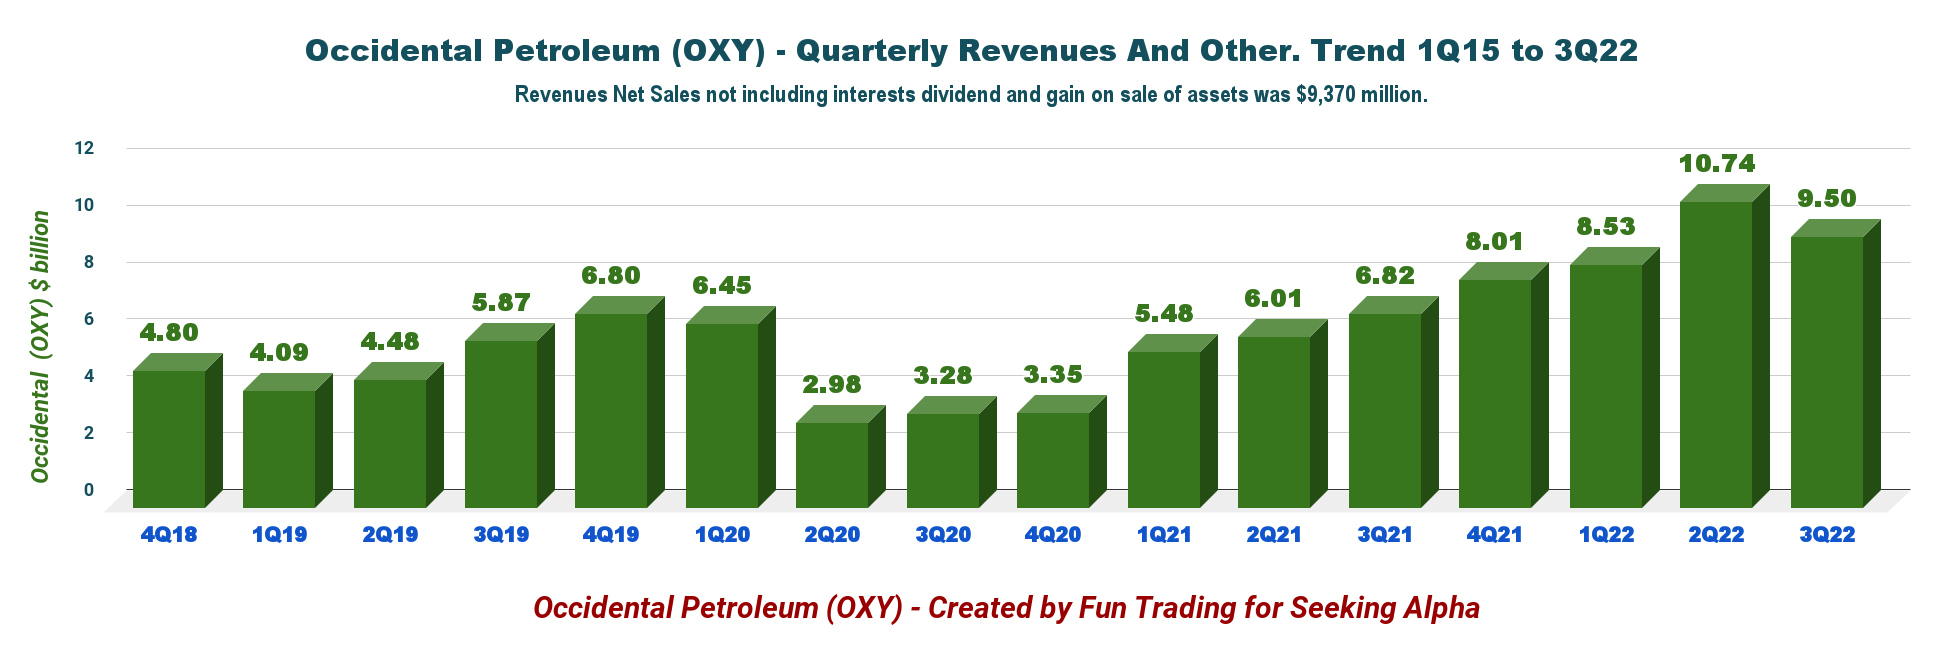
Occidental posted a net income of $2,746 million or $2.52 per diluted share. The adjusted income was $2.44 per diluted share compared to $0.87 in 3Q21. Also, Occidental’s total expenses for the third quarter were $6,119 million, up 6.7% year-over-year.
Below are the revenues per segment:
OXY Quarterly revenue per segment in 3Q22 (Fun Trading)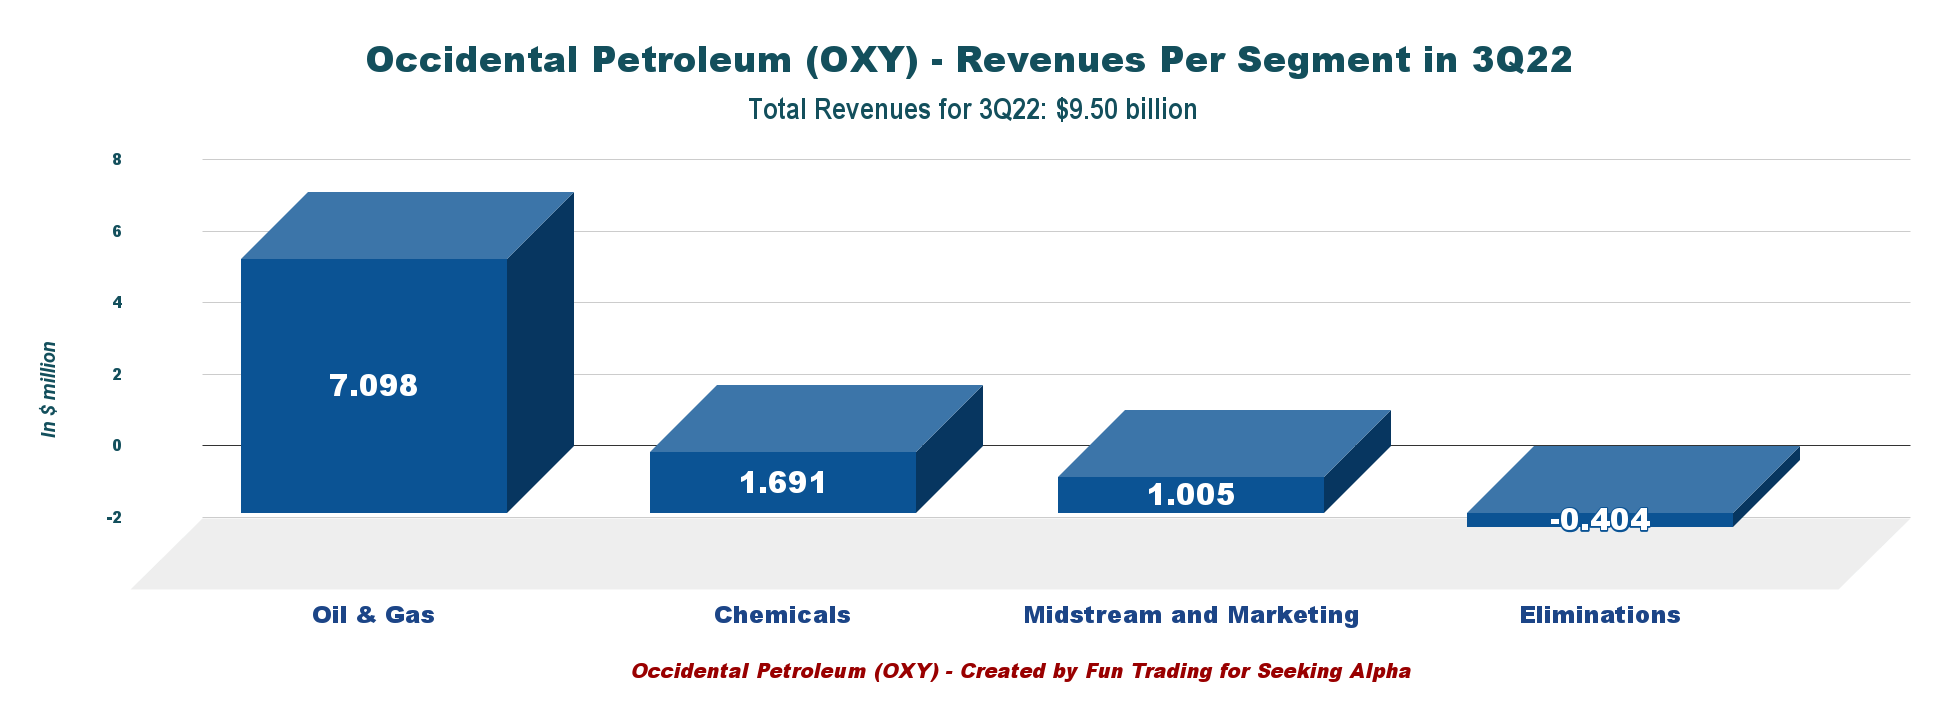
2 – The free cash flow was $3,190 million in 3Q22
The generic Free cash flow was estimated at $3,190 million in 3Q22 compared to $2,473 million in 3Q21. Trailing 12-month free cash flow is $12,195 million.
OXY Quarterly Free cash flow history (Fun Trading)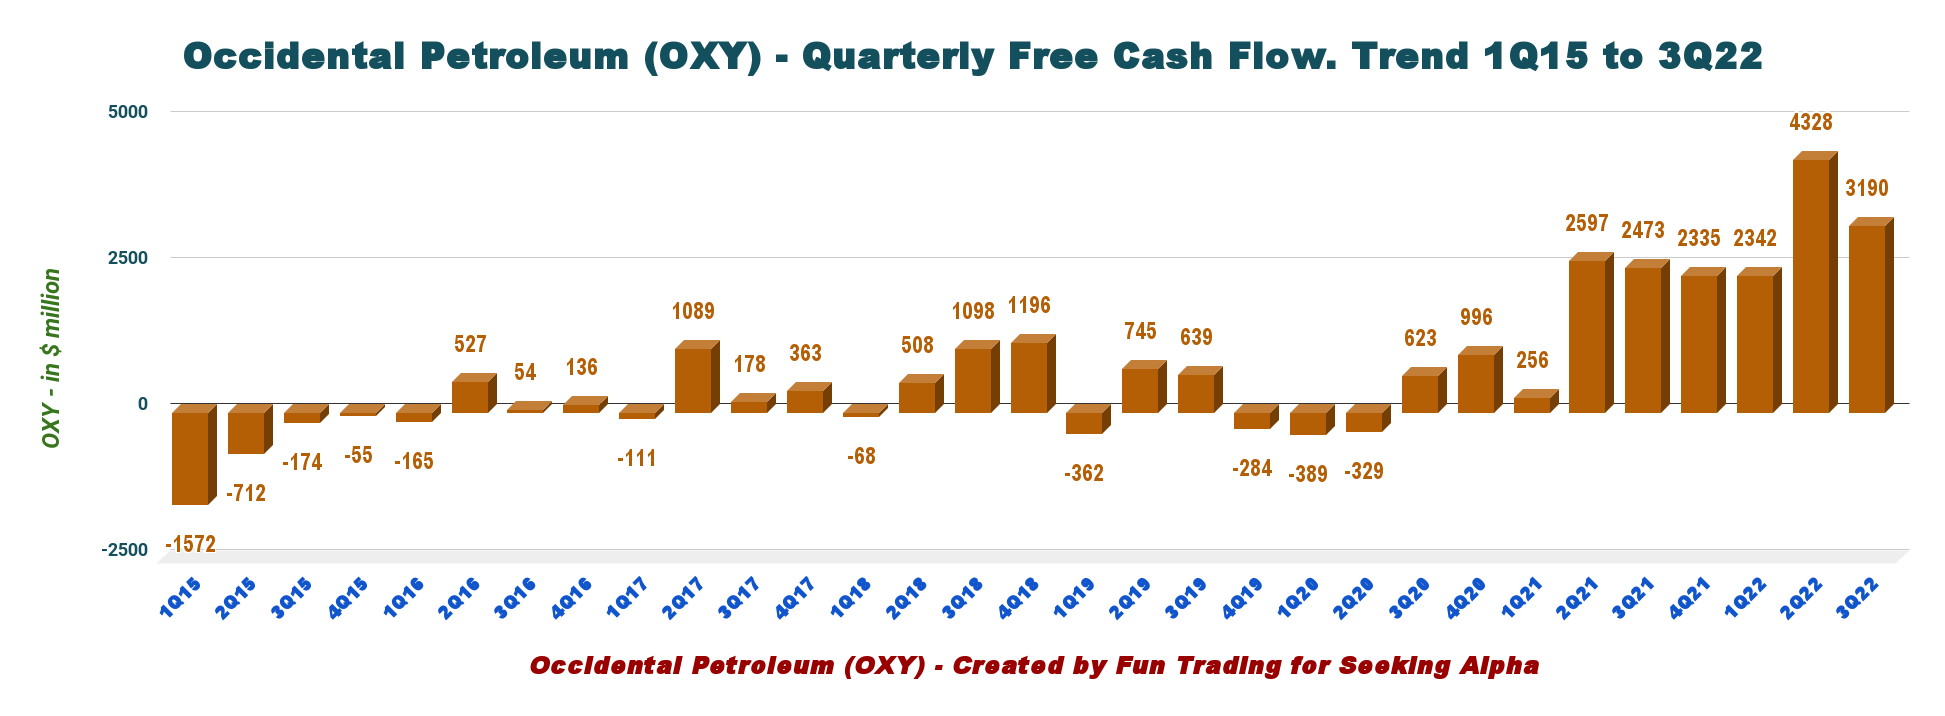
The free cash flow is calculated by subtracting CapEx from cash from operating activities. However, Occidental Petroleum has a different way of calculating the free cash flow and indicates $4.7 billion (non-GAAP) in 3Q22.
The difference is that the company includes “working capital and other, net,” and I calculate CapEx by adding “capital expenditure” and “changes in capital accrual.” The generic free cash flow I have indicated is comparable to other companies.
The company kept its quarterly dividend to $0.13 per share or a yield of 0.74%, which is disappointing but can be justified by the need to reduce debt. OXY repaid debts worth $1.3 billion in 3Q22, strengthening the balance sheet.
Also, the company reactivated a share buyback program for $3 billion, which is now 85% completed. The company said that any excess cash flow in 2023+ will shift to shareholder returns.
However, it is unclear if the company is talking about increasing dividends or share buybacks, which are pretty different from a shareholder’s perspective.
OXY Goal 2023+ (OXY Presentation)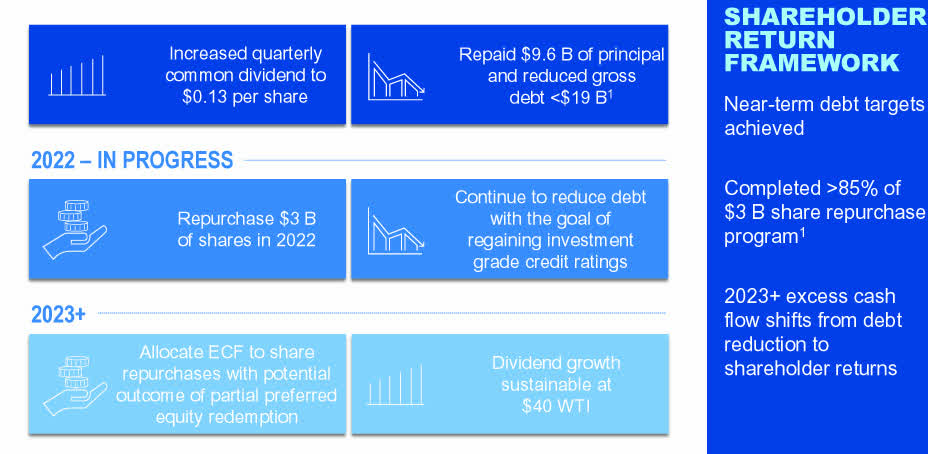
CEO Vicki Hollub said in the conference call:
As we enter 2023, we expect that our free cash flow allocation will shift significantly towards shareholder returns. We intend to reward shareholders with a sustainable dividend supported by an active repurchase program, continued rebalancing of our enterprise value in favor of common shareholders, and a reduction in our cost of capital as the preferred equity is partially redeemed.
3 – Quarterly production was 1,180K Boepd in 3Q22
3.1 – The total output was 1,180K Boepd in 3Q22. The Permian operations accounted for about 44.3% of the company’s total production. OXY’s output was up 1.7% compared to the same quarter a year ago.
Substantial production volumes were due to higher volumes from the Rockies and other domestic assets. Permian basin production for the third quarter was 523K Boep/d, close to the lower end of the guidance of 523-533K Boep/d.
OXY Quarterly oil production versus Permian history (Fun Trading)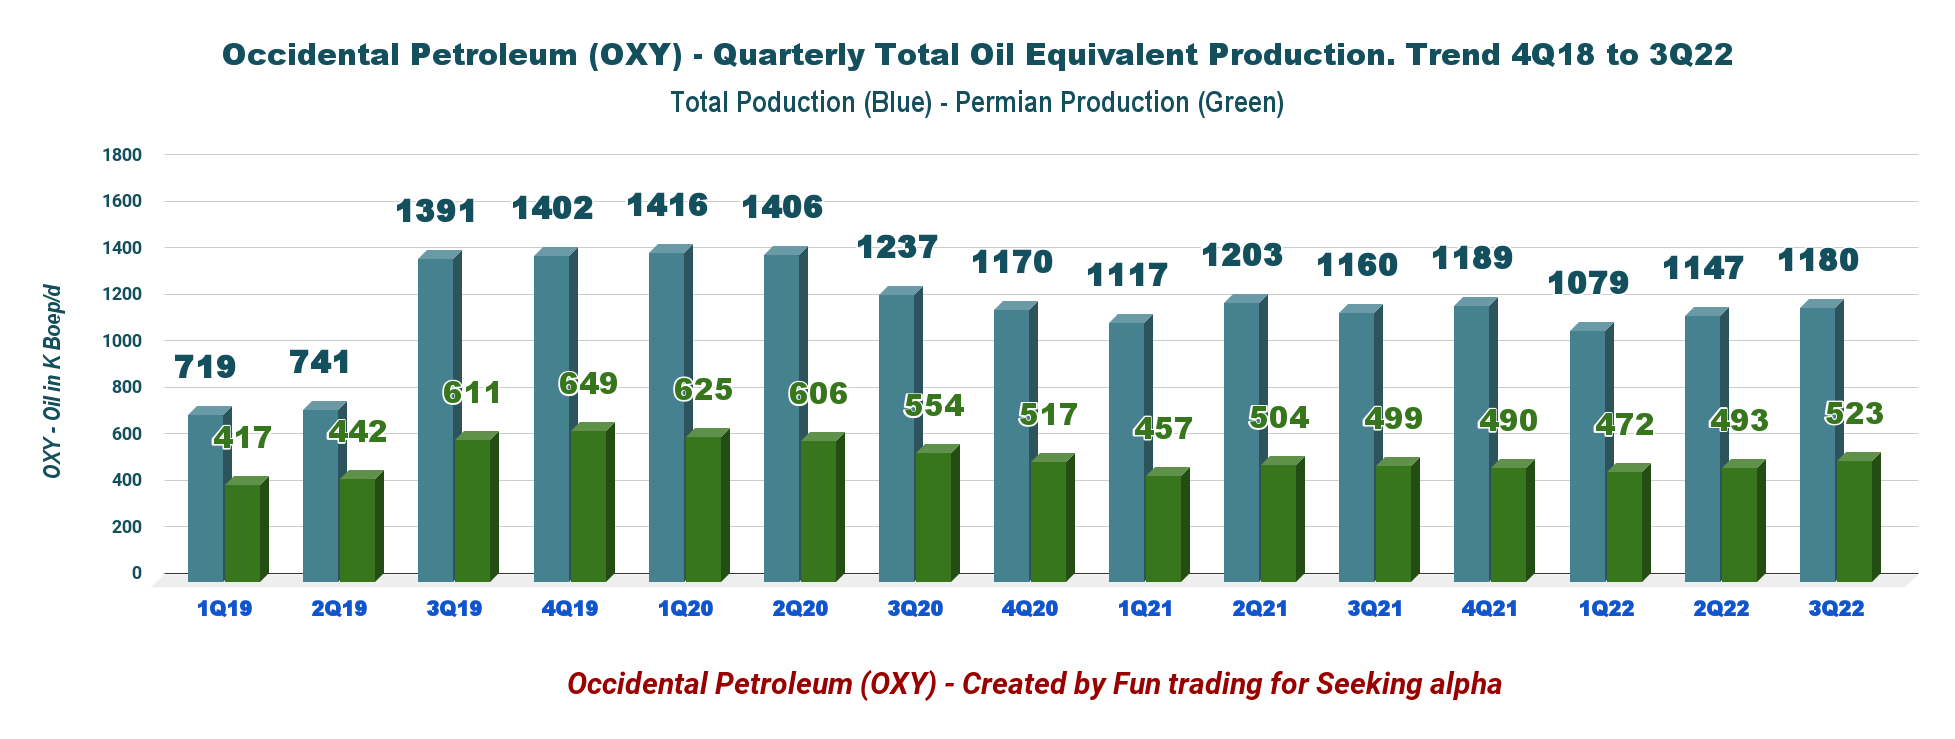
3.2 – Production in the USA totaled 944K Boep/d (including the Permian Basin production).
OXY Quarterly Production US details (Fun Trading)
3.3 – Production for the third quarter was 57.6% of oil.
OXY Quarterly Production details Oil, NGL, and NG in 3Q22 (Fun Trading)
3.4 – Realized oil prices in 3Q22 were $94.89 per barrel compared to $68.74 last year. Natural gas was $7.08 per Mcf, up from $2.89 in the previous year. NGL price was $35.22 per Boe, up from $34.01 last year.
OXY Quarterly Oil and Gas prices history (Fun Trading)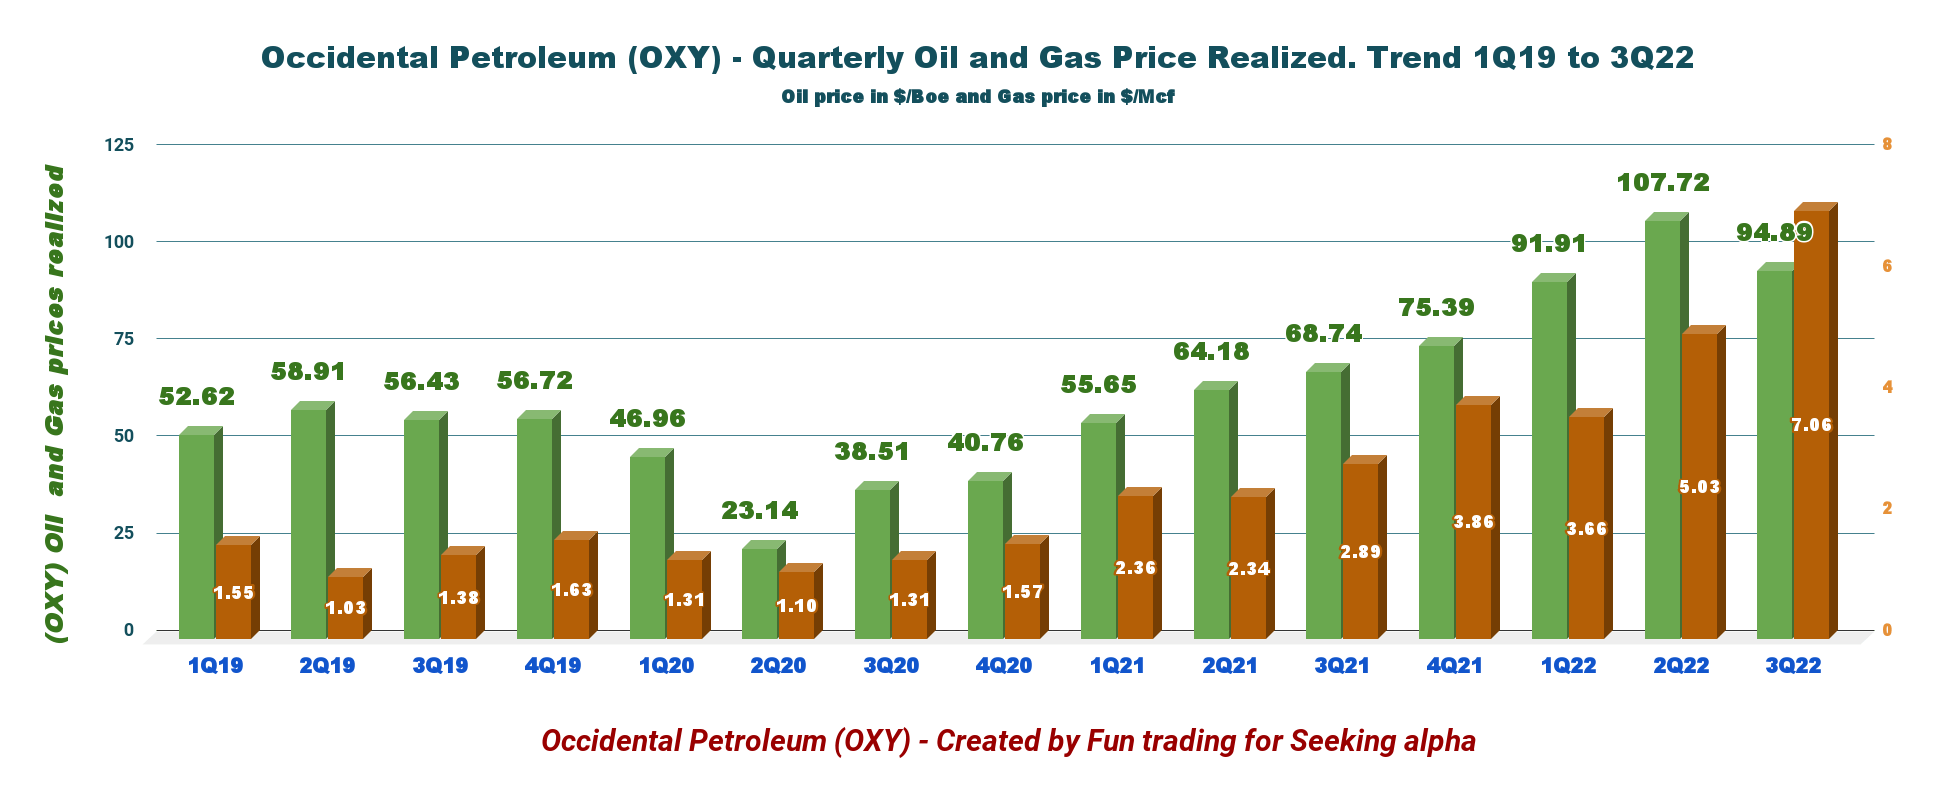
Note: Total production in the Permian Basin includes the Permian Resources, and the Permian EOR is now consolidated. The entire production in the USA is 896K Boepd. It represents the Gulf of Mexico, the Permian Basin, the DJ Basin in Colorado, and others.
3.5 – Guidance 2022
Occidental expects the second quarter 2022 production to be between 1,200K and 1,260K Boep/d and Permian production between 556K and 590K Boep/d, with Exploration expenses increasing to $115 million.
Oxychem pre-tax income should be $425 million, and Midstream & Marketing Income will range from $(40 million) to $60 million.
OXY 4Q22 outlook (OXY Presentation)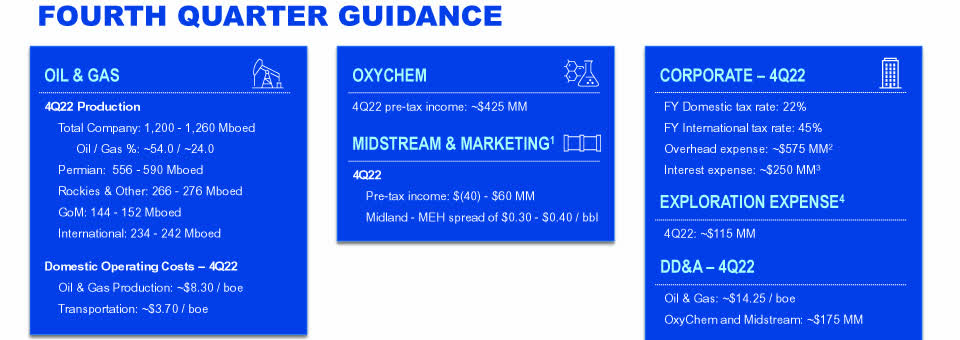
4 – Net debt is down to $19.79 billion at the end of September 2022
Steady progress here. Occidental Petroleum is doing an excellent job of cutting the debt to a more acceptable level.
OXY Quarterly Cash versus Debt history (Fun Trading)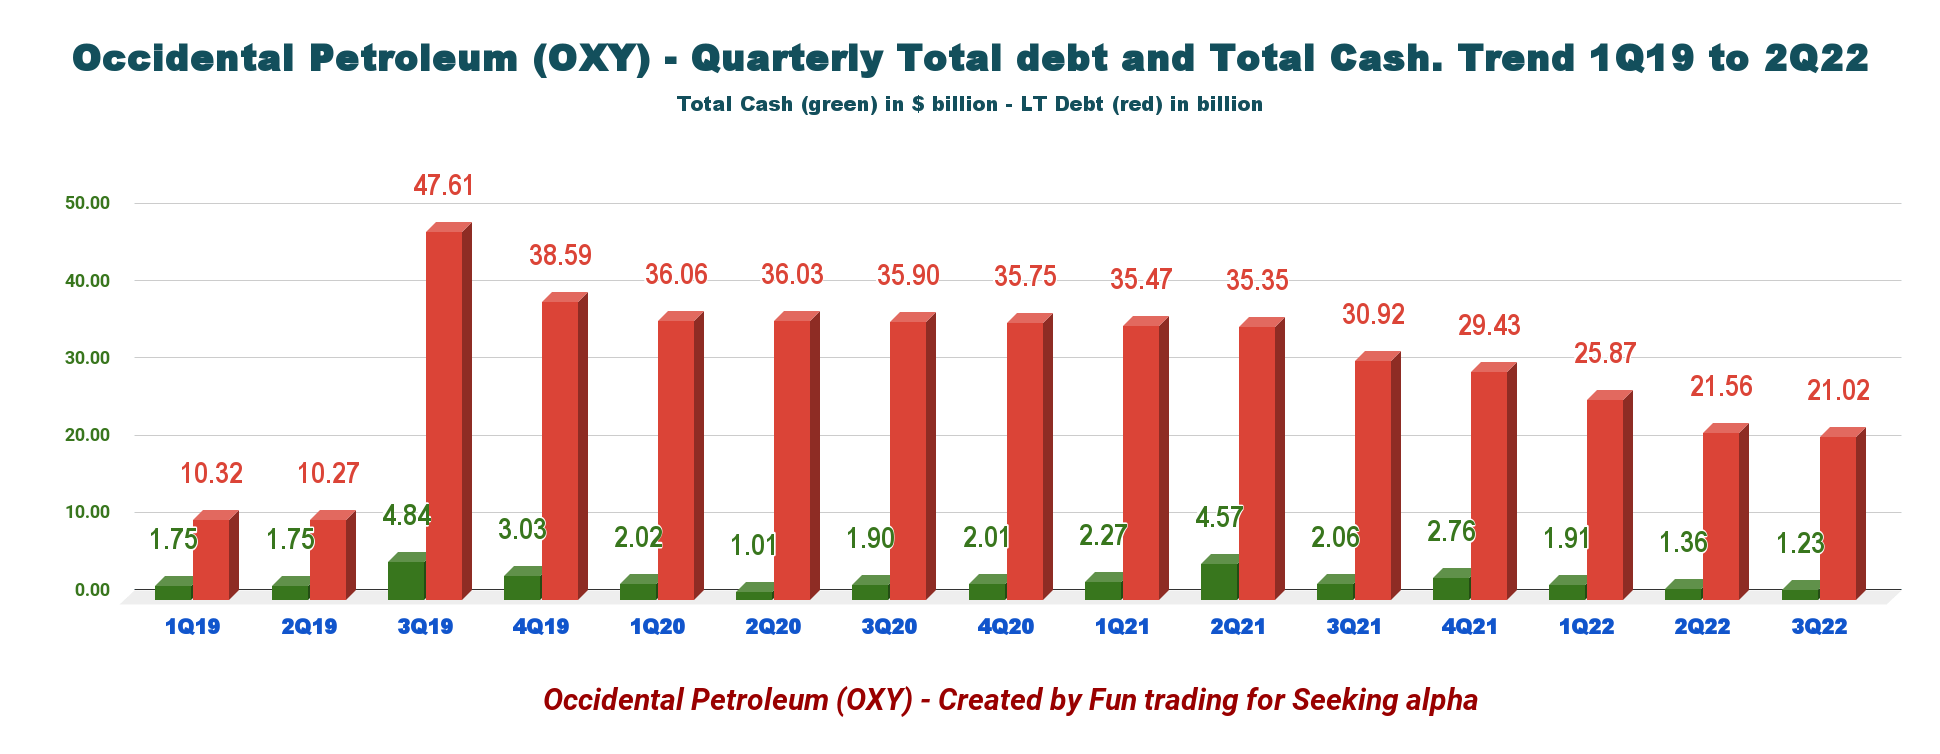
CEO Vicki Hollub said in the conference call:
We also repaid approximately $1.5 billion of debt in the third quarter and in the period ending November 7th. Providing commodity prices remain supportive, we intend to reduce the face value of our debt approximately $18 billion by the end of this year, meaning that we will have repaid over $10 billion of debt in 2022.
Note: The preferred stocks owned by Warren Buffett’s Berkshire Hathaway bear an 8% interest payable every quarter and can be paid either in cash or in shares. Also, they have warrants for 83.9 million at an exercise price of $59.624 per share.
Also, on June 26, 2020, OXY shareholders obtained 1/8th (125 shares for 1,000 shares) of a warrant for every stock they owned as of July 6, 2020. (The warrants can be exercised from August 3, 2020, to August 3, 2027, with an initial exercise price of $22 per share of common stock.)
The best part is that the warrants are tradable under the NYSE’s ticker OXY warrant (OXY.WS) and now trades at about $37.06 per share.
Commentary and Technical Analysis (Short-Term)
OXY TA Chart short-term (Fun Trading StockCharts) Note: The chart is adjusted for the dividend.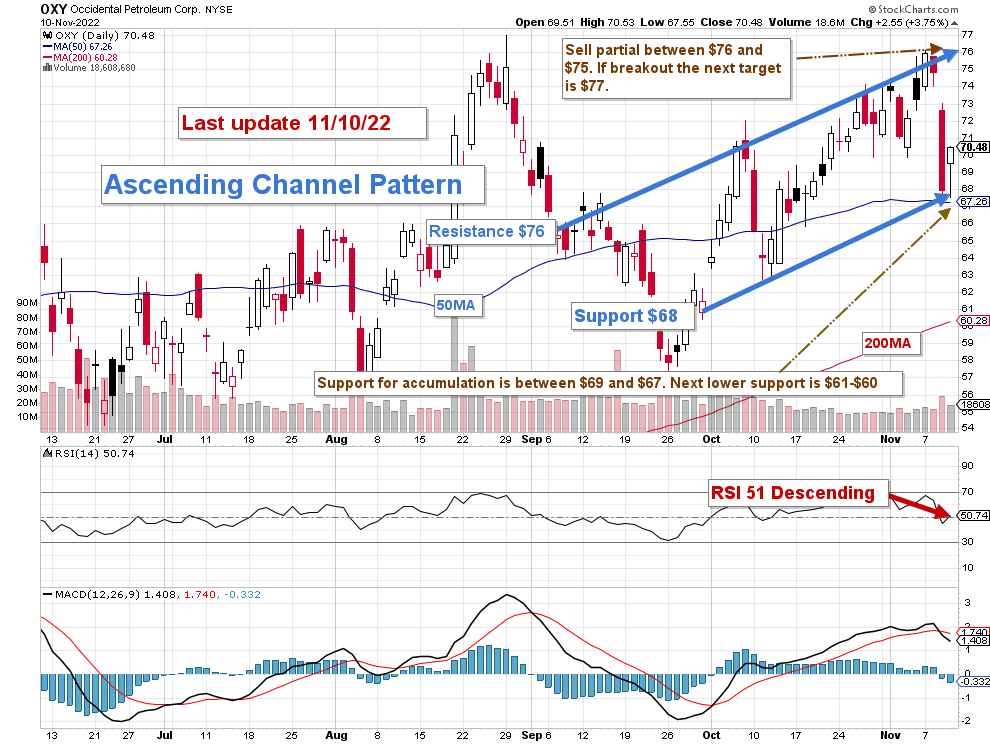
OXY forms an ascending channel pattern with resistance at $76 and support at $68.
Ascending channel patterns or rising channels are short-term bullish in that a stock moves higher within an ascending channel, but these patterns often form within longer-term downtrends as continuation patterns.
As indicated in my preceding article, the trading strategy is to take profits (35% seems reasonable) between $75 and $76 and wait for a retracement between $69 and $67 with possible lower support at $61-$60.
The Fed’s action against rampant inflation increases the risk of a recession in 2023. Europe is already struggling with recession, and the USA is not far behind.
The Fed increased the interest rate by another 75-point in November, and I expect it to increase by 75-point in December, even if the recent CPI data points to a slight slowdown in inflation now at 7.7%.
The recession will hurt energy demand, it is a given, and it could signal a decline in oil and NG prices early next year.
As I said in my preceding article, we cannot ignore those early signs, and we must protect our OXY investment by adopting a strategy that takes the “best of both worlds” trading and investing in parallel.
It is what I promote in my marketplace, “The Gold and Oil corner.”
Note: The LIFO method is prohibited under International Financial Reporting Standards (IFRS), though it is permitted in the United States by Generally Accepted Accounting Principles (GAAP). Therefore, only US traders can apply this method. Those who cannot trade LIFO can use an alternative by setting two different accounts for the same stock, one for the long term and one for short-term trading.
Warning: The TA chart must be updated frequently to be relevant. It is what I am doing in my stock tracker. The chart above has a possible validity of about a week. Remember, the TA chart is a tool only to help you adopt the right strategy. It is not a way to foresee the future. No one and nothing can.
Author’s note: If you find value in this article and would like to encourage such continued efforts, please click the “Like” button below as a vote of support. Thanks.
Be the first to comment