

Darren415
This article was first released to Systematic Income subscribers and free trials on Nov. 16.
In this article, we catch up on quarterly results from the business development company Oaktree Specialty Lending (NASDAQ:OCSL). OCSL is currently trading at a total dividend yield of 10.3% and a valuation of 103%. OCSL has outperformed the sector this year and we continue to allocate to it in our Core Income and High Income Portfolios with a Hold rating.
As we discussed in our previous update, the company was very likely to keep hiking its dividend and this is indeed what happened with a 6% hike to $0.18 – double the usual $0.005 raise. Current distribution coverage is 100%; however, we expect further dividend hikes given a number of income tailwinds. The company also declared a $0.14 special on the back of additional taxable income from FX hedges.
Oaktree operates at the upper-end of the middle-market segment with a median EBITDA of $128m. Like many other BDCs, it targets companies in the Software and Health / Biotech sectors. It is primarily focused on secured loans with a below-average Equity holding profile.
Oaktree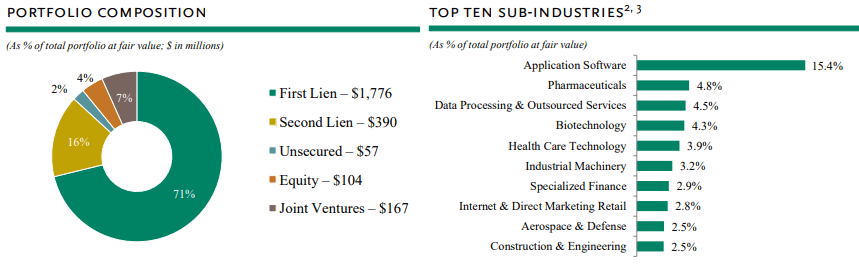
The previously announced merger agreement between OCSL and Oaktree Strategic Income II remains on track and is expected to close in Q1 next year. The merger should lead to additional cost savings for the larger entity.
Quarter Update
OCSL NAV fell 1.5%, slightly underperforming the sector over Q3 with the total NAV return coming at +1% for the quarter.
Systematic Income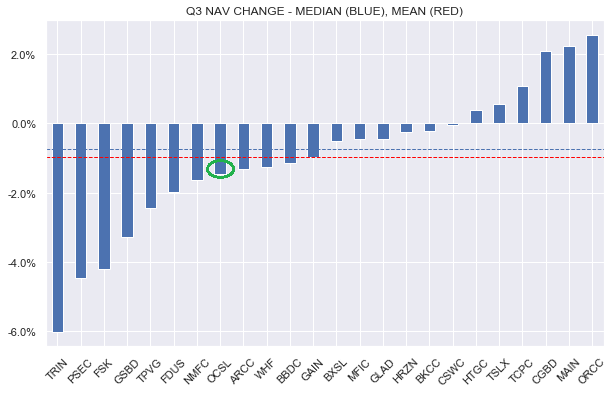
Over the entire year, the NAV has fallen around 7.5%. As we have discussed several times before, OCSL appears to adopt a more conservative portfolio marking approach than the rest of the sector. This NAV underperformance came in despite non-accruals remaining zero and despite net realized gains for the year.
Systematic Income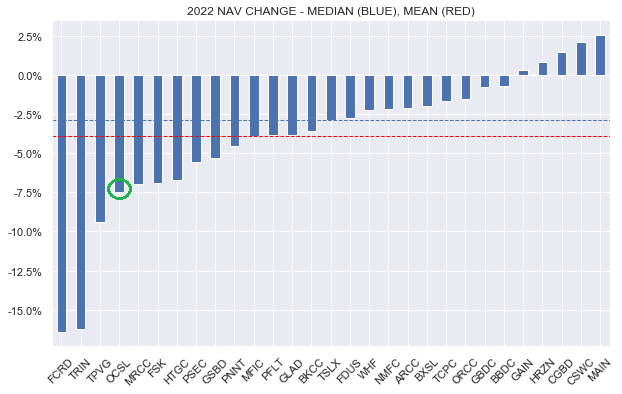
This chart is from our previous update and shows that the company’s NAV tends to be more volatile than the sector despite having a lower-beta underlying portfolio, consisting of higher-quality secured loans. In other words, the NAV gets marked down aggressively on drops and then gets marked back up during recoveries.
Systematic Income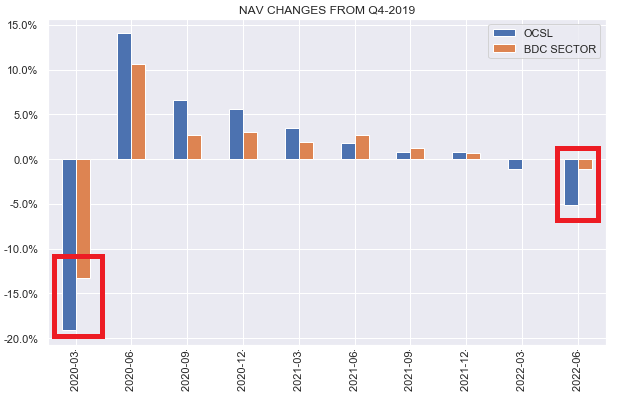
This has two implications for the stock. First, we expect the company’s NAV to underperform during a drawdown and outperform during the inevitable recovery phase. And two, the company’s valuation is slightly overstated – perhaps by 2-3%, i.e. the valuation is cheaper than it seems in our view relative to the sector. So, while OCSL currently trades at a valuation 7% above the sector average, in our view, it is more like 4-5% on an apples-to-apples basis.
Adjusted net income rose by 6% from the previous quarter and came in flat to Q1.
Systematic Income BDC Tool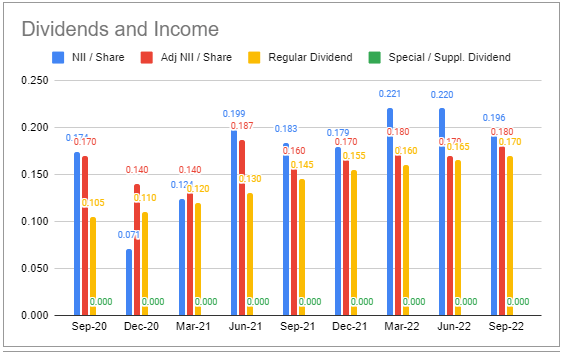
Net income itself did not rise to a new high due to an unusually high level of fees in the Jun-21 quarter. Importantly, however, interest income (blue bars) did rise to as high as the following chart shows.
Systematic Income BDC Tool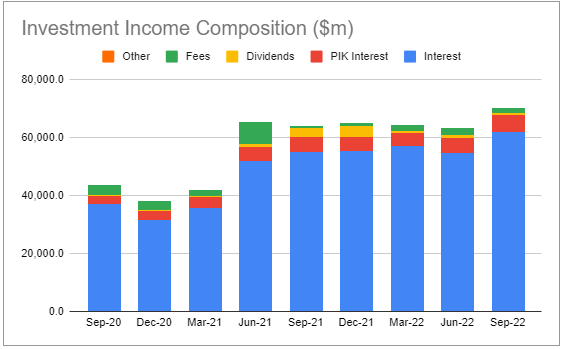
The company added to a number of bank bridge loans well below par which they expect to realize significant pull-to-par gains over the medium term. There is a significant overhang of loans which are being cleared out by the banks and this technical pressure on a few large deals offers an opportunity for OCSL which can allocate across both private and public loan markets, unlike nearly all other BDCs.
Income Dynamics
Net new investments were negative as sales / repayments exceeded new commitments, providing a marginal headwind to income in Q4.
Systematic Income BDC Tool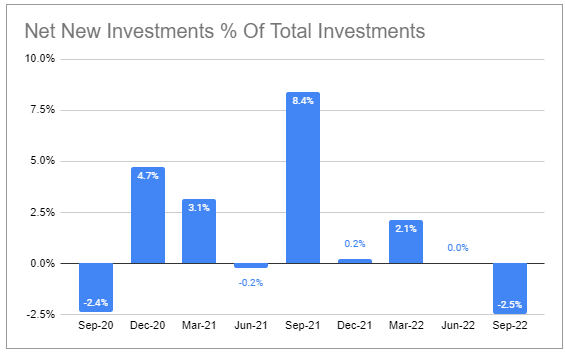
The yield on assets increased sharply to 10.6%, exceeding the rise in interest expense. New assets are also going into the portfolio at a higher-rate than the exits, providing another small income tailwind.
Systematic Income BDC Tool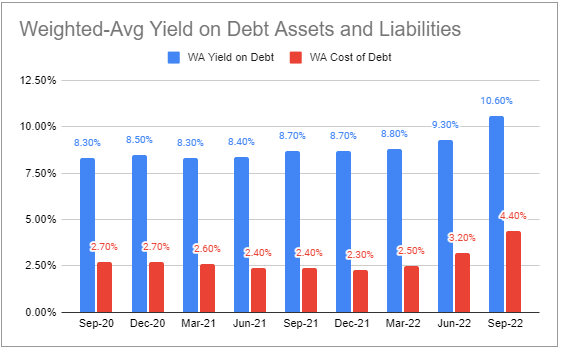
The company’s net income beta to short-term rates is relatively low at +7.6% vs. 11% sector average for a 1% rise in short-term rates.
Systematic Income BDC Tool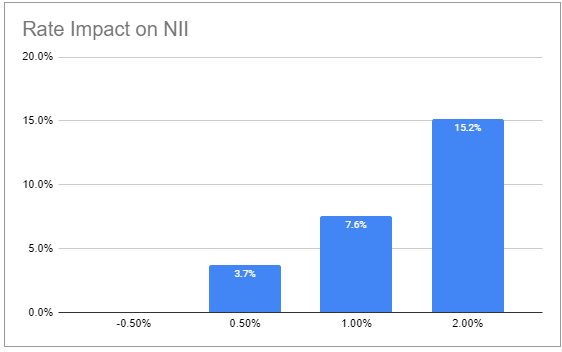
This is for three reasons – a below-average level of leverage (1.08x vs. 1.14x), a below-average level of floating-rate assets and an above-average level of floating-rate debt. The company can relatively easily boost its leverage – in fact, it is operating well below the 1.25x upper end of its target range (0.90x – 1.25x). However, the nature of its assets and liabilities will be much more difficult to change. For this reason we don’t expect OCSL dividends to rise as much as the rest of the sector.
Systematic Income BDC Tool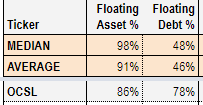
Portfolio Quality
Non-accruals remained at zero.
PIK increased over the previous quarter, however, according to management the increase was due to investments originated as PIK rather than amendments due to credit issues.
Systematic Income BDC Tool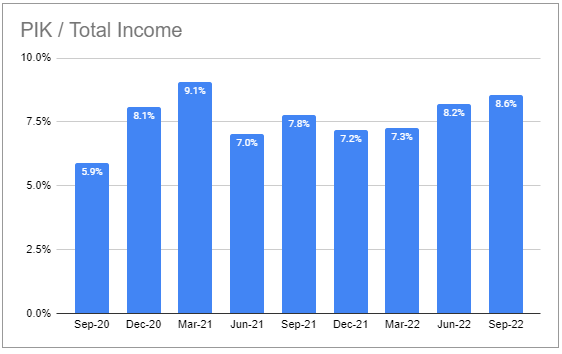
There were net realized losses for the first time in the last couple of years. Historically, the company has done an exceptional job of keeping realized losses at bay.
Systematic Income BDC Tool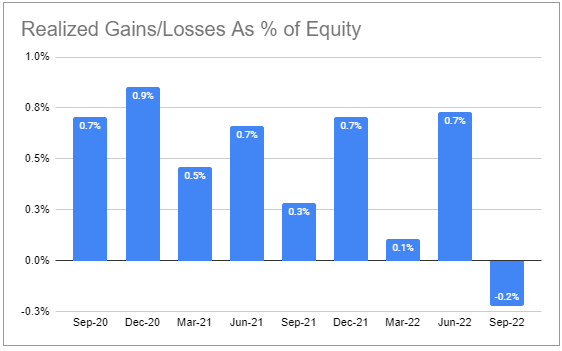
The weighted-average interest coverage of portfolio companies declined to 2.7x which is, anecdotally, on the higher side in the sector of the BDCs that have made this disclosure.
Return And Valuation Profile
OCSL has had an interesting valuation profile. It tended to trade at a depressed valuation further back when it took over the Fifth Street portfolio. However, once investors caught on to its strong management the valuation gap started to close.
Systematic Income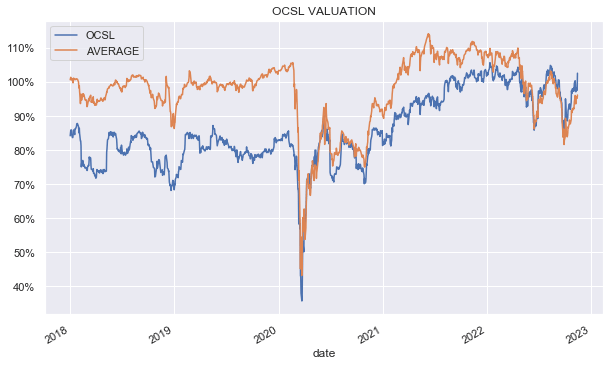
The chart below shows a valuation differential to the sector average. The current valuation differential stands at a record high of 7% and does look expensive in our view, though, as discussed above, it’s likely somewhat overstated.
Systematic Income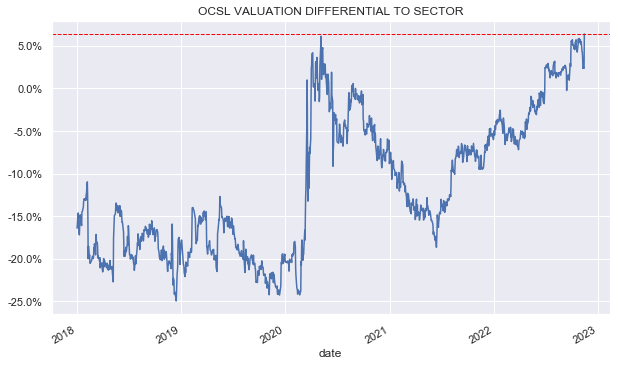
3Y total NAV returns are somewhat below the sector average. The 5Y total NAV return should start feeding in our BDC Tool in 2023. And again, total NAV returns are likely biased a little lower due to conservative NAV marks. On a through-the-cycle basis OCSL is an outperformer in our view.
Systematic Income BDC Tool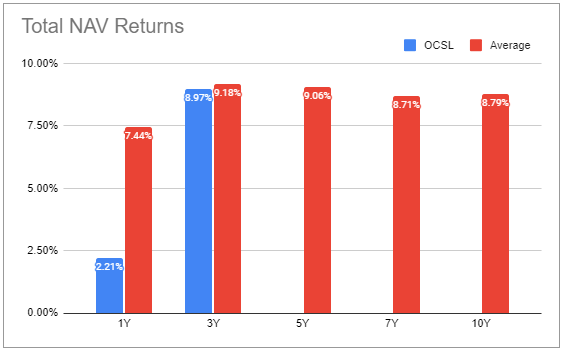
Takeaways
As we discussed in our last update, OCSL net income should continue to move up, driving further dividend hikes while a conservative approach to portfolio marks means the NAV is likely to remain volatile. This is precisely what transpired this quarter and is what we expect over the rest of the year as well.
Overall, OCSL remains an attractive defensive option for BDC investors. It focuses on larger, more established companies and allocates primarily to secured loans. Despite this higher-quality allocation, it has put up sector-matching returns. The current valuation is on the expensive side in our view and we would wait for a better entry point to allocate new capital.
Be the first to comment