

David Becker
Q2 recap and thesis
NVIDIA (NASDAQ:NVDA) reported its FY2023 Q2 results last Wednesday. Overall, the business delivered a record FY 2022. Revenues grew 61% compared to FY 2021. Combined with a gross margin expansion of a whopping 120 basis points (from 65.6% in FY2021 to 66.8%), bottom-line growth was even more impressive. Operating income and EPS grew by 87% and 78%, respectively.
However, as a highly cyclical business, a contraction is expected to follow the peak. Indeed, the earnings release (“ER”) provided guidance that implied either severely muted growth or even contraction ahead. The market responded with a price correction of almost 5% in after-hours trading after ER. And on Friday, the hawkish comments from Fed Chairman Jerome Powell added further fuel to the fire. Its stock fell by almost 10% that day.
By this time, investors have already had time to fully digest the ER and reflect on the market reactions. And therefore, it is the goal of this article to provide a calmer analysis of the business. As a cyclical business, what NVDA is going through is the normal stages of the cycle. And we will just need to understand its current stage in the cycle so that we can be prepared.
To me, it is clear that we are in the early phase of the contracting stage. And in the remainder of this article, I will make a bold prediction that the current contraction will bottom near the end of 2022 and early 2023. Then I will also point out a few signs that investors to monitor to tell the contracting phase is ending.
Where are we in the cycle now?
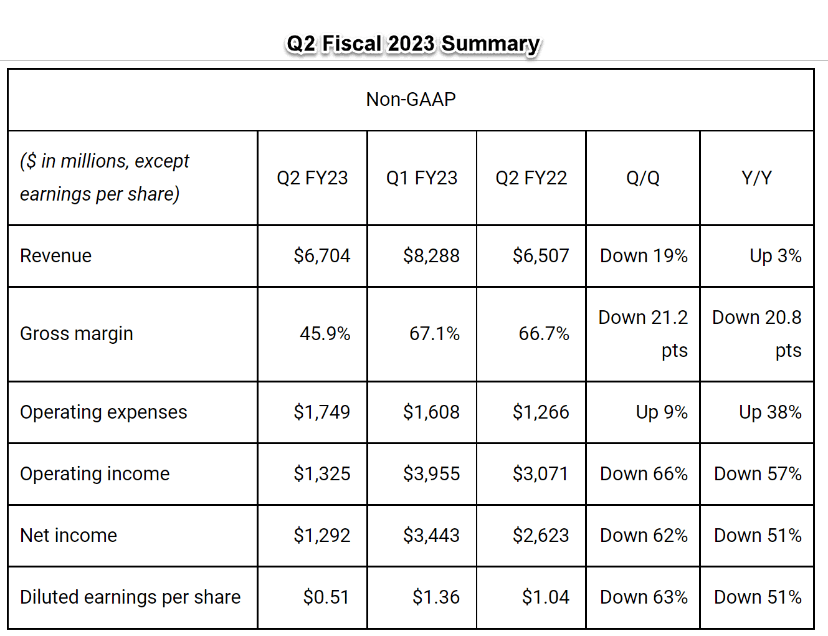
As aforementioned, NVDA’s past quarter and record FY2022 represented the peak of the last cycle. Looking forward, the business expects muted growth, margin contraction, and inventory renormalization, all typical signs for the beginning of the contracting phase. These factors are mentioned in comments provided by its CFO Colette Kress during the ER (abridged and emphases added by me):
…we expect Gaming and ProViz revenue to decline sequentially as OEMs and channel partners reduce inventory levels to align with current levels of demand and prepare for our new product generation. We expect that decline to be partially offset by sequential growth in data center and automotive. Revenue is expected to be $5.9 billion plus or minus 2%. GAAP and non-GAAP gross margins are expected to be 62.4% and 65%…
To put the margin pressure under perspective, the lower end of the guidance range (62.4%) is below its FY2021 level of 65.6% by 320 basis points, and below its peak level in Q1 FY23 by almost a whopping 500 basis points (470 to be exact). And note that during the past quarter, gross margin plunged to only 45.9%. The combination of a muted top line and a contracting margin translates into a sharp decrease in earnings. The consensus estimate of its next year’s earnings now stands at $3.42 EPS, representing a 23% decline from its FY2022 level.
And next, we will see why I expect such growth and margin pressure to persist in the next half a year or so.
NVDA Q2 ER NVDA Q2 ER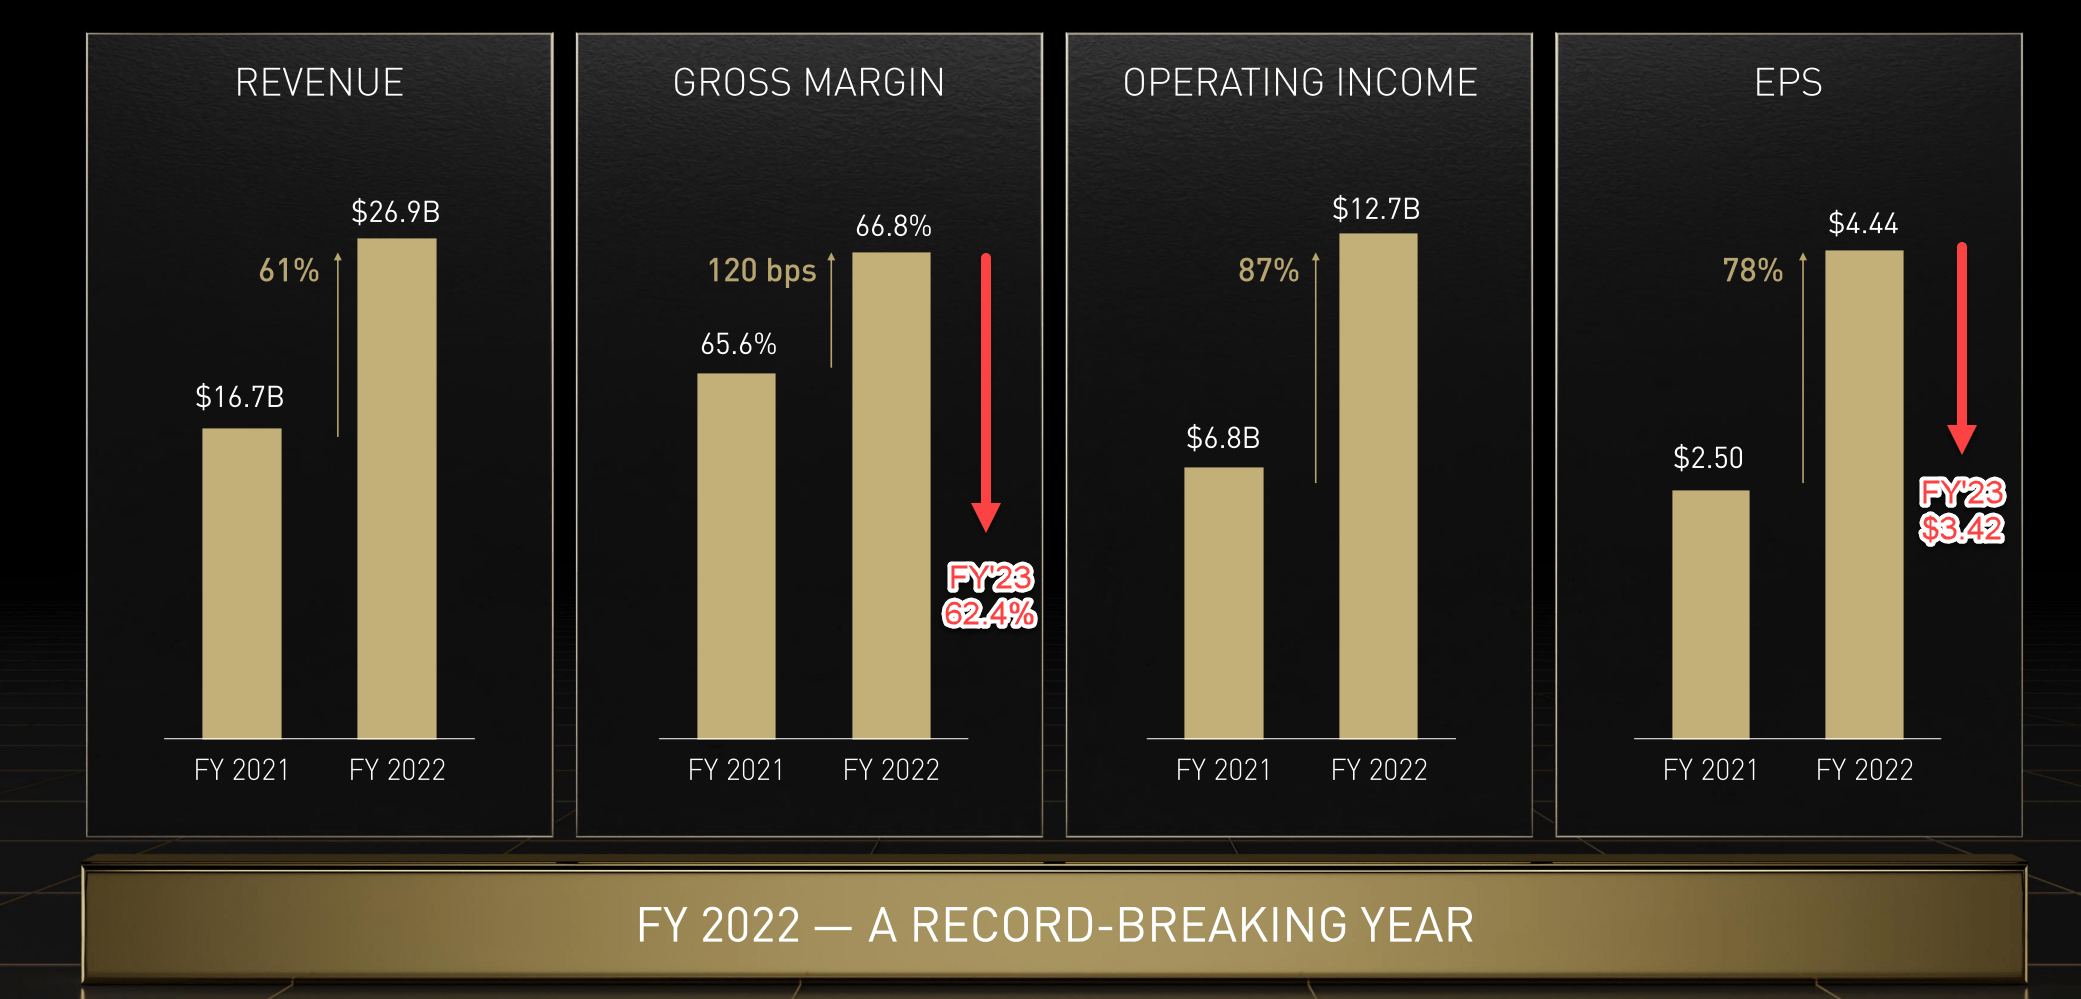
When will the contraction bottom?
The chart below shows the quarterly YoY growth of NVDA’s operating revenues in the past 10 years. As you can see, it went through two full cycles in the past ten years, each lasting about 3.5 to 4 years.
The first expansion cycle peaked in early 2014 and peaked again in early 2018, resulting in a cycle duration of about 4 years. And the second cycle peaked in early 2018 and peaked again during mid-2021, lasting for about 3.5 years.
The bottom of the previous contraction occurred in mid-2019 as you can see from the chart below. If history is of any guidance, I expect the current contraction phase to also last about 4 years too, which translates into sometime in later 2022 and early 2023.
And as we will see next, besides the historical pattern, there are fundamental reasons to expect such persisting pressure too.
Seeking Alpha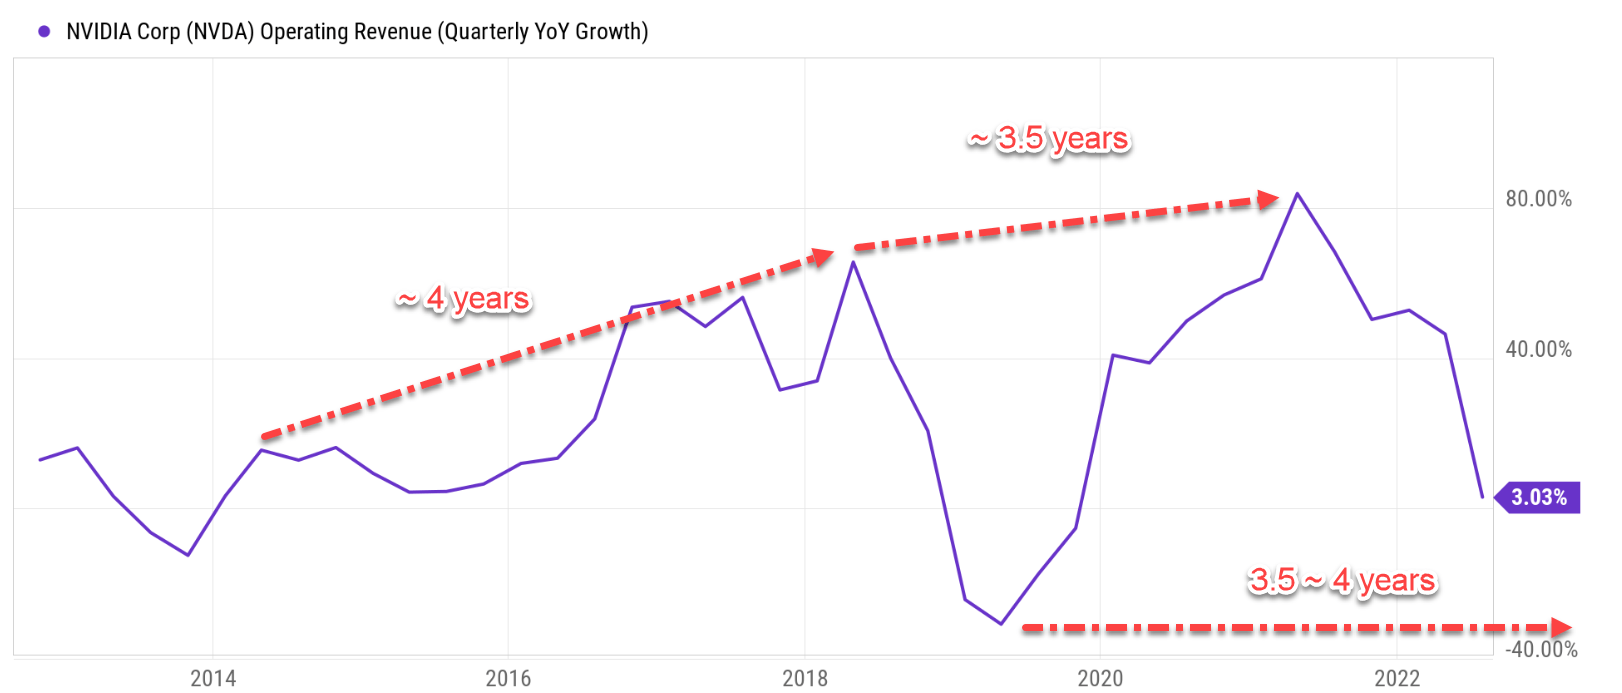
Chip shortage, chip glut, and signs to look for
To better explain the dynamics of the cycle, the next chart, taken from this Reuters report, shows the cyclicality of the entire chip sector. You can see the sine wave nature of the cycle more clearly for the whole sector than NVDA above because the random fluctuations are better filtered out for the sector. And note the ~4 years of cycle duration again. The growth peaked in early 2018 and then again in 2021 September, following the 4-year cycle length to good precision.
For good reason, the report compared the current situation of the semiconductor industry to toilet paper hoarding when the pandemic first broke up. Companies began stockpiling chips earlier this year because of the fear of not being able to get chips when they need them (just like people hoarding toilet paper when COVID first broke out). And quickly, the shortage turned into an inventory glut, as to be examined next.
Seeking Alpha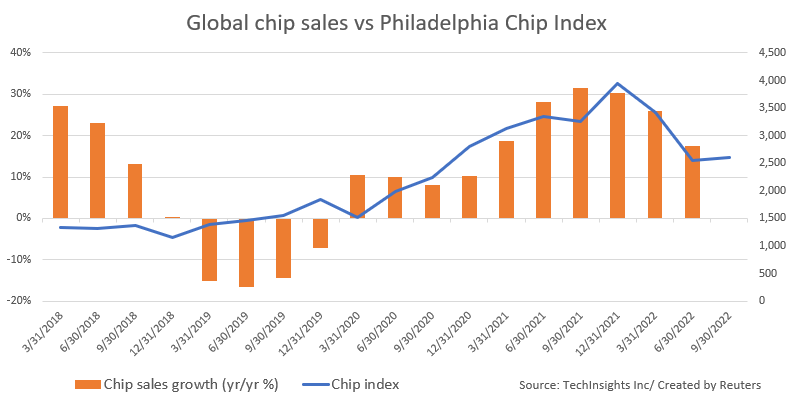
The next two charts examine such hoarding and inventory buildup for NVDA more closely. We will start with the top panel of the chart. NVDA’s inventory fluctuated in a range between about 63 days and about 85 days with an average of 81 days in the past 10 years. The peak of 148 days occurred in 2019 is clearly an extraordinary level. Nonetheless, it foreshadowed the bottom of the contraction during its last cycle if you recall from an early chart.
And if you look closely, you can see that NVDA’s inventories reached a 10-year peak around 2020 and 2021 (with the exception of the 148 days just mentioned). To me, this clearly illustrates the hoarding phase. Since then, the business has been trying to clear its inventory, but the current inventory still stands at about 85 days, far above average (and again, the average itself has been substantially biased already by the extraordinary level during 2019).
Now, let’s turn our attention to the bottom panel, which shows Taiwan Semiconductor’s (TSM) inventory buildup. I am examining TSM’s inventory here for two reasons. First, its inventory to me provides a good estimate for the whole sector. And secondly, NVDA itself is a major TSM client. We see the same picture here. The inventory for TSM has fluctuated in a range between about 37 days and 88 days with an average of 57 days in the past 10 years. You can clearly see the inventory drain in early 2020 due to the shortage, which was followed by a rapid buildup to the current record level of almost 88 days.
For me, it is quite straightforward to see the general direction of how things will go next. Both the market and NVDA will first have to digest the chips that they have hoarded at hand, which unfortunately will take some time in this case. Very likely, clearing the inventory will also require a price reducing, causing (or explaining) the margin pressure and muted top line growth mentioned before. The global demand will stay low due to the renormalization after the pandemic and the possibility of a recession. At the same time, global supply chain disruptions will persist. For example, its CFO Kress commented that the company has “undershipped” gaming cards, and its CEO Huang commented that “We are navigating our supply chain transitions in a challenging macro environment and we will get through this…”
Seeking Alpha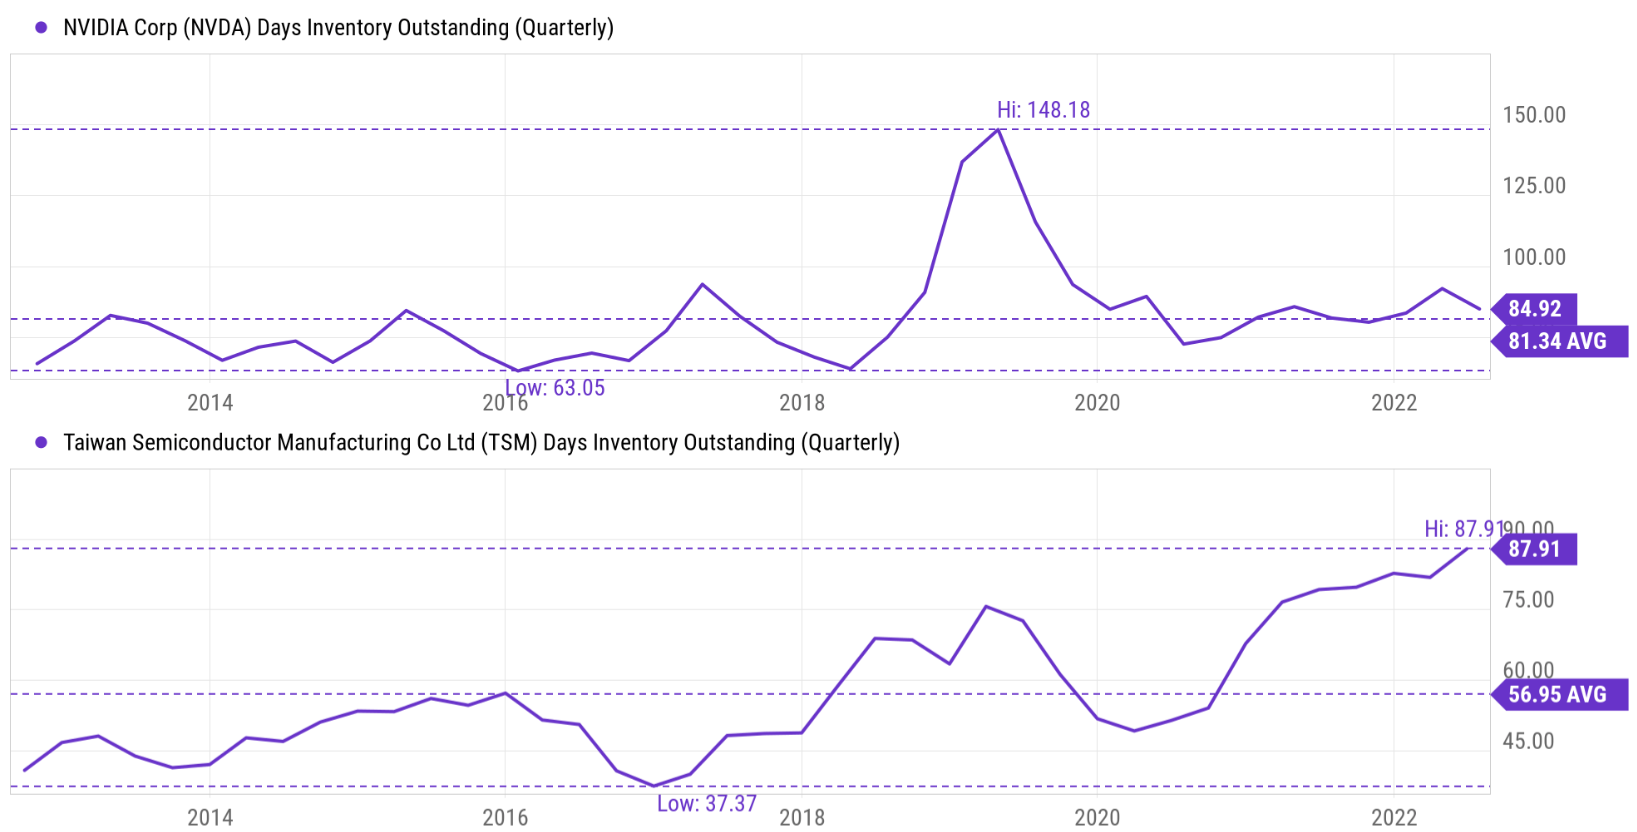
CHIPS Act timeline
Besides monitoring the inventory level of NVDA and TSM, another sign that investors can monitor is the progress of the CHIPS Act. Although the act is anticipated to benefit Intel (INTC) the most, other fabless chip stocks, including NVDA, will be beneficiaries as well as argued in our earlier article. However, the impacts of the act are not expected till 2024 according to the following BofA report. Nonetheless, the progress of the act and allocation of funding is worth monitoring and could provide leading signs for the cycle.
Any meaningful chips act output is unlikely before 2024 or 2025 given time taken for fund allocation, clean room construction and tools deployment.
Final thoughts and other risks
I have written several articles cautioning readers about NVDA in the past, especially with prices near $190 or above. My concerns included the status of the cyclical, valuation risks, and also the exposure to cryptocurrency (more on this a bit later). So, to a degree, its recent ER is not too surprising given the regularity of the past cycles and the warning signs of inventory buildup. And at the same, I see no particular reason to be too concerned now. On the contrary, the large price corrections during the past week have reduced the valuation risks by a good amount. And management’s guidance has provided clarity to what’s coming next.
Finally, besides all the risks mentioned above, NVDA’s exposure to cryptocurrencies represents another risk that is difficult to quantify, as its CFO Colette Kress commented during the ER. My view is that the current crypto crash will keep causing a sizable impact on NVDA both due to market psychology and also business fundamentals, especially due to Ethereum’s pending network transition from proof-of-work to proof-of-stake (the so-called Merge). Readers interested in more detail could take a look at my earlier article that focused on the crypto impact.
As noted last quarter, we had expected cryptocurrency mining to make a diminishing contribution to gaming demand. We are unable to accurately quantify the extent to which reduced crypto mining contributed to the decline in gaming demand. While Gaming navigates significant short-term macroeconomic challenges, we believe the long-term fundamentals in Gaming remain strong.
Be the first to comment