

chonticha wat
After rising to a record high of $2072 per ounce in March 2022, gold ran out of upside steam. Gold had a lot going for it in 2022, with inflation at a four-decade high and geopolitical tensions rising to the worst level since WW II. While gold spiked higher when Russia invaded Ukraine, the price declined by over $300 per ounce, and the short-term trend remained bearish as of Sept. 12, 2022.
Trend-following makes a short approach to the gold market compelling in the current environment. However, the odds favor a bottom, reversal, and move toward the $2,000 per ounce level sooner rather than later. The short-term charts are bearish, but the longer-term technical price action warns that price corrections have been buying opportunities for over two decades.
Gold mining shares tend to outperform the price of the metal on a percentage basis when gold moves higher and underperforms during corrections and bearish trends. The miners provide leverage as they invest significant capital in extracting the ores from the earth’s crust. Meanwhile, the Direxion Gold Miners 2X Bull product (NYSEARCA:NYSEARCA:NUGT) turbocharges the already leveraged gold mining companies’ performance when gold decides to move higher. NUGT is a short-term trading tool, so timing is critical for success with the product.
The Fed’s commitment to fighting inflation is pushing rates higher
After calling rising prices a “transitory” event throughout most of 2021, the US Federal Reserve hit the panic button as the consumer and producer price indices rose to the highest levels in four decades late last year. During the past few months, dovish Fed economists transformed into hawks, rapidly increasing the short-term Fed Funds rate by 75 basis points in June and July. While the jury is still out, the odds favor another 50 or 75 basis point increase in the short-term benchmark rate at the September 20-21 FOMC meeting. The central bank’s primary focus is putting out the inflationary fire and pushing it back to its 2% target level.
Moreover, quantitative tightening, or reducing the central bank’s swollen balance sheet, doubled this month, putting upward pressure on interest rates further out along the yield curve. The bond market has been falling as the central bank has taken a no-nonsense approach to battle inflation.
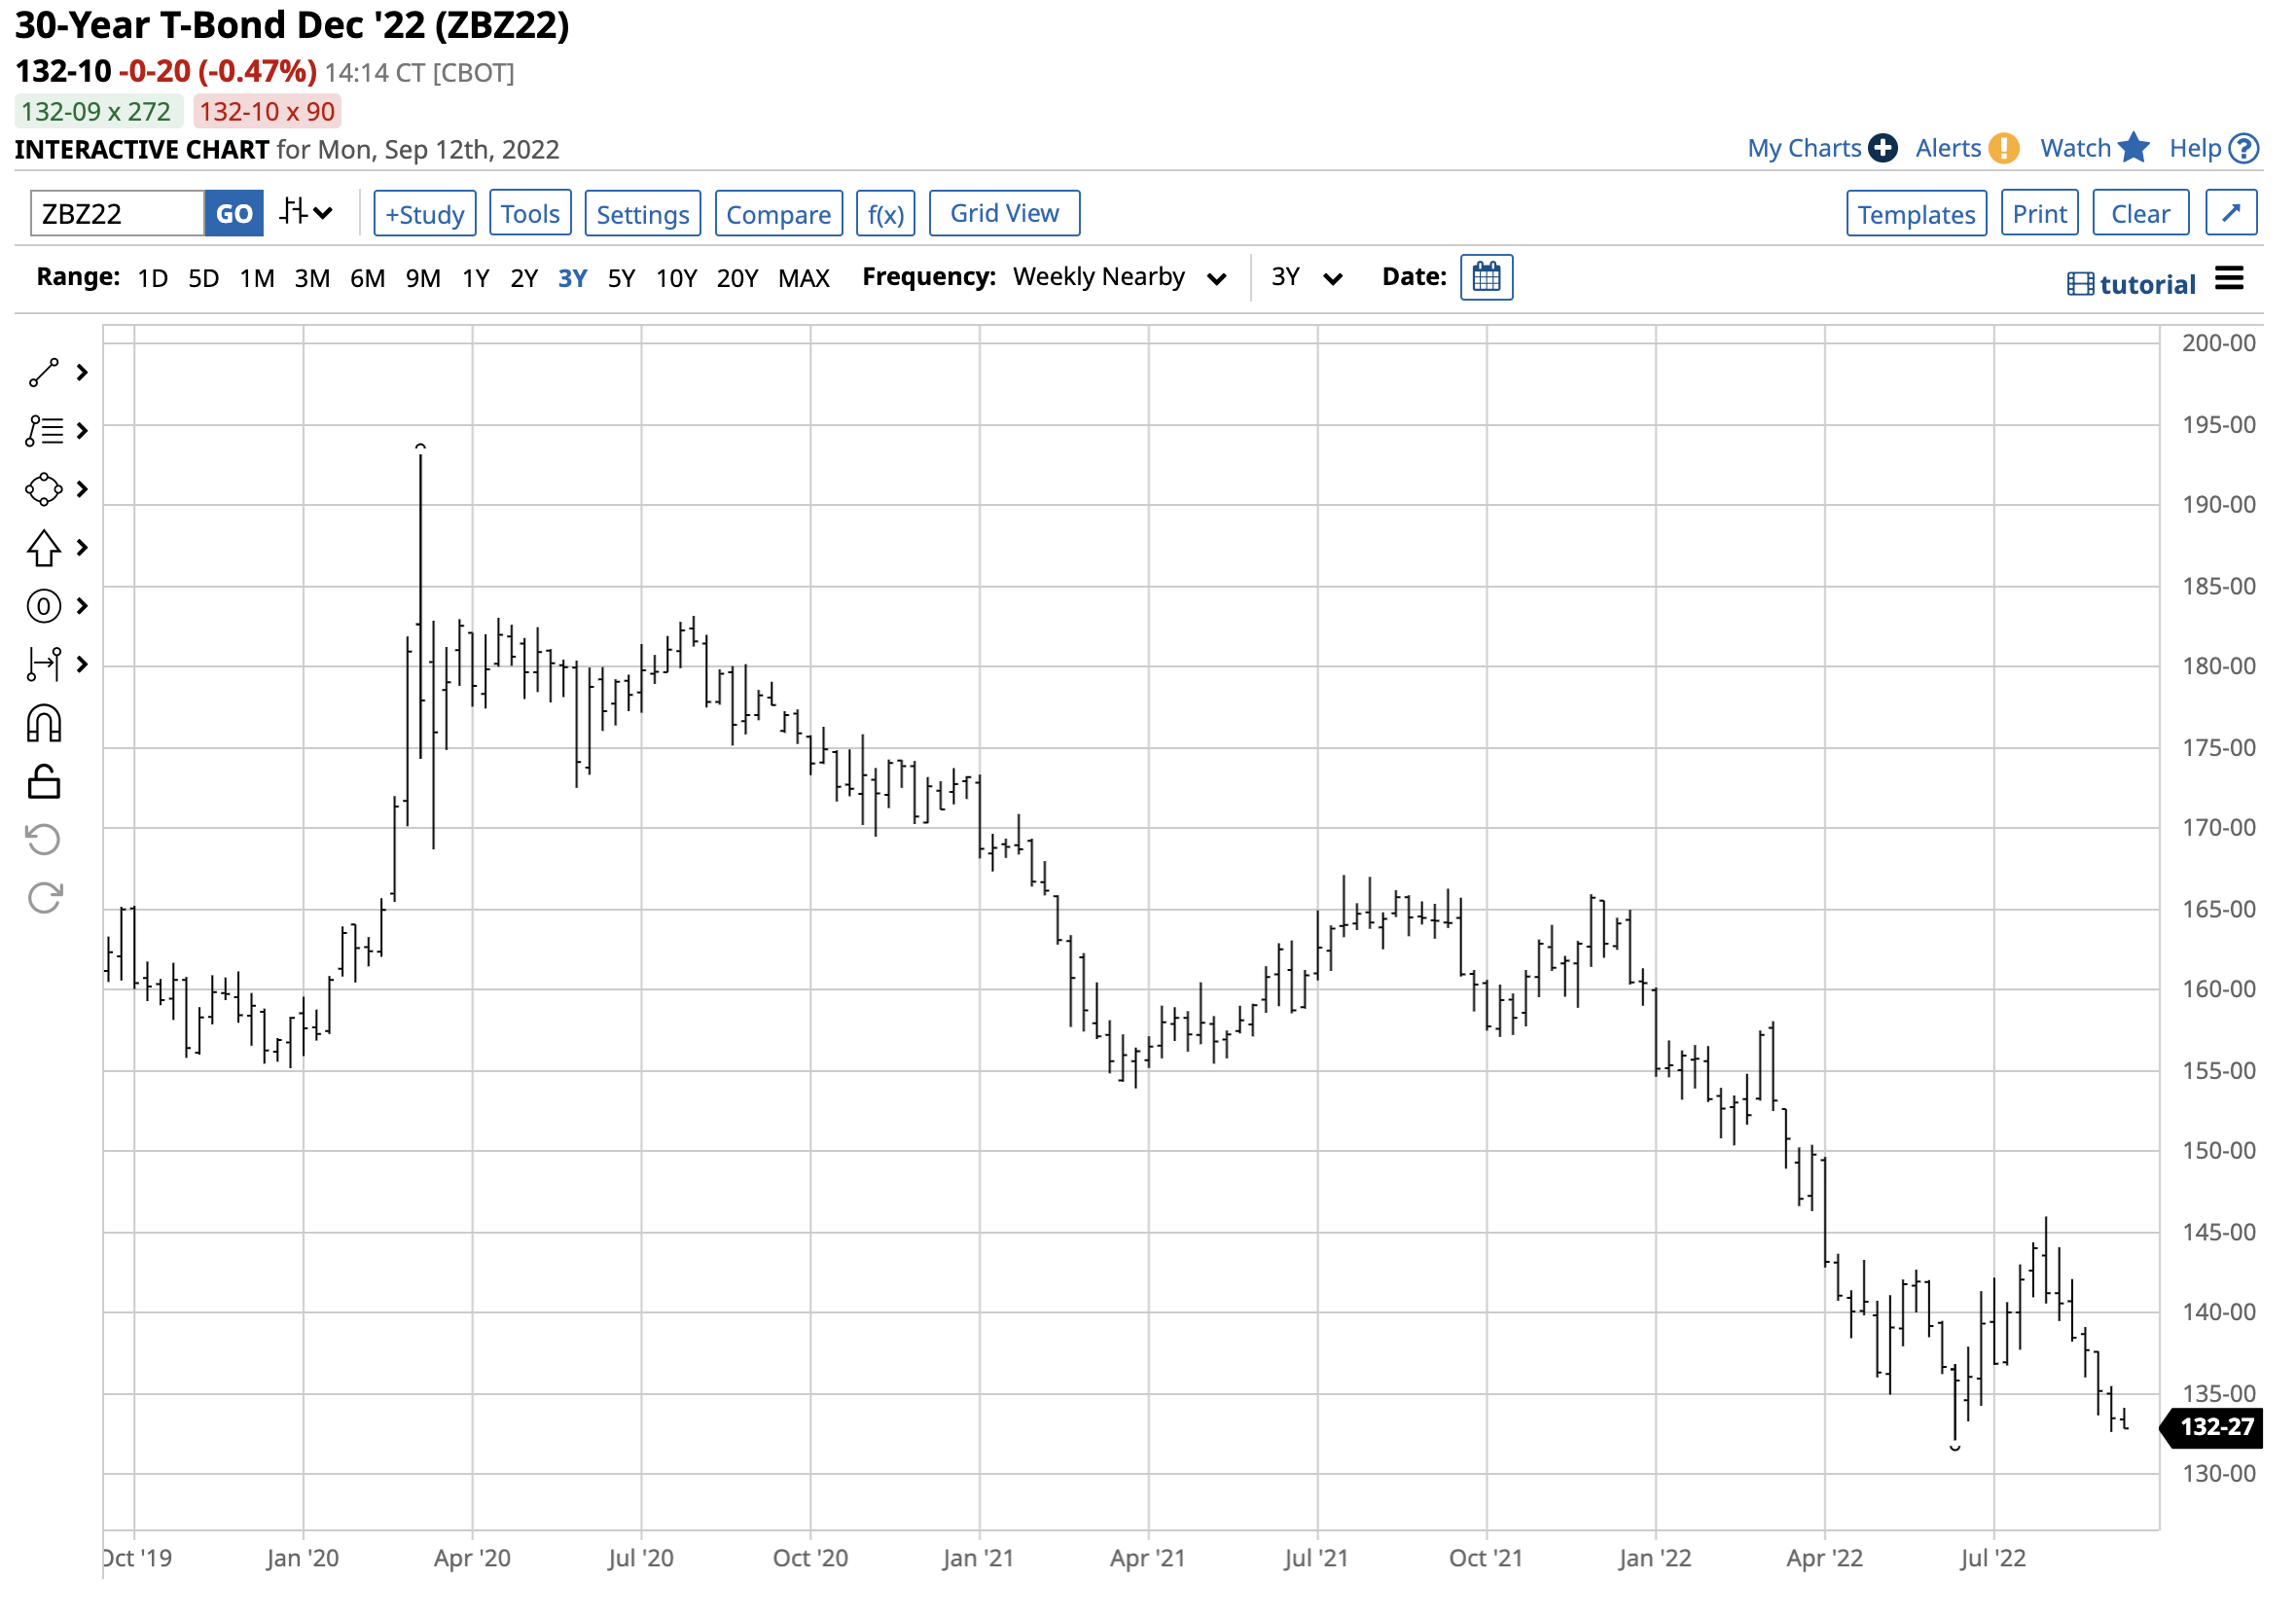
US 30 Year Treasury Bond Futures (Barchart)
The Fed determines short-term rates, but the rates further out along the yield curve are a function of market forces. The US 30-Year Treasury bond futures chart highlights the bearish trend of lower highs and lower lows since 2020, with the futures trading to 132-04 in June 2022, the lowest level since April 2014. At the 132-10 level on Sept. 12, the long bond was at the low as the market continued to expect interest rates to rise. The old saying, “don’t fight the Fed,” is prescient in the current environment.
Rising interest rates tend to take the shine off gold as they increase the cost of carrying the precious metal. Moreover, higher interest rates make fixed-income assets more attractive as they compete with gold for capital.
The US dollar rose to a two-decade high
Interest rate differentials tend to impact currency values. The US dollar is the world’s leading reserve foreign exchange instrument and the benchmark pricing mechanism for most commodities, including gold. While the international gold market’s hub is London in the UK, the metal trades in US dollars. A rising dollar tends to weigh on gold and other commodity prices as it causes them to rise in other currency terms.
The world’s second-leading reserve currency is the euro. The war in Ukraine is at Western Europe’s doorstep, with has added to dollar strength in 2022. The US dollar index measures the US foreign exchange instrument against other reserve currencies, with a 57.6% exposure to the euro. Rising US rates and the war in Ukraine have created a potent bullish cocktail for the US dollar index.
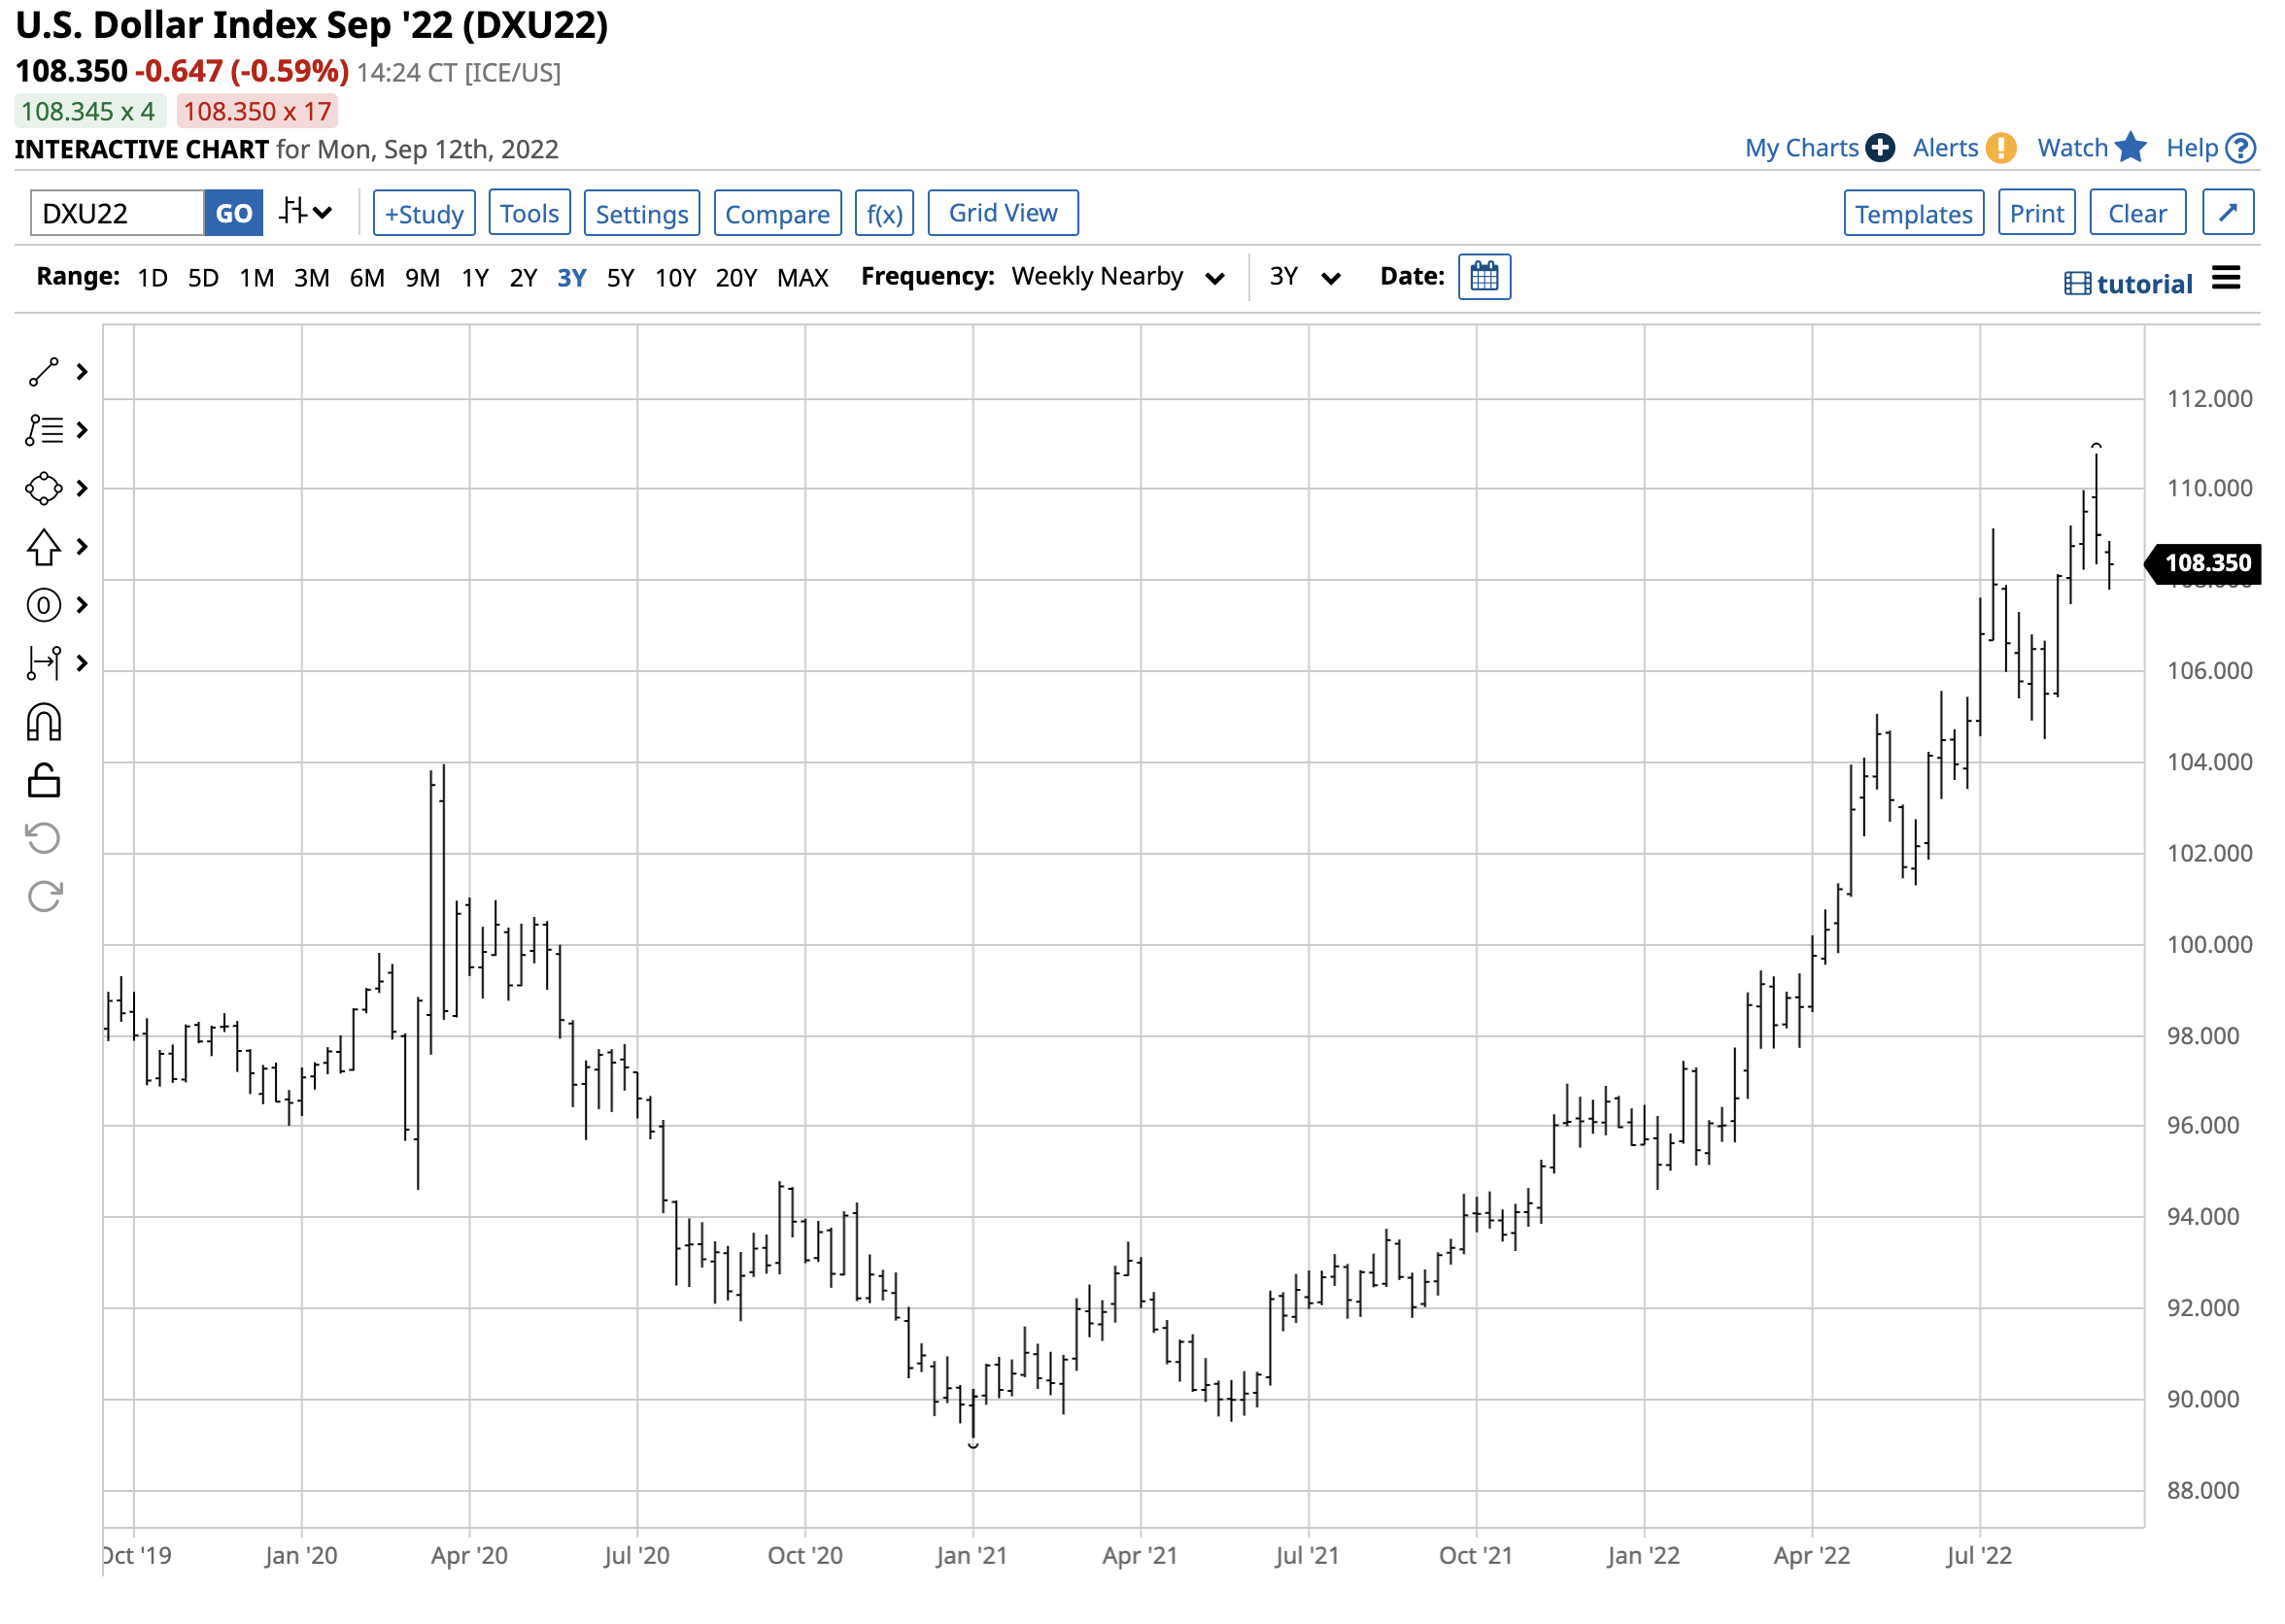
Dollar Index Chart (Barchart)
The chart illustrates the rise in the dollar index from 89.165 in early 2021 to the most recent high of 110.785 earlier this month, the highest level since 2002. A rising dollar index tends to weigh on gold prices.
Gold has made lower highs and lower lows since March 2022
Increasing interest rates and a bullish trend in the US dollar weighed on gold since March 2022, when the precious metal reached a record $2072 high.
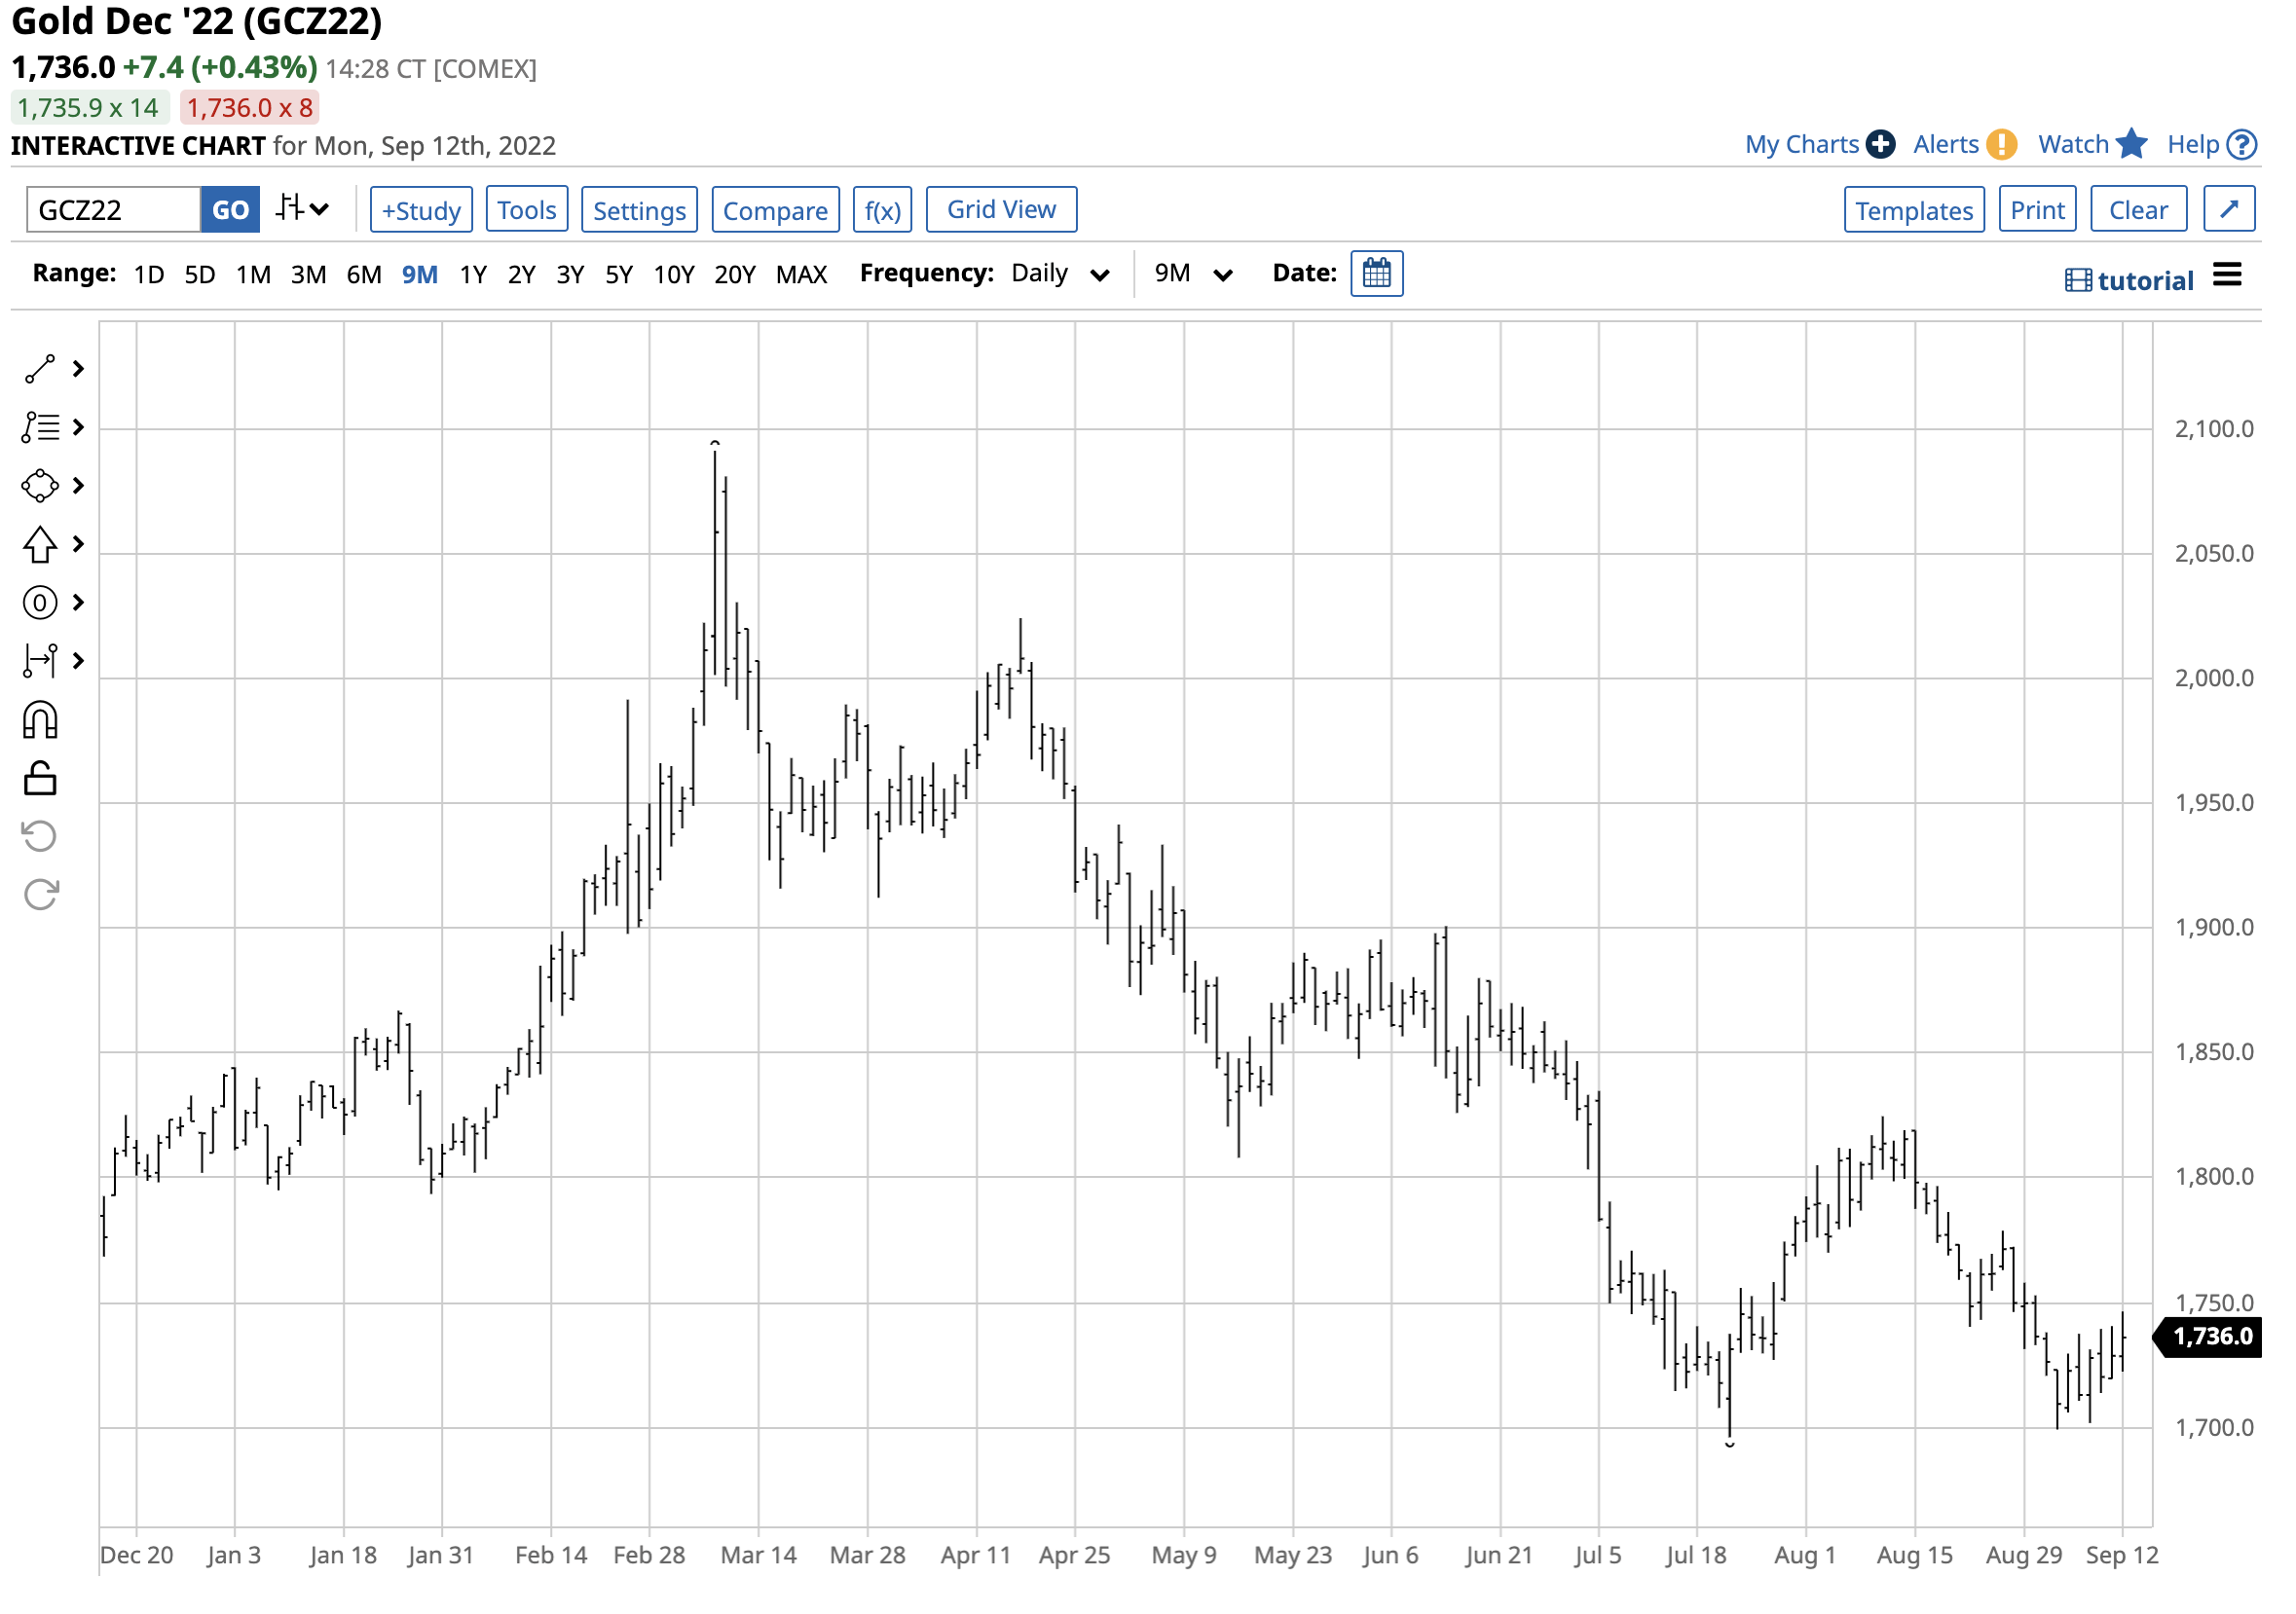
COMEX Gold Futures Chart (Barchart)
The chart shows the decline from $2091.40 on the nearby December COMEX futures contract in March 2022 to $1696.10 on July 21, an 18.9% correction on the back of the bond and currency market dynamics.
Every dip in gold has been a buying opportunity this century
While the short-term trend over the past six months is bearish, the long-term path of least resistance reveals the opposite trend.
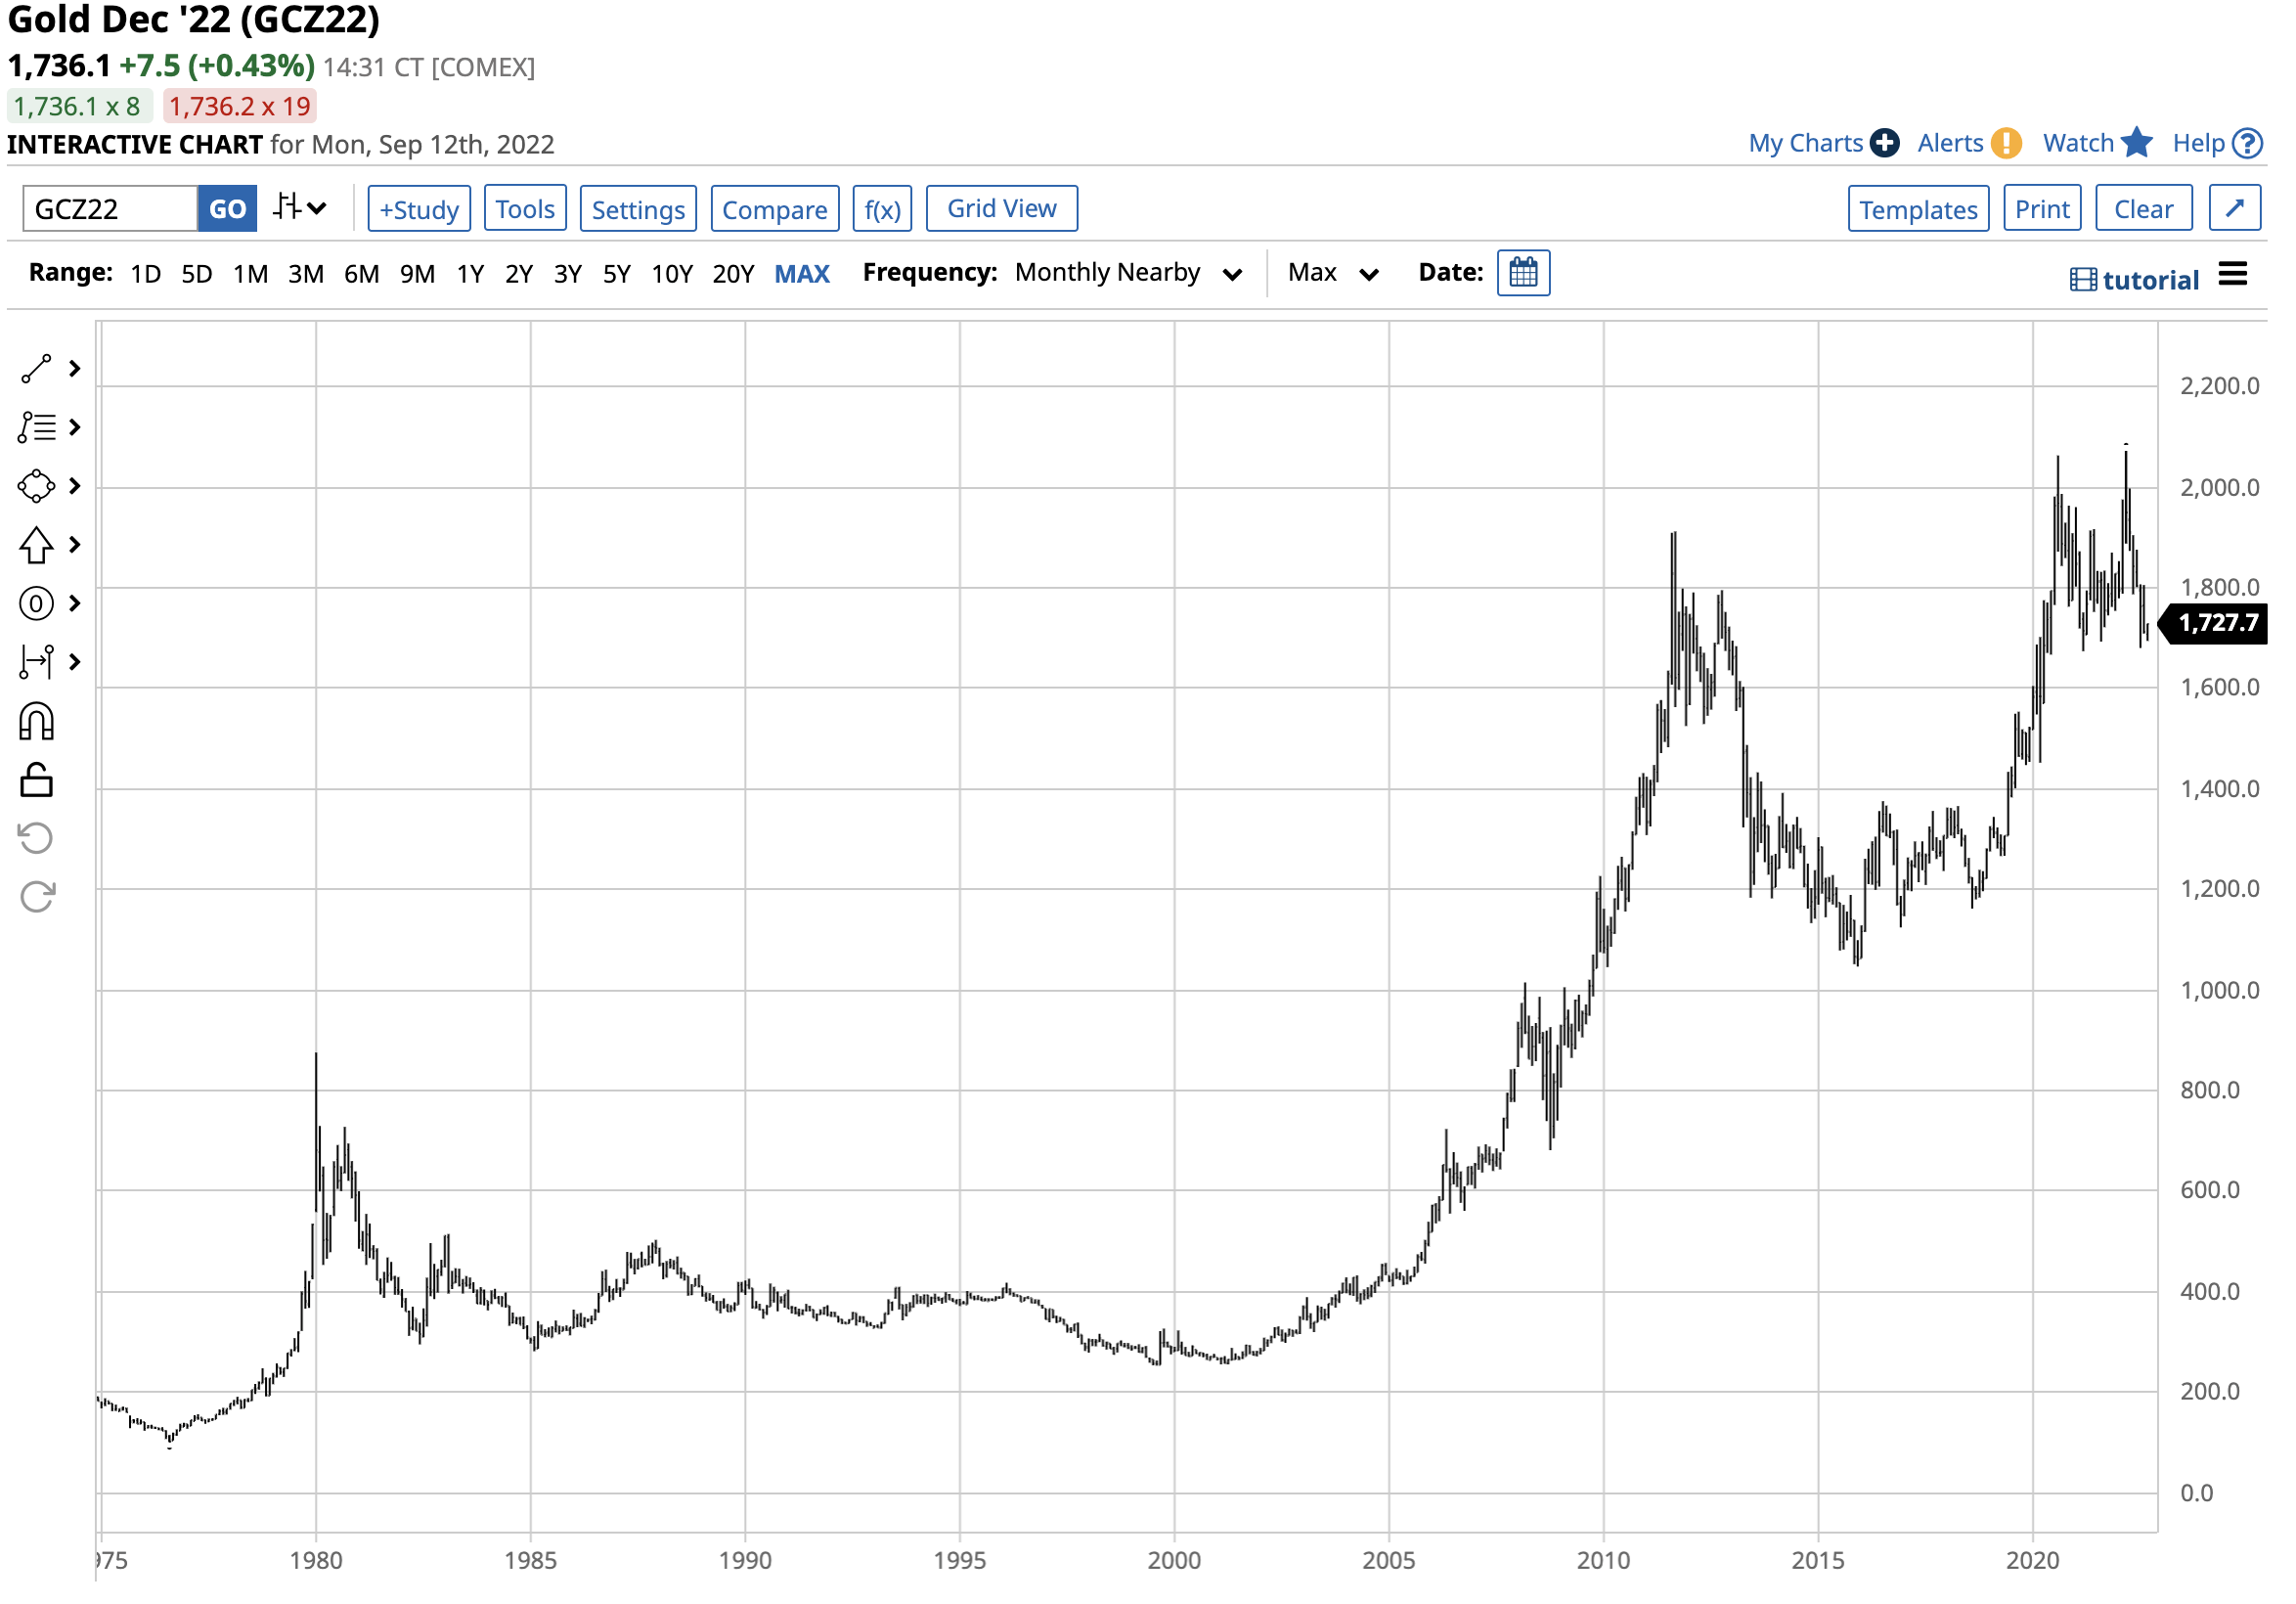
Long-Term Gold Futures Chart (Barchart)
After reaching a bottom of $252.50 in 1999, gold has consistently made higher lows and higher highs, with the most recent record peak occurring earlier this year. Even though gold is over $330 below the March high, the precious metal has not violated downside technical support levels. Since 1999, every significant dip in gold has led to higher highs. Gold at over $1700 per ounce remains impressive, given the rise in interest rates and the move in the dollar index to the highest level since 2002. In 2002, gold reached a high of $350.70, nearly 20% of the current price. In September 2022, the gold price continues to exhibit strength.
Mining shares tend to outperform gold on the upside – NUGT is a short-term product that turbocharges mining shares
Markets rarely move in straight lines; corrections are regular events. The ascent of interest rates and the US dollar could run into a correction as the Fed is ignoring two consecutive quarterly GDP declines.
In 2021, the central bank and administration said inflation was a “transitory” event, blaming rising prices on pandemic-related factors. The explosive rise in consumer and producer prices to the highest level in over four decades caused the central bank to change its tune and begin tightening credit.
In 2022, two consecutive GDP declines are the textbook definition of a recession, but the Fed and administration have characterized economic contraction as a “transition.” If they’re making another miscalculation in 2022, increasing interest rates and a rising dollar will only exacerbate economic contraction and push the US into a deeper recession. Rate hikes and inflation require opposing monetary policy tools, making stagflation a challenging condition. The bottom line is the Fed may find that it needs to curb its rate hike enthusiasm over the coming months if the recession worsens.
Ironically, artificially low interest rates and government stimulus programs planted inflationary seeds. Today, interest rate hikes fertilize recessionary pressure that will be the Fed’s next challenge.
When the markets begin to sense that the Fed will reconsider or slow the ascent of interest rates, we could see the next leg higher in the over two-decade gold bull market.
Gold mining shares offer leverage as extracting the metal from the earth’s crust is a capital-intensive business. Gold miners tend to outperform the metal’s price on a percentage basis during rallies and underperform when the gold price corrects lower. The GDX ETF is a diversified product that holds a portfolio of the leading gold mining stocks, including:
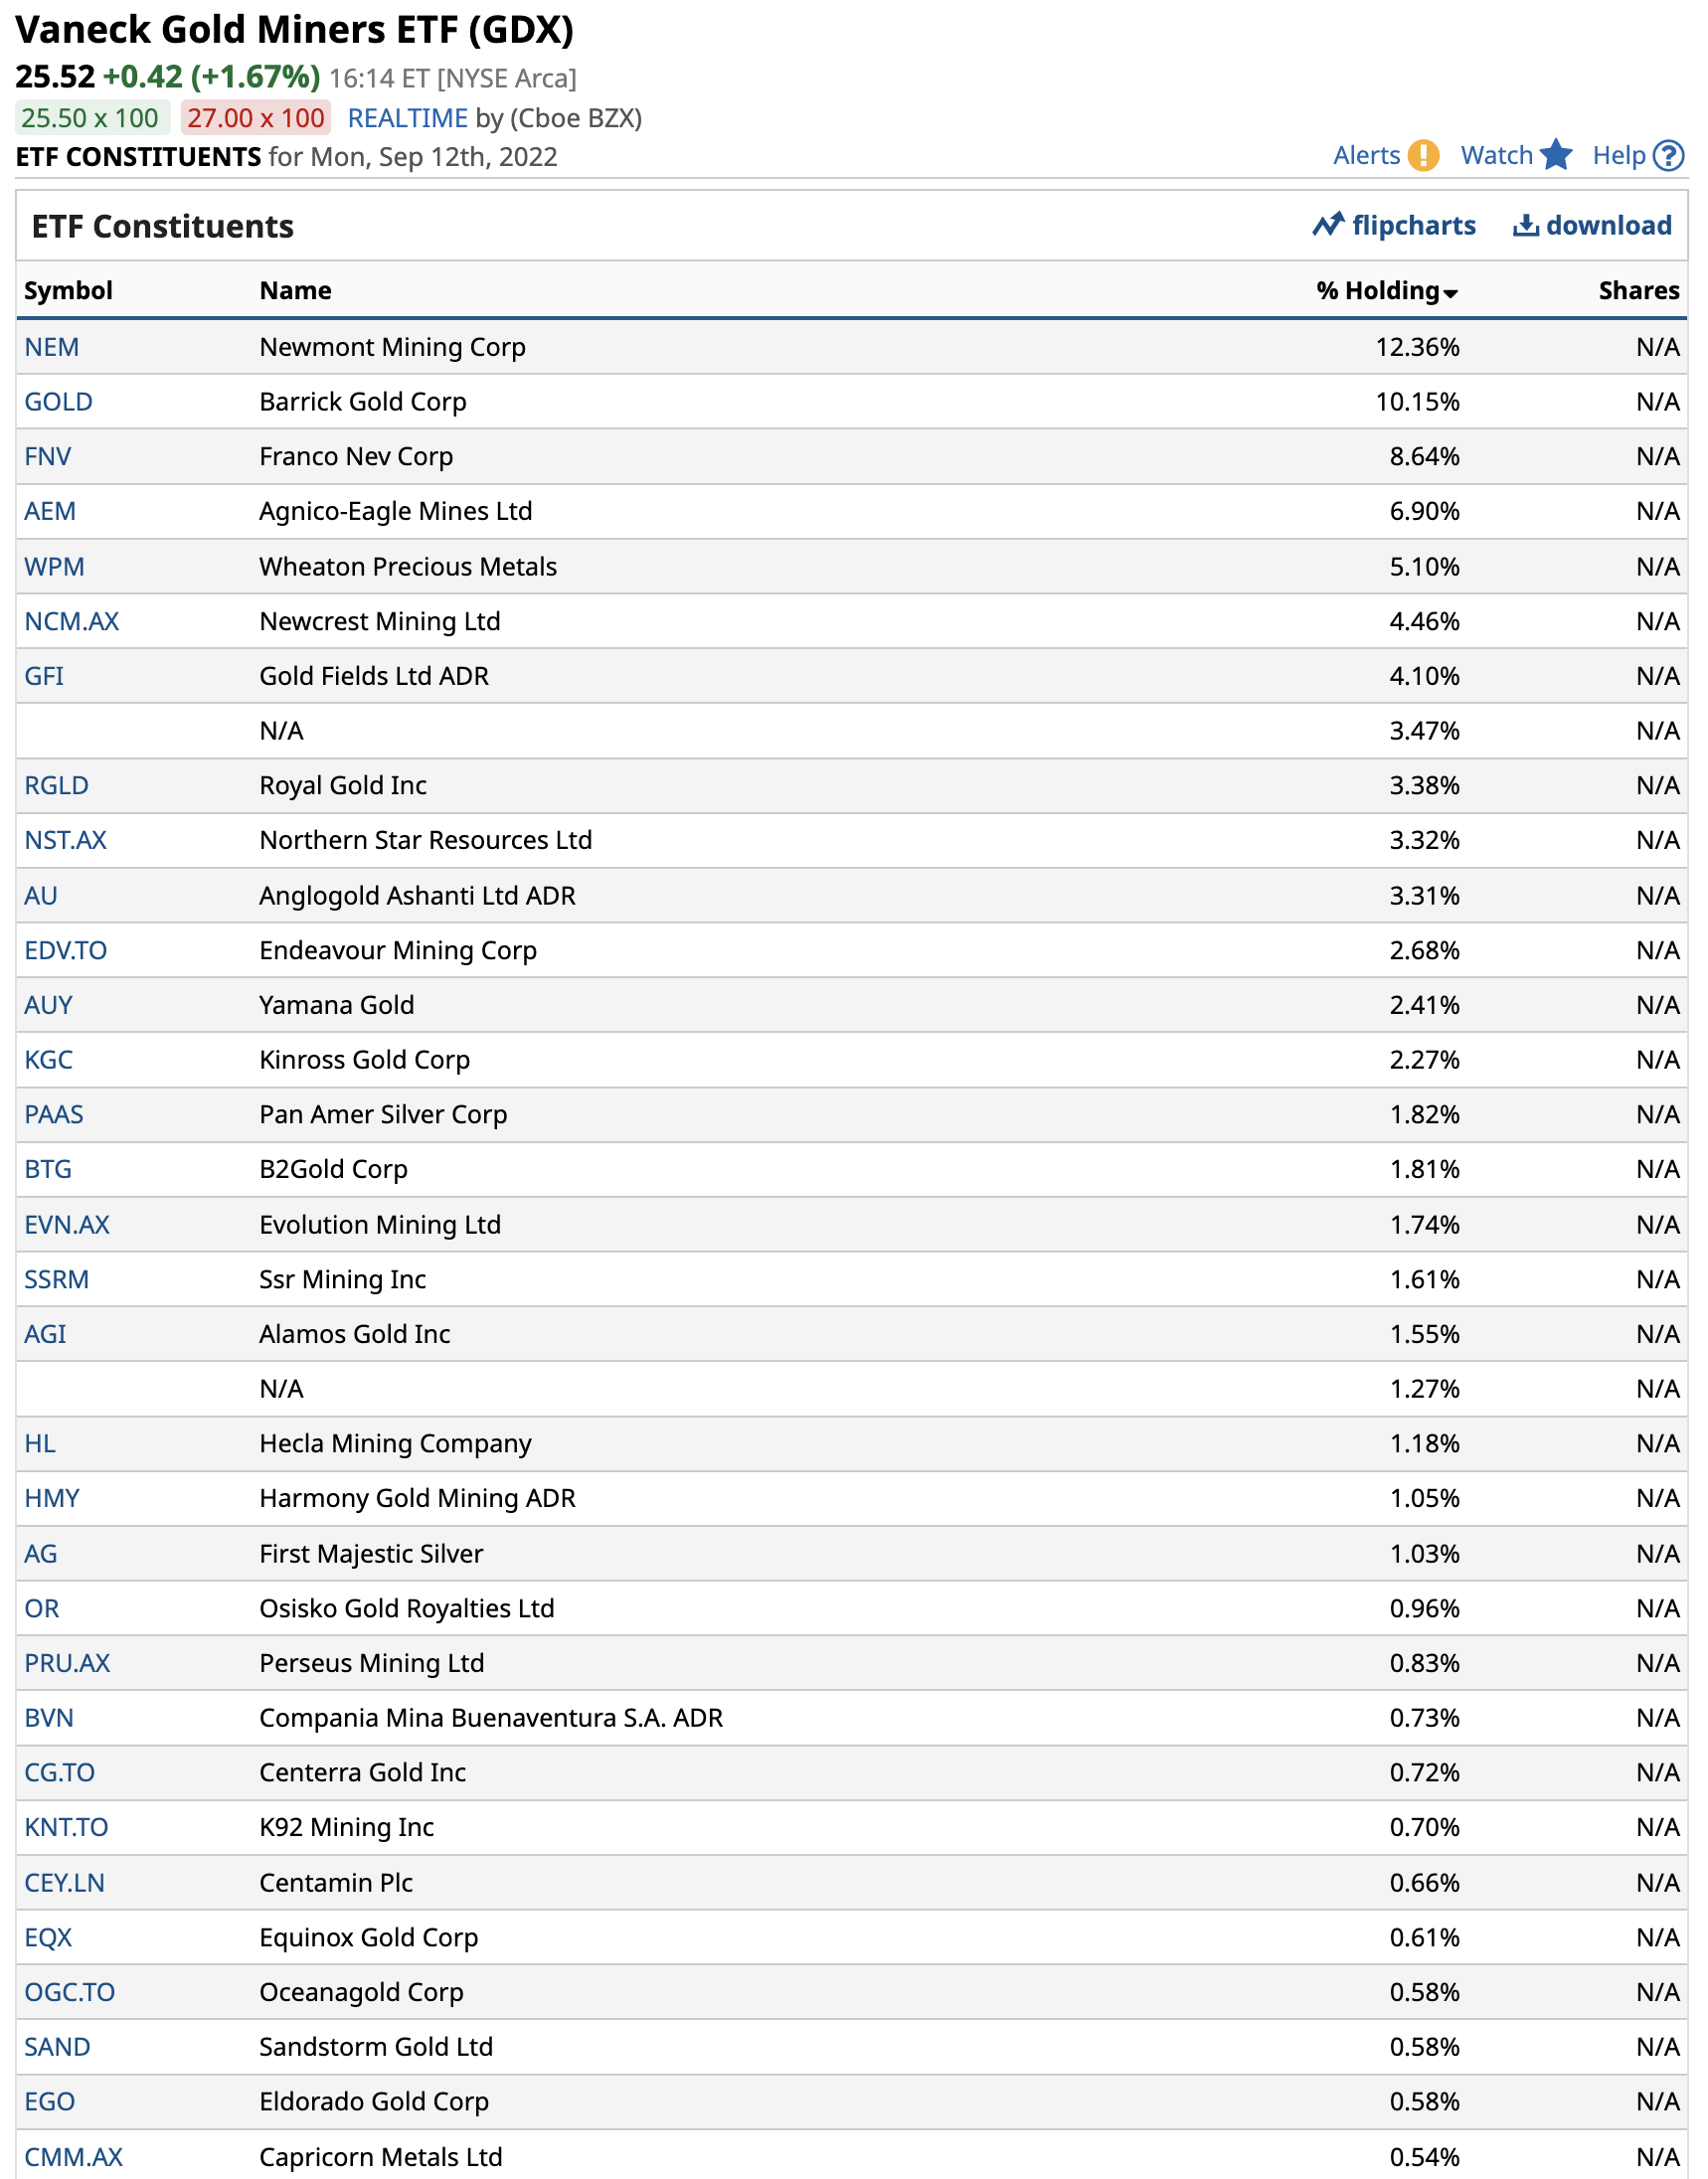
Top Holdings of the GDX ETF Product (Barchart)
While GDX provides leverage to the gold price, the Direxion Gold Miners 2X Bull product (NUGT) turbocharges the gearing. The fund summary for NUGT states:
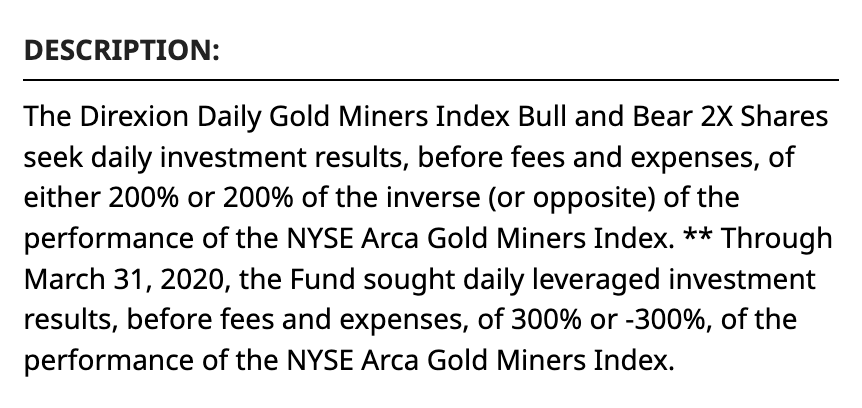
Fund Summary for the NUGT Product (Barchart)
At $28.69 per share on Sept. 12, NUGT had over $370 million in assets under management. The leveraged product trades an average of over 3.6 million shares daily and charges a 1.14% management fee.
Leverage comes at a price, time decay, and NUGT uses options to turbocharge its performance. Therefore, the product is only appropriate for short-term risk positions. However, after gold’s recent slide, this could be an excellent job to put the NUGT product on your buying radar.
The last significant rally in gold futures took the December futures price from $1732 in September 2021 to $2091.40 in March 2022, a 20.75% increase.
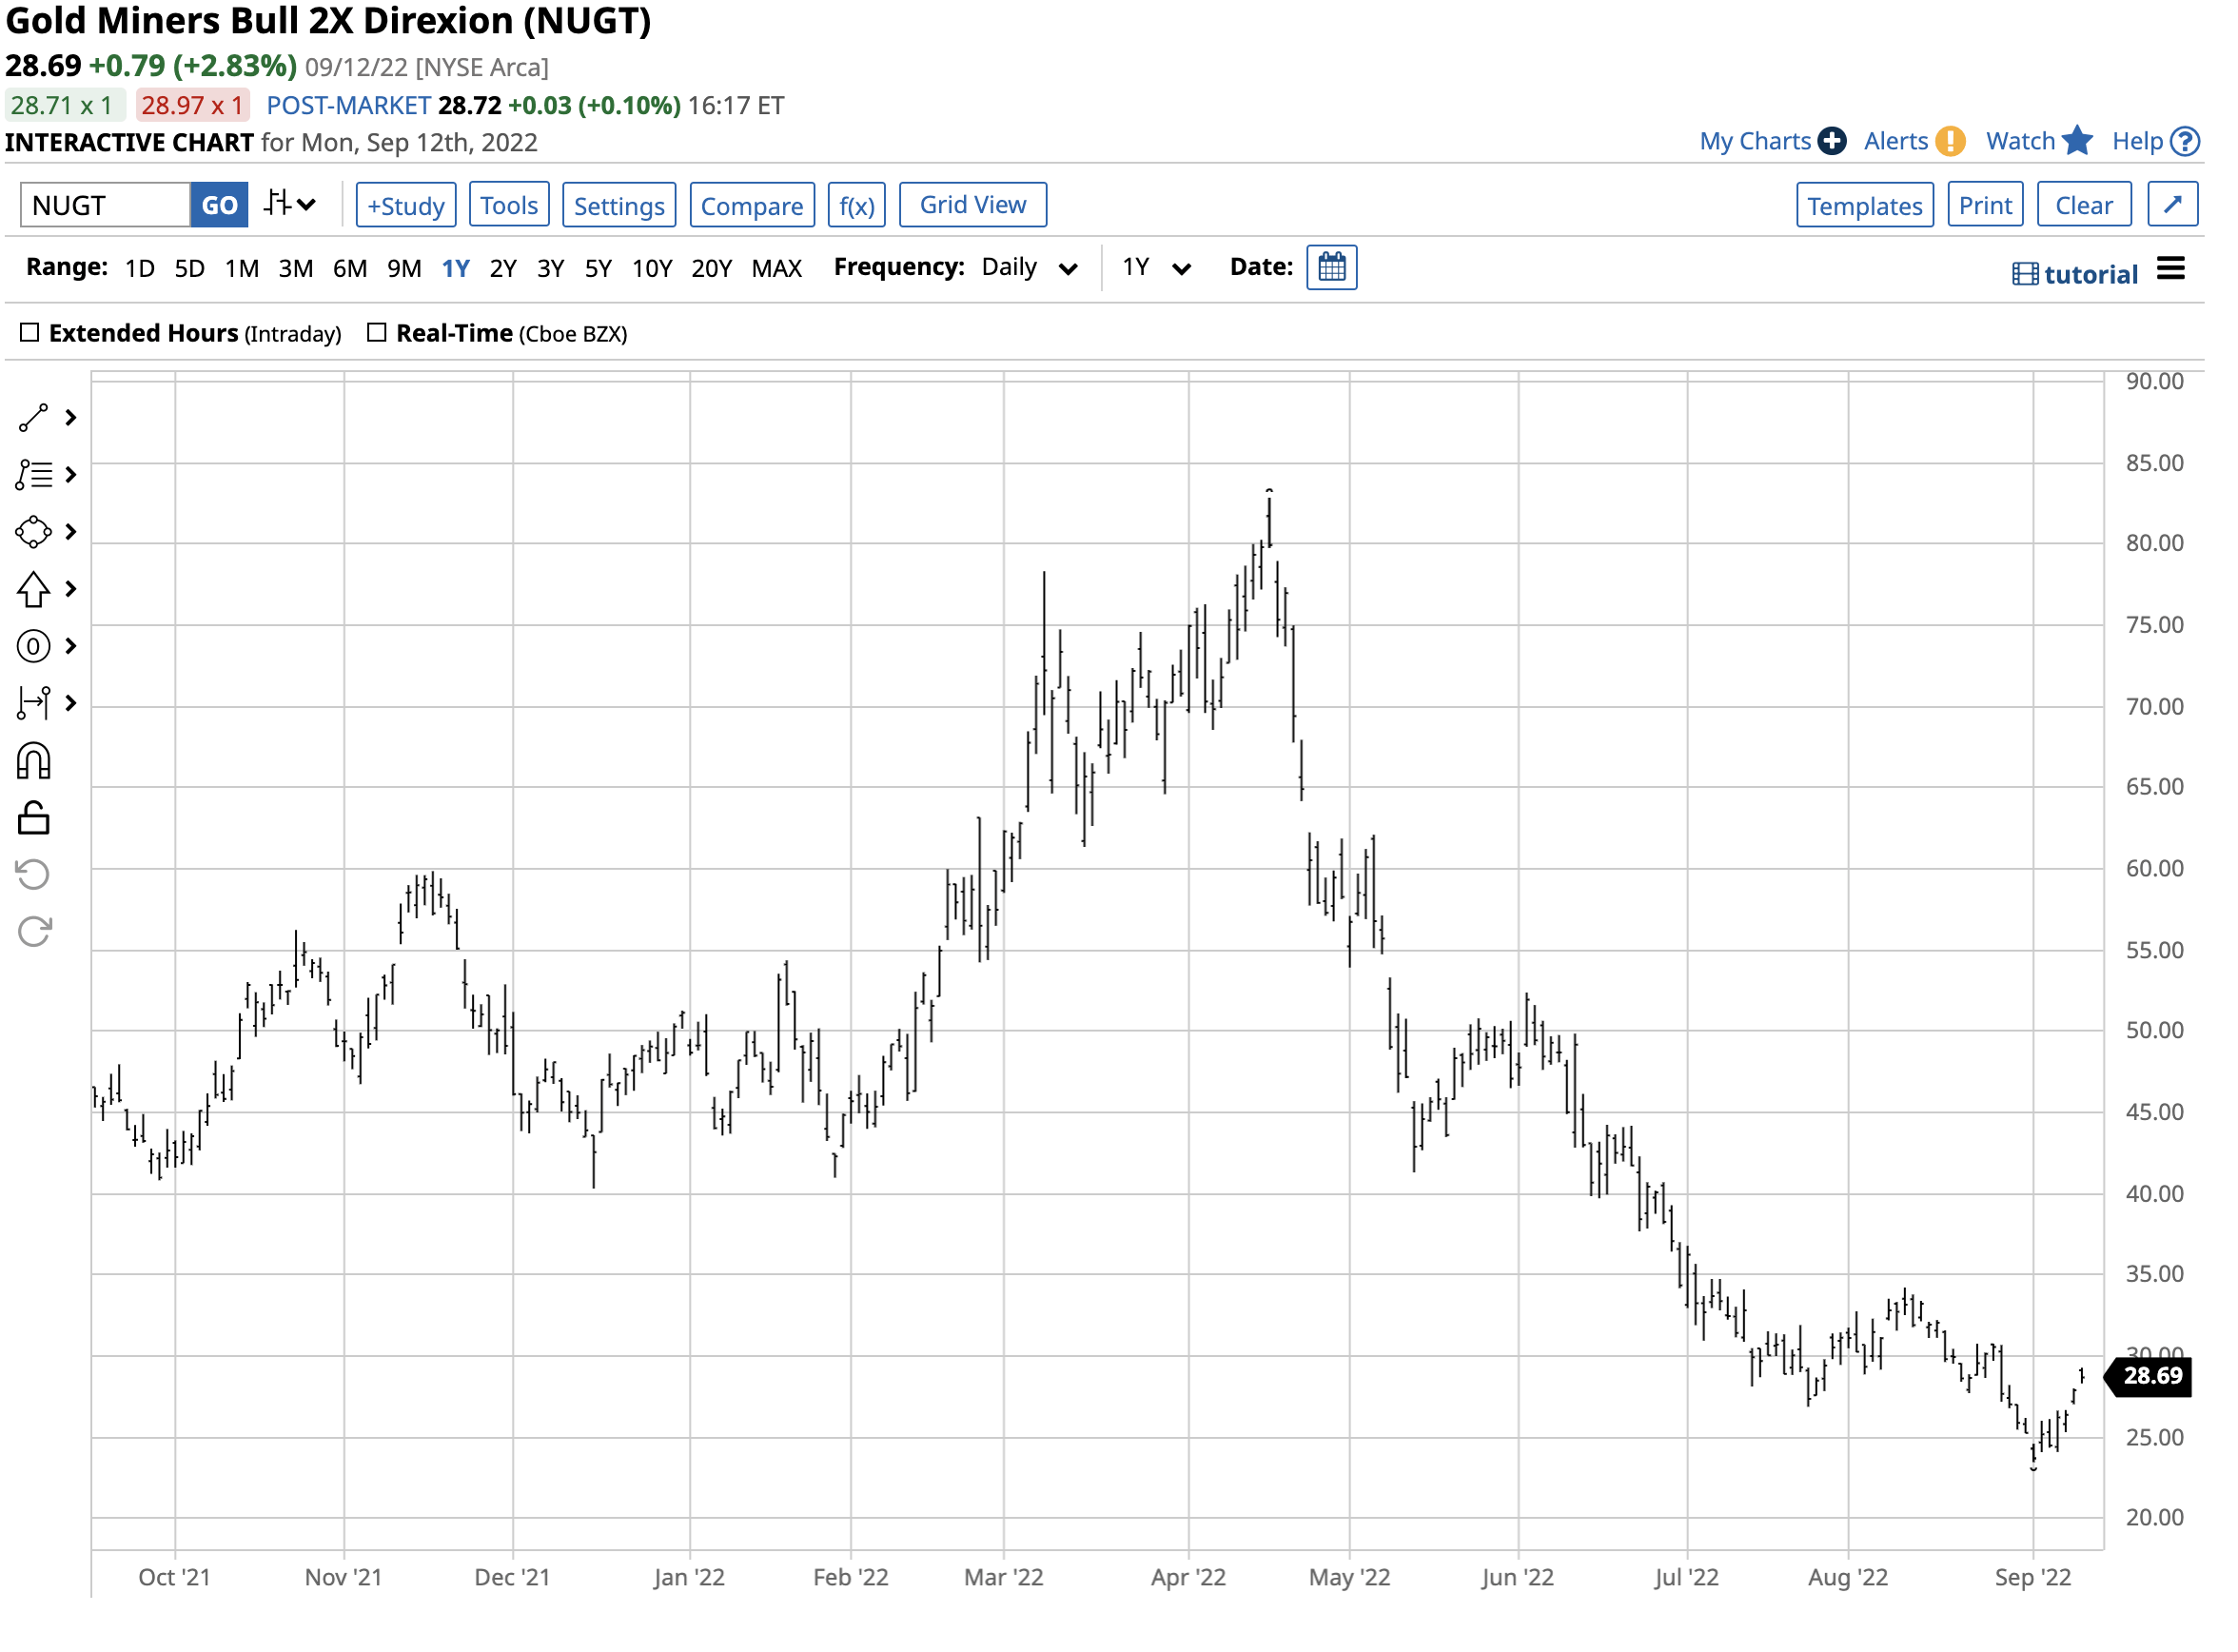
Chart of the NUGT Product (Barchart)
Over around the same period, NUGT moved from $40.83 to $82.86 per share, or over 100% higher. NUGT will underperform gold if the price drops or remains stable. However, if gold is ready to surge, NUGT will likely magnify the move. Gold remains in a short-term bearish trend, but if the precious metal is preparing to make another move higher, NUGT is a product that’s worth considering.
Be the first to comment