


Avi Rozen
Produced with Ryan Wilday and Avi Gilburt
2022 has been a challenging year for crypto investors. The past several months have had all the hallmarks of a bear market given all of the incredibly negative developments throughout the crypto space with several major bankruptcies in exchanges going down. Most recently, and perhaps the largest (to date) was the demise of FTX (FTT-USD).
And while our larger more immediate bullish thesis in Bitcoin (BTC-USD) has certainly reduced in confidence due to the prolonged break below $24k, Ethereum (ETH-USD) has more closely maintained adherence to larger degree expectations laid out this spring. Let’s review:
From April 25th article: Ethereum: A Technical Approach To The Next Year:
“That entails substantial downside left in this correction but those who are prepared with cash would be wise to see this as a good risk-to-reward buying opportunity, provided that those investors are prepared for the noted likelihood of volatility.”
Price was trading around $2,950 at the time of writing, and forecasted a move down to the $1,200-$1,700 region as a buying opportunity.
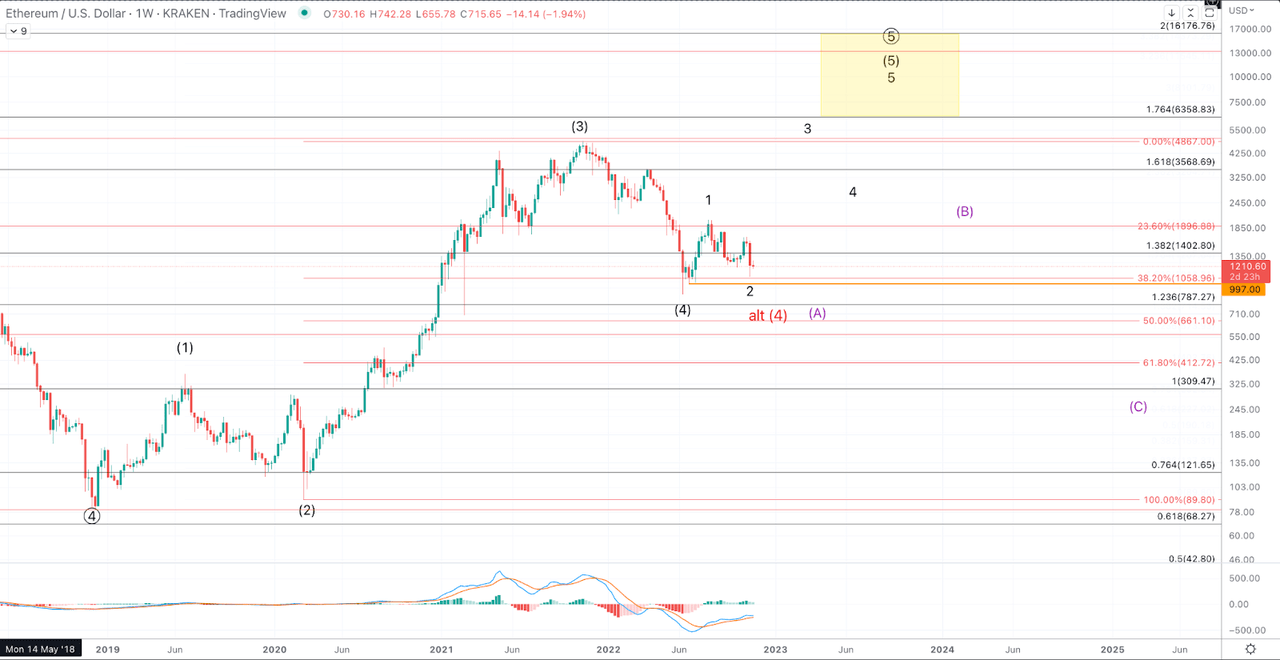
That said, when the article was written, our expectations for this pullback were that it would be a wave 4 within a larger wave (3). Considering the June low saw price break well below $1,200, approximately $880 across exchanges, we have now moved towards considering a higher degree pullback in ETH. That is, this pullback is being considered a wave (4) rather than a 4 of (3).
Where does that put us in a larger context?
When the April article was written, it was noted that price had formed 3 waves up from the 2018 low but that wave (3) had not yet completed. Again, due to the depth of this pullback, the odds have strongly shifted to the all-time highs having completed the wave (3).
All that to say, we still have just 3 waves up from the 2018 low in an otherwise impulsive structure, which thus strongly suggests there’s one more high still to come. So long as price is holding support for a prospective (4), this thesis is intact. Larger degree support for (4) is $787-$1,058, and so far we have a substantial bounce from that region. Additionally, should price print lower lows beneath those struck in June, I could allow for a test of the $660 region, but any meaningful break below that will leave us with a reliable prospect for a higher high in wave (5). In other words, a meaningful or sustained break beneath $660 would likely dash our expectations for the wave (5) higher.
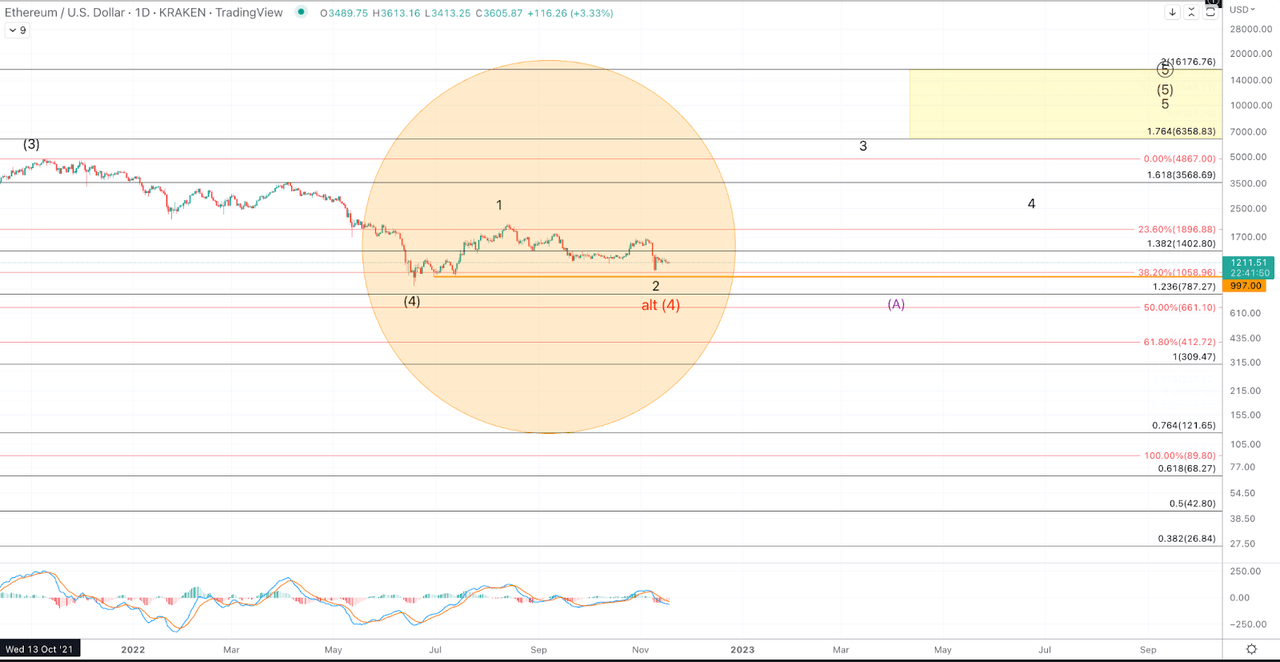
In accord with the larger degree bullish expectations, price formed a micro 5 wave rally from the June lows, providing the first potential indication of a low having been struck for wave (4). The subsequent retrace has become quite deep, and as of writing this article, it is reasonably threatening a retest of the June lows. At the smaller degree, so long as price remains over $995-$1k, expectations are for upside follow through. Should price break $995 resoundingly, it’s quite likely that the June low will be tested and likely broken.
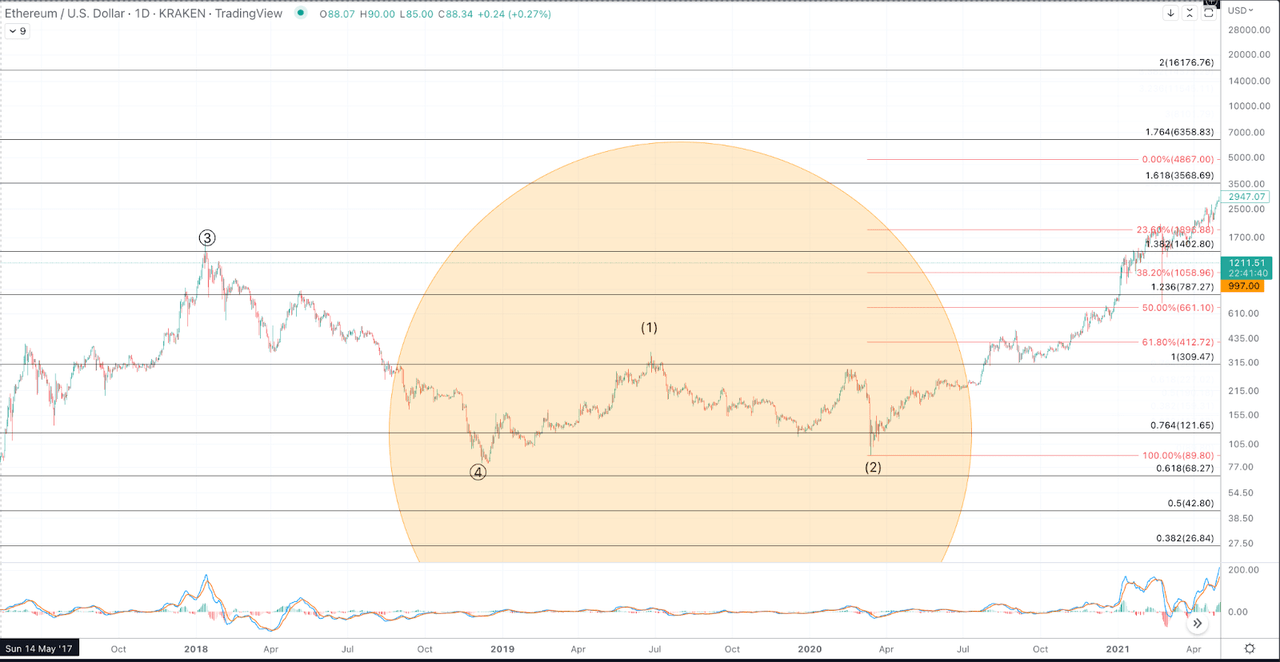
Please note the fractal similarity (See charts below, in particular the circled sections), albeit at different scales to the move off the December 2018 low into the June 2019 high and subsequent retrace. Both the rallies and declines show very similar wave structure as well as the depth of the wave (2) / 2. The March 2020 low similarly challenged the thesis as to whether Ethereum would maintain a viable (1)-(2) from the 2018 low.
What’s needed to more confidently establish the bullish thesis?
Price needs an impulsive rally back above the late October high for starters. Five waves up, first exceeding $1,680, and then $2,030 (the August 2022 high) would be a very positive development towards bulls emphatically taking control.
The next step would be for the price pattern to maintain micro supports along the way and breakout above $3k. Currently, if we have a low in place for wave 2, the 1.0-1.236 extension comes in at $2,465-$3,005. If ETH is going to prove it’s headed to new highs, this region obviously will need to be retaken. That said, even in a very bullish scenario, it’s likely that this region would reject price upon the first test from below. Once price takes out the August high, the relevant support will be roughly $1,750-$1,800. It’s necessary for that region to contain any declines from above $2,030 to maintain a confident bullish perspective.
Given the depth of this pullback into the 2022 low, our upside expectations have somewhat dampened. The minimum upside target – assuming conditions are met for holding wave (4) support – is $6,350. That said, cryptos have a tendency (generally) to extend in their wave 5s and so I can not rule out a trip up to $16k.
Lastly, considering the bounce from the November lows is rather anemic thus far, we would be remiss to not be on the lookout for prospective lower lows.
In the coming days, if price takes out $1k and heads to $660, even if that region holds, our confidence in price recovering to new all-time highs will be somewhat shaken. A bounce is expected from that region but at this time, I can not rule out the possibility that such a bounce, from $600-$660 is just a corrective (B) before a much more significant downside develops as shown in purple.
ETH-USD Weekly 2018-Present
Jason Appel (Crypto Waves)
ETH-USD 2018-2019 (1)-(2) Fractal
Jason Appel (Crypto Waves)
ETH-USD June 2022-November 2022 1-2 Fractal
Jason Appel (Crypto Waves)
Be the first to comment