

Dikuch
I believe Nordic American Tankers (NYSE:NAT) is worth a speculative buy here, as tanker rates are starting to heat up. NAT’s business model is to target the spot tanker market, so its results are the most volatile. But when tanker rates are on an upswing, it also has the most operating leverage. My analysis indicates tanker rates could be ‘higher for longer’, so speculators could be richly rewarded from NAT.
Tanker Rates Are Starting To Increase
Tanker stocks are starting to warm up as tanker rates inflect upwards. Figure 1 shows the recent performance of several tanker stocks I track. On a 1 month basis, they are up 2 to 18%, versus the S&P 500 which is up 4% on a 1 month basis.
Figure 1 – Return comparison of tanker stocks (Seeking Alpha)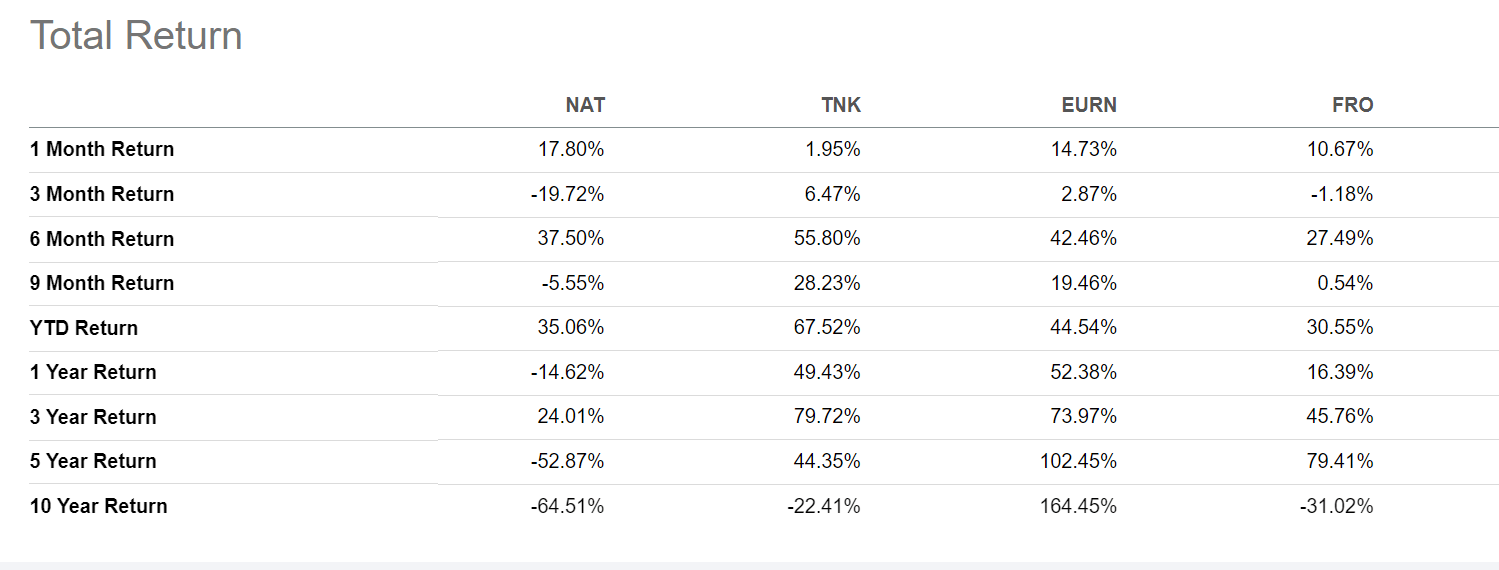
Tanker rates are proprietary and very hard to come by for retail investors, but one company that publishes some market data is Teekay Tankers (TNK). As shown in Figure 2 below, Suezmax tanker spot rates have started to climb in the past few weeks, essentially dovetailing with the actual enactment of western sanctions on Russian crude. Tanker rates for other classes of ships such as Aframax and LR2s have a similar rising pattern.
Figure 2 – Suezmax tanker spot rates (Teekay Tankers market insights)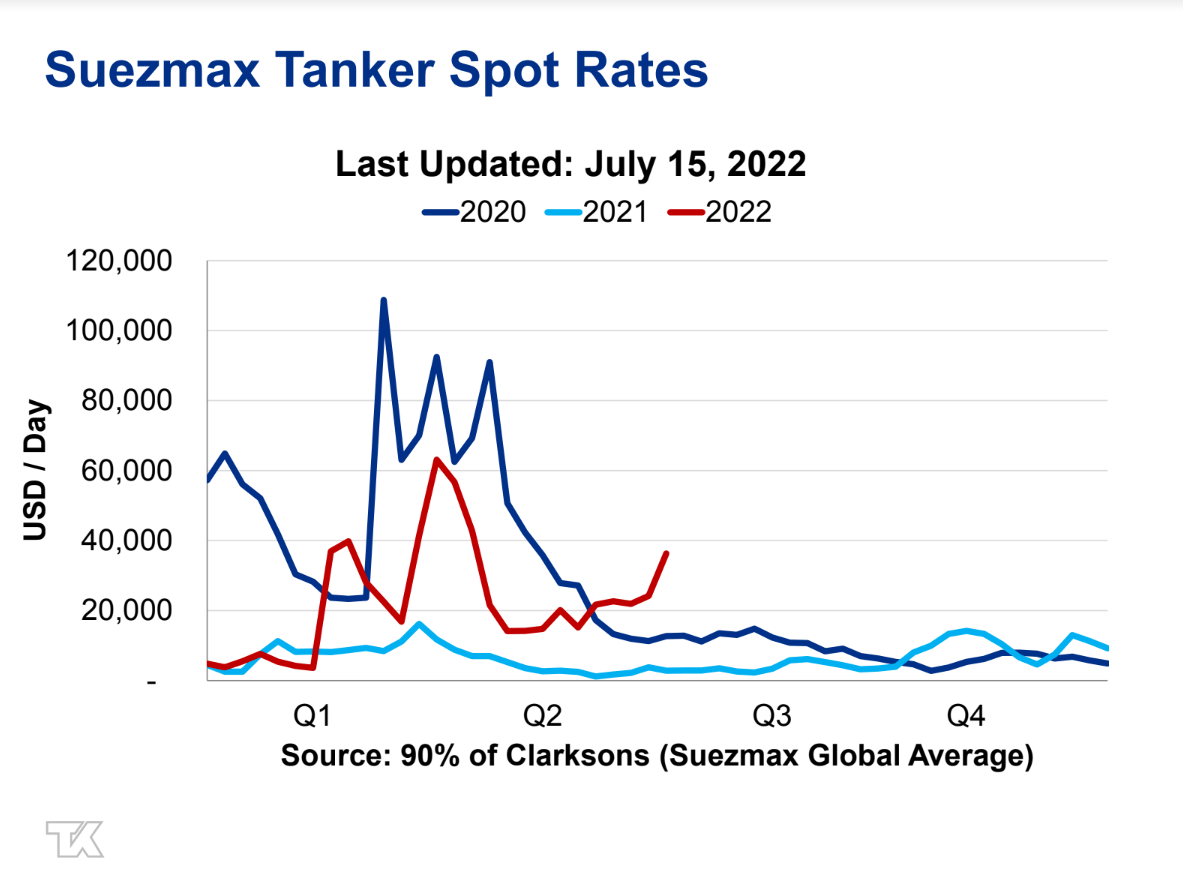
The Bullish Tanker Rate Thesis
While some analysts with a poor understanding of the tanker rate markets have called the Russia/Ukraine war tanker rate rally in March as ‘ephemeral’, I believe it was just early and we are now seeing the full impact.
Recall Russia is the third largest oil exporter and exports over 7 million bbl/d of crude oil and products annually. Historically, Russian products were sent to nearby ports such as the Port of Rotterdam in the Netherlands, which processes 95 to 100 million metric tons of crude oil annually. However, as Russian oil was sanctioned, they had to be re-routed to faraway destinations such as India and China that ignored western sanctions and continued or increased their import of cheap Russian crude. In addition, refineries in Europe had to replace nearby Russian crude with oil from other countries such as the Middle East and Venezuela.
This essentially becomes a capacity utilization problem. Imagine the distance between St. Petersburg, one of Russia’s main oil exporting ports, and Rotterdam. The distance is 1,200 nautical miles or a 5 day voyage. On the other hand, the voyage from between St. Petersburg and Mundra, India (an Indian oil import hub) is 8,600 nautical miles or a 36 day voyage. Similarly, a voyage from Venezuela to Rotterdam is close to 6,000 nm and 25 days. So an original 10 day round-trip voyage between St. Petersburg and Rotterdam is now replaced with a 50 day round-trip between Venezuela and Rotterdam, and a 72 day round-trip between St. Petersburg and India. As tankers become committed to these much longer voyages, it is no surprise that the tanker rate market is rapidly tightening.
China Lockdown Was A Hiccup
What the analysts and the tanker market did not anticipate when rates spiked in March was the large-scale COVID outbreak in China in the last few months that curtailed Chinese oil demand and thus tanker demand. This artificially kept tanker rates low after the initial spike higher following the Russian invasion of Ukraine.
As China’s COVID outbreak comes under control and major cities such as Shanghai re-opens, we have seen oil demand and tanker demand return, and hence increasing tanker rates.
Tanker Stocks Are Trades, Not Investments
When I invest in tanker stocks, I always consider it as just a trade. The tanker industry is notoriously cyclical and capital intensive, and even the largest and best run company, Frontline Ltd. (FRO), does not generate consistent earnings and returns on capital. Over the past 25 years, Frontline has an average ROE of -9%, with a range of -400% to +120% (Figure 3).
Figure 3 – Frontline ROE (Author created with data from roic.ai)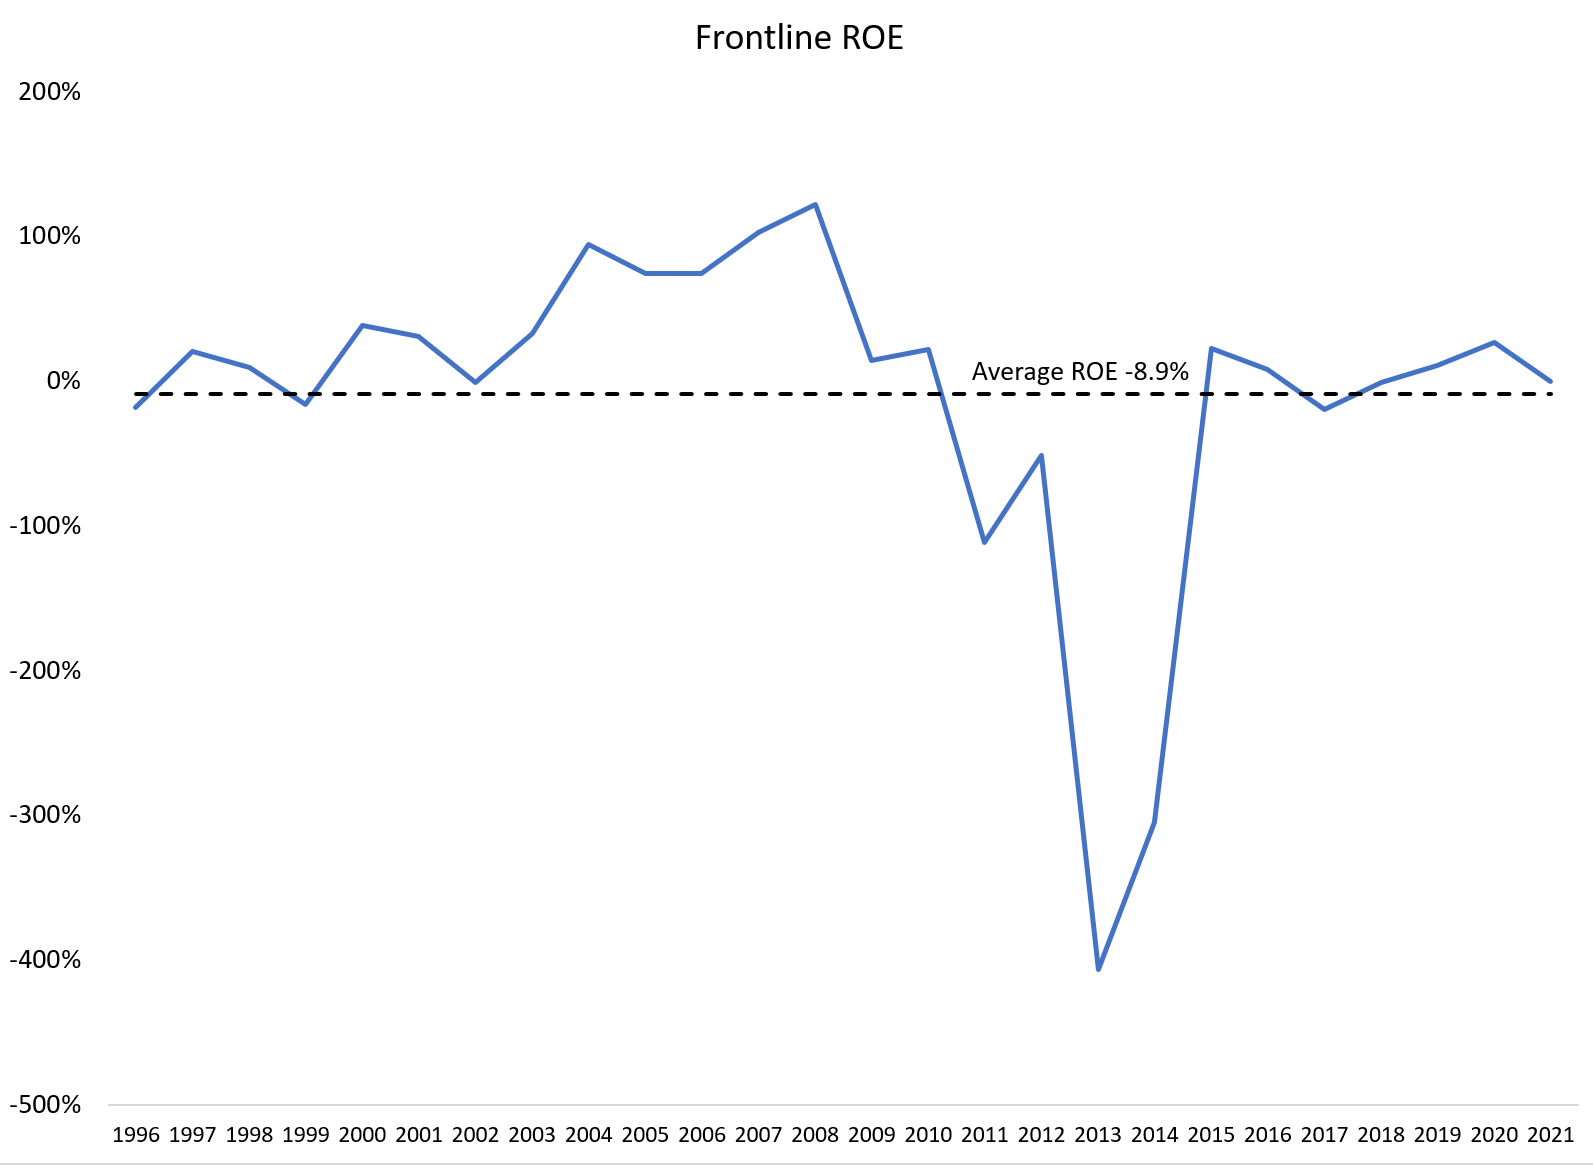
However, when they do work, there is almost nothing quite like the industry, as earnings can pile up quickly when costs are fixed and revenues are squeezed higher. For example, during the early days of the COVID-19 pandemic, the tanker industry benefited from a concurrent oil supply war between Saudi Arabia and Russia and oil demand destruction from stay-at-home restrictions. This caused oil prices to plummet and many tankers were utilized as temporary floating storage. As seen from Figure 2 above, Suezmax rates spiked to over $100,000 a day.
Tanker stocks benefited greatly, with some such as Nordic American Tankers rallying over 100% during the short timespan (Figure 4).
Figure 4 – Tanker stocks benefited greatly during Covid (Seeking Alpha)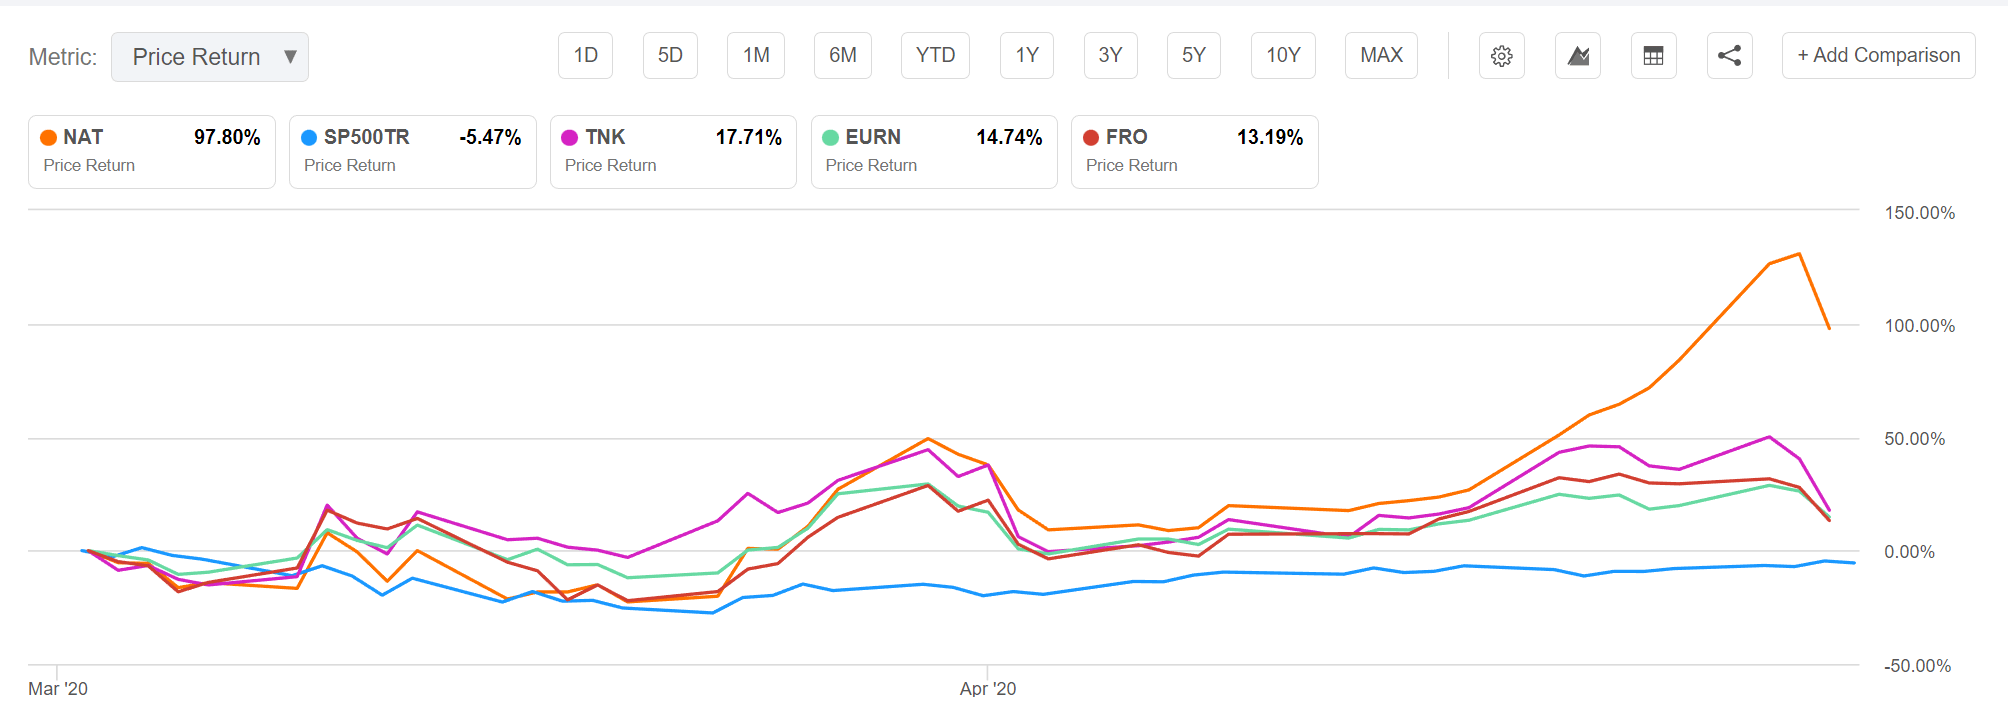
Nordic American Has The Most Torque
One of my go-to vehicles to trade the tanker industry is Nordic American Tankers. NAT’s business model is quite simple. They own a fleet of 20 Suezmax tankers that are mostly interchangeable. Instead of trying to lock in modest tanker rates through long-term charters, NAT instead play mostly in the spot market. NAT tries to keep operating costs low for their vessels, averaging $7,500 to $8,000 per day. So when markets tighten, NAT can make large windfall profits.
For example, when Time Charter Equivalent (“TCE”) rates were modest at $21,700 in 2019, NAT generated $32 million in net operating income and a net loss of $10 million after interest expenses (Figure 5).
Figure 5 – NAT 2019 Operating Summary (Nordic American 2019 20F Report)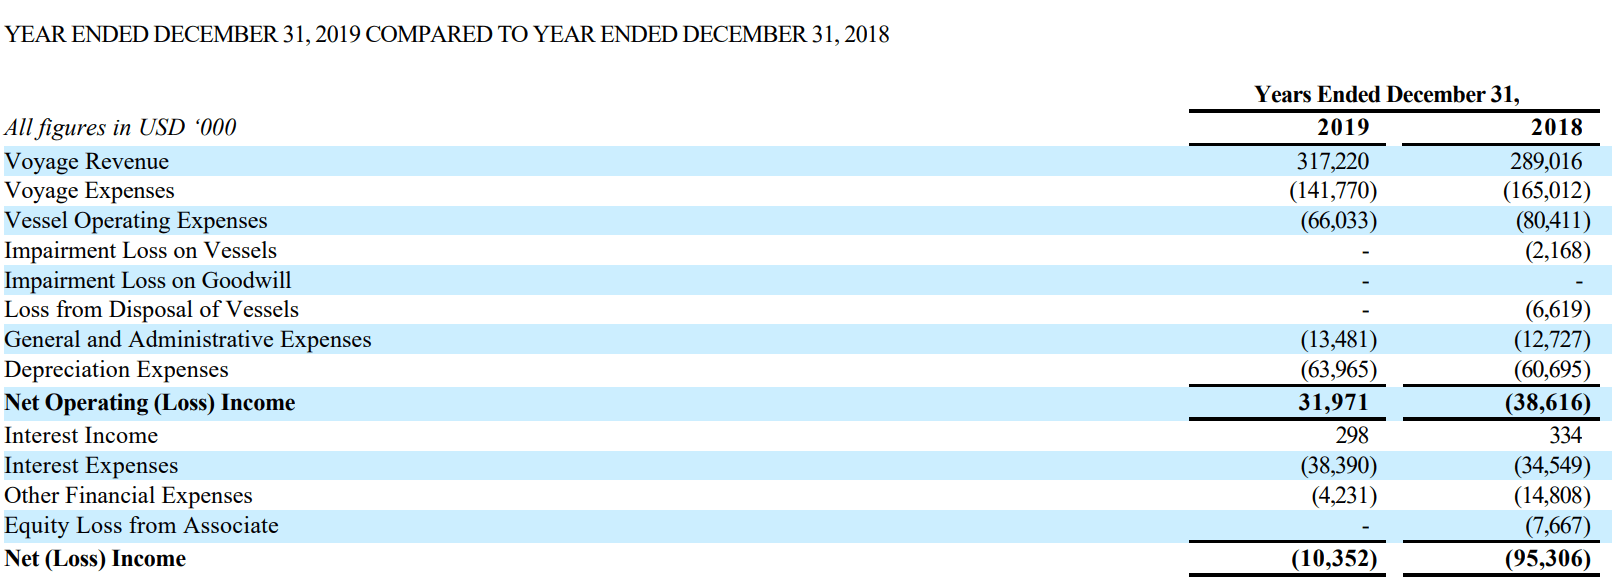
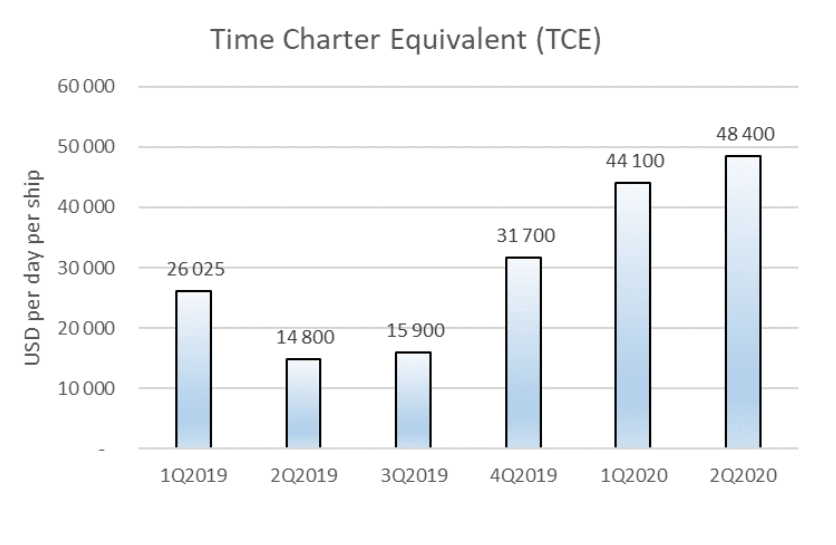
However, in Q1/2020 and Q2/2020, NAT generated a combined $105 million in operating profit as TCE rates achieved $44,100 and $48,400 per day respectively. Figure 6 shows NAT’s Q2/2020 earnings summary, and Figure 7 shows NAT’s TCE progression.
Figure 6 – NAT Q2/2020 quarterly earnings (Nordic American Q2/2020 report) Figure 7 – TCE progression (Nordic American Q2/2020 report)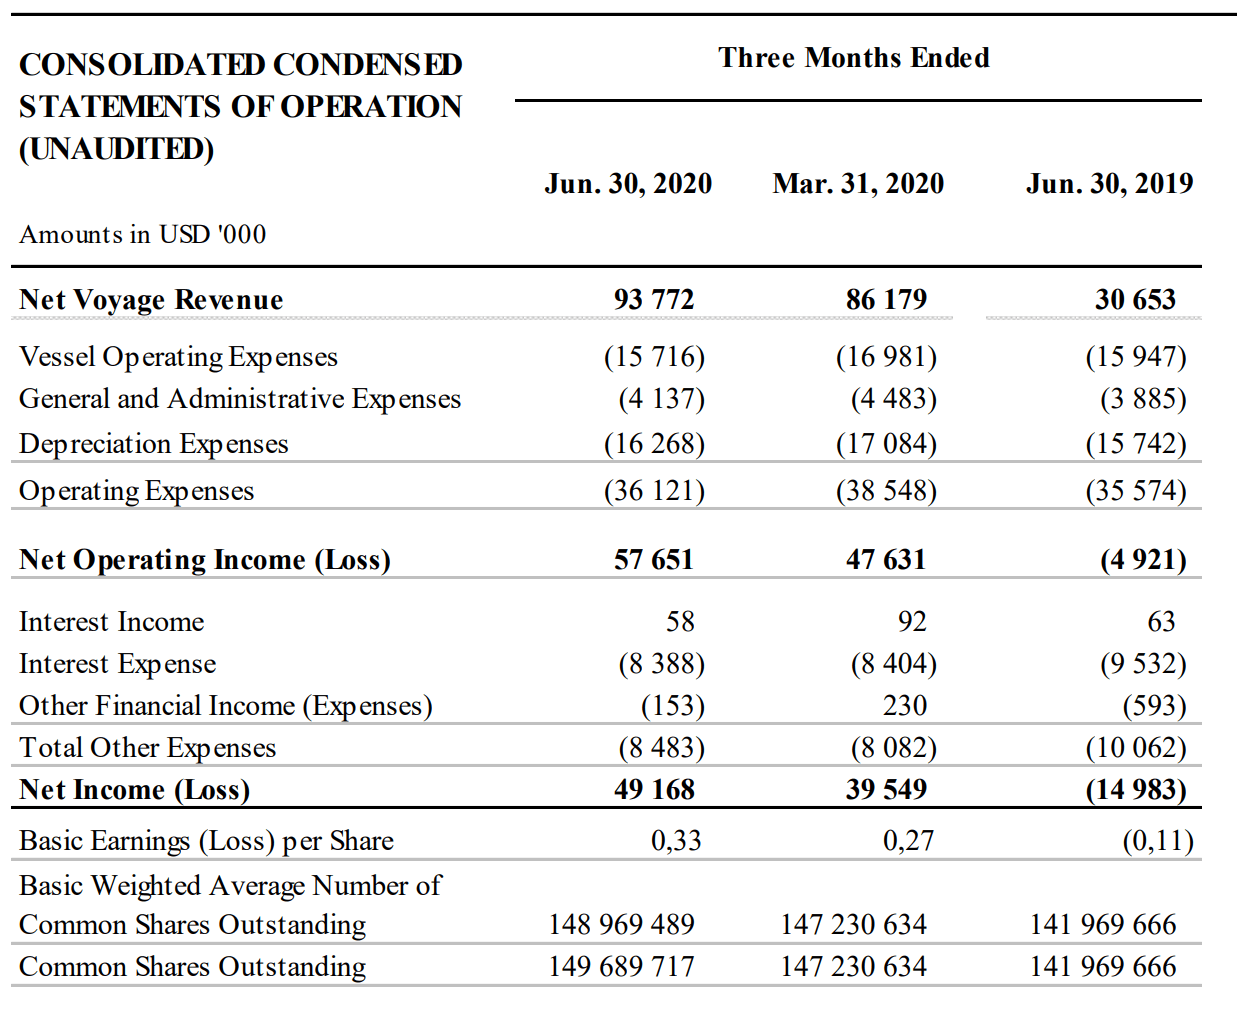
Shareholders were well rewarded, as NAT declared dividends of $0.14 and $0.20 for Q1/2020 and Q2/2020 respectively (Figure 8). This is quite a meaningful dividend as NAT began 2020 trading at only $4.50 a share.
Figure 8 – NAT dividends (Nordic American Q2/2020 report)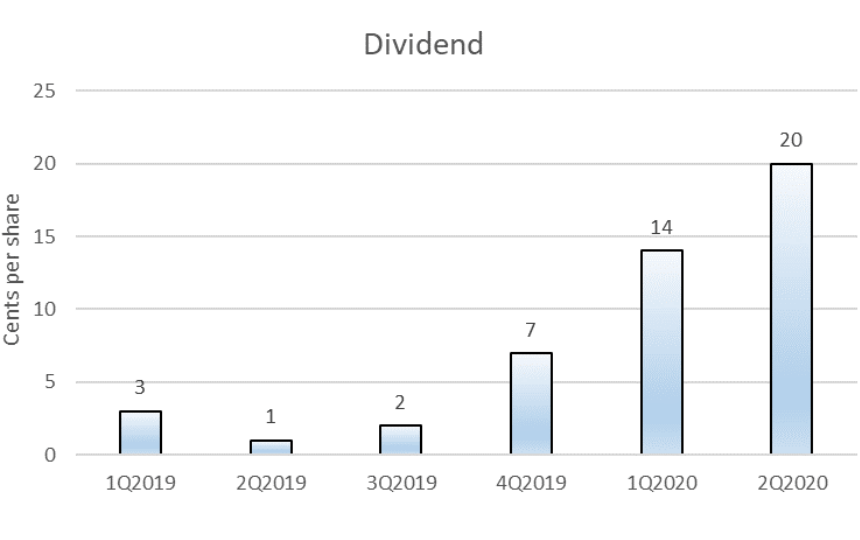
Could Windfall Profits Return?
As tanker rates rally, there are signs that bonanza profits could return to NAT. On July 12, NAT issued a press release detailing some recent charters for their vessels. I have reproduced the press release in Figure 9.
Figure 9 – NAT press release detailing recent contracts (Nordic American Tankers)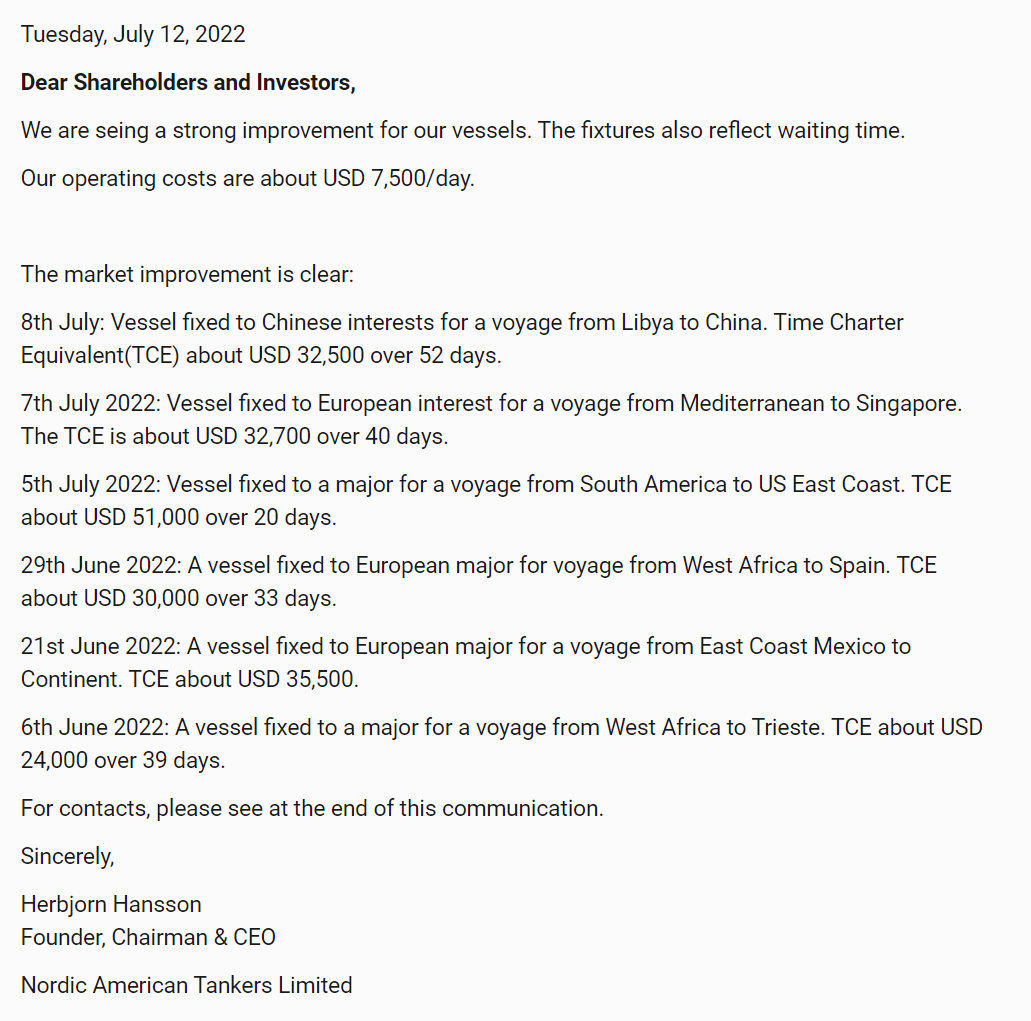
As we can see above, NAT has been able to secure fixtures in the $24,000 to $51,000 range in the past couple of weeks. The improvement in revenues for NAT is undeniable.
Will Strong Tanker Rates Be Long Lasting?
I believe the tightening market will be longer lasting than the blip we saw in 2020. First, the Q1/Q2 2020 supply/demand situation was clearly unsustainable, as oil prices went negative and OPEC+ had to make drastic cuts to oil production to restore some semblance of normalcy. This time, global oil demand continues to recover as travel volumes recover and OPEC+ cannot pump enough oil to satisfy demand.
Also, due to the serious nature of Russia’s invasion of Ukraine, it is unlikely that Russian sanctions will be lifted in the foreseeable future. This means longer voyages will become the norm.
Finally, in past cycles, shipowners have always over-ordered ships when pricing is high, causing a tanker glut that depress pricing. This time around, this dynamic appears to be missing.
According to industry sources and NAT, tanker orderbooks for 2023-24 remains very subdued, with the current orderbook only 7% of the existing fleet.
NAT commented in its Q1/2022 report that:
The world’s Suezmax fleet (excl. shuttle, product & Jones Act tankers) counted 552 vessels as of March 31, 2022, with 28 vessels in order. This is a historically low orderbook. For the rest of 2022 we see 20 conventional Suezmax tankers for delivery, while only 7 for delivery from the shipyards in 2023 and so far only one Suezmax is in the books for 2024.”
– Nordic American, Q1/2022 report
This is because shipyards are fully occupied building vessels for other segments such as LNG tankers, bulk carriers and cargo ships. At the same time, older tankers (those built in the early 2000s to satisfy Chinese demand) are reaching the end of their useful lives and are being scrapped (NAT itself has sold all of their 2002 vintage tankers in the past few quarters). This creates a dynamic where pricing can remain elevated for the next few years.
How Do I Value NAT?
The way I think about NAT’s valuation is very simple. As the company’s CEO emphasizes, NAT’s operating costs breakeven around $7,500 to $8,000 TCE. When TCE reaches $31,500 NAT reaches breakeven on net income (accounting for depreciation, operating expenses, corporate expenses, and interest expenses). Figure 10 shows my simplified NAT model, annualizing Q1/2022 operating expenses, depreciation, and general and admin expenses. This model also assumes NAT’s current fleet of 20 Suezmax ships are operated 95% of the year, for 6,935 operating days and daily voyage expenses are $7,500 per vessel.
Figure 10 – Simplified NAT model (Author created)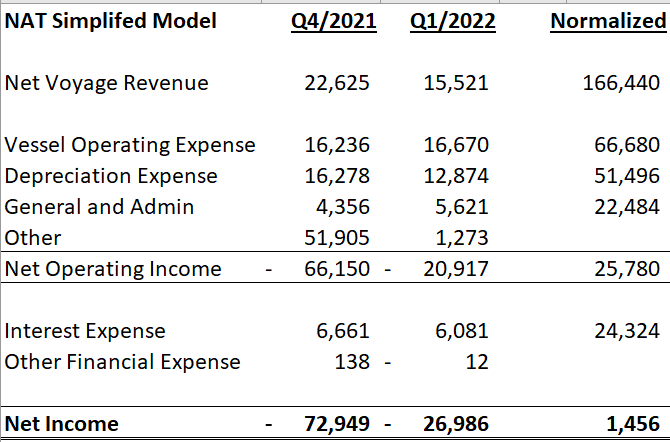
Figure 11 shows a sensitivity table varying the TCE rate and daily voyage expenses. As we can see, net income can inflect very quickly at TCE > $35,000. Assuming NAT can earn TCE of $40,000 for a full year, modestly higher than the latest batch of contracts NAT signed, earnings could come in at $60 million or $0.30 per share. At current price of $2.40, this would translate into 8x P/E, I believe a fair price to pay.
Figure 11 – NAT TCE sensitivity (Author created)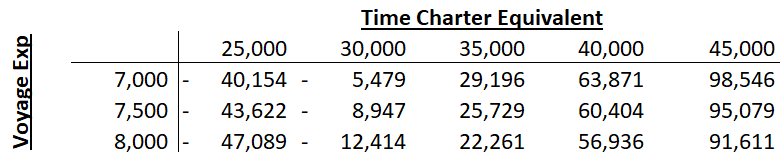
Risks To Owning NAT
Obviously, tanker rates are a large risk to owning Nordic American. However, for the reasons I listed above, I think the current trend of higher tanker rates should last for a few years.
Another risk to NAT is its high debt. NAT has total debt of $302 million as of Q1/2022, or almost $15 million per vessel. High debt can restrict the operating flexibility of the company and / or cause the company to go into financial distress if the debt cannot be refinanced at maturity.
Technical Analysis
Looking at the chart of NAT, I see a large reverse head and shoulders pattern forming, with the declining neckline around $2.60-$2.80. The projection of this pattern could target $4.00 or more.
Figure 12 – Technical outlook for NAT (Author created with price data from stockcharts.com)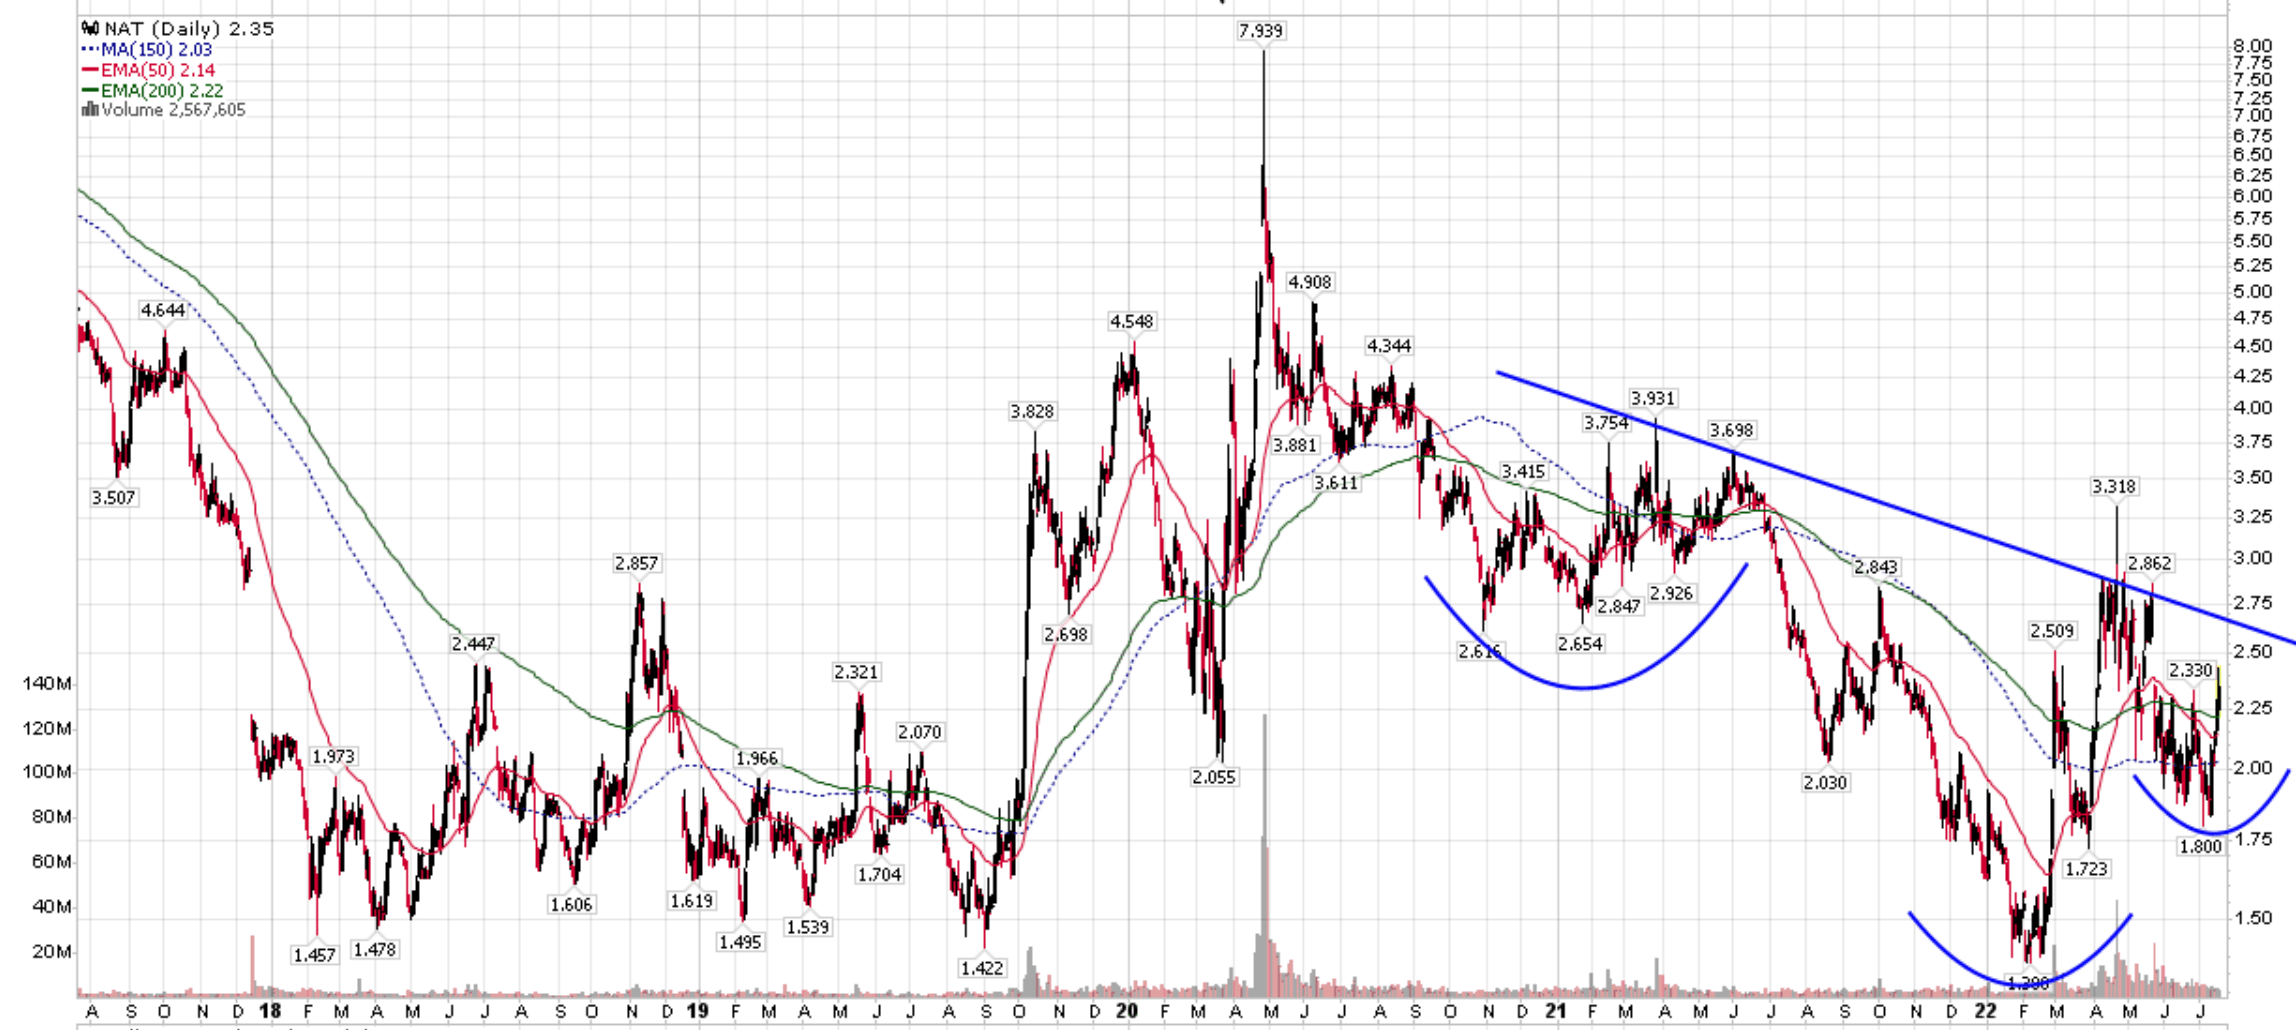
Conclusion
With strengthening tanker rates, I believe NAT is a speculative play that could pay a large reward for speculators willing to take the bet. NAT has the most exposure to spot tanker rates, giving it the most operating leverage.
Be the first to comment