

iantfoto/E+ via Getty Images
NextEra Energy (NYSE:NEE) is somewhat in a class by itself, and recent commodity fuel price inflation and rising interest rates highlight how NEE differs from other utilities. As the world’s largest producer of electricity from solar and wind, NEE is somewhat insulated from inflation. More than 27% of the total generation capacity owned by NEE was either solar or wind in 2020. Even though utilities typically hedge their fuel costs, surging gas prices are expected to lead to substantial increases in costs for utilities and may even impact credit quality.
Rising interest rates, however, are expected to have a disproportionately negative impact on NEE because of the company’s substantial variable rate debt. In addition, because NEE’s valuation relies more on expected earnings growth than slower-growing utilities, rising interest rates will have a larger negative impact on NEE’s valuation than on many other utilities. Higher interest rates correspond to higher discount rates.
With the combination of broad-based inflation and, specifically, the jump in gas prices following Russia’s attack on Ukraine, it is expected that interest in solar- and wind-generated electricity will continue to increase, which should be positive for NEE.
Seeking Alpha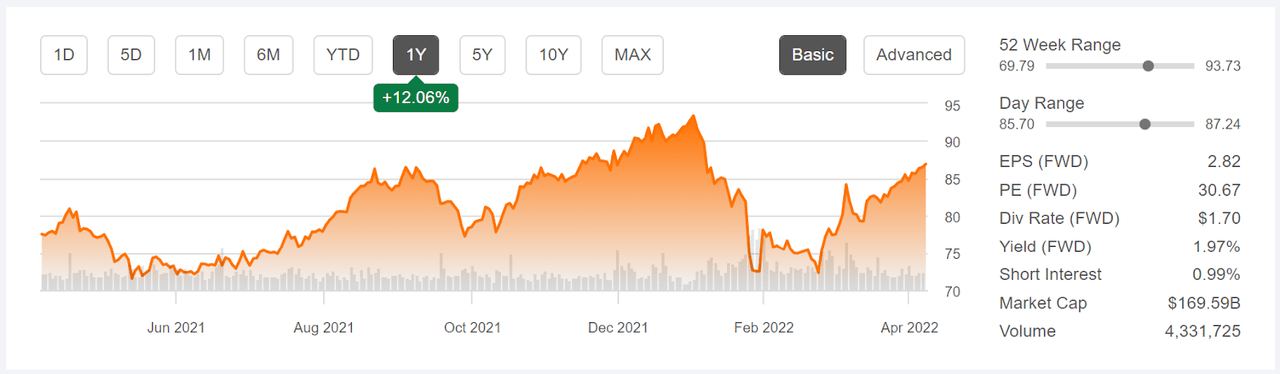
12-Month price history and basic statistics for NEE (Source: Seeking Alpha)
NEE closed at a 12-month high of $93.36 on December 31, 2021 and subsequently fell 22% to a closing price of $72.50 on January 27, 2022. The shares have since recovered, and currently trade at $86.88. Utilities have surged in recent months, and this has boosted NEE. Even with this gain, NEE has a total return of -6.9% for the YTD, as compared to +8.1% for the Utilities Select SPDR ETF (XLU).
NEE has a low dividend yield for a utility,1.97%, largely because of the fairly high valuation. DUK and SO, with P/E ratios slightly above 21, have yields of 3.4% and 3.45%, respectively. With NEE’s 3-, 5-, and 10-year dividend growth rates of 11.3%, 12%, and 10.9%, NEE is a reasonable dividend growth option, however.
I last wrote about NEE on October 2, 2021, at which time I upgraded NEE from neutral / hold to bullish / buy. For that date until today, NEE has returned a total of 11.08%, as compared to 4.2% for the S&P 500. While I was, and continue to be, somewhat uncomfortable with NEE’s high valuation (the P/E was 31 at the time), I was swayed to a bullish view by two forms of consensus outlooks. The first, the Wall Street consensus outlook, was bullish and the consensus 12-month price target equated to 15% total return. The second, the implicit outlook calculated from the prices of options (referred to as the market-implied outlook) on NEE, was bullish to early 2022.
Seeking Alpha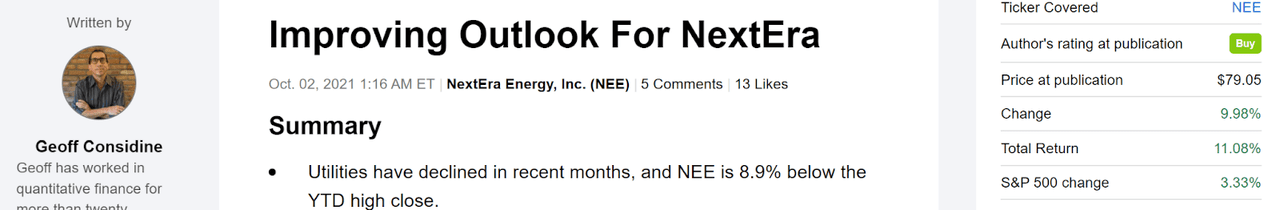
Performance of NEE since my last analysis, on October 2, 2021 (Source: Seeking Alpha)
For readers who are unfamiliar with the market-implied outlook, a brief explanation is needed. The price of an option on a stock reflects the market’s consensus estimate of the probability that the stock price will rise above (call option) or fall below (put option) a specific level (the option strike price) between now and when the option expires. By analyzing the prices of call and put options at a range of strike prices, all with the same expiration date, it is possible to calculate a probabilistic price forecast that reconciles the options prices. This is the market-implied outlook and represents the consensus of buyers and sellers of options. For readers seeking a deeper explanation than is provided here and in my basic overview, I recommend this excellent free monograph from the CFA Institute.
With more than 6 months since my last analysis, I have calculated an updated market-implied outlook for NEE to early 2023 and I have compared this with the current Wall Street consensus outlook, as in my previous post.
Wall Street Consensus Outlook for NEE
ETrade calculates the Wall Street consensus for NEE by aggregating ratings and price targets from 11 ranked analysts who have published opinions over the past 90 days. The consensus rating is bullish and the consensus 12-month price target is 7.3% above the current price. The 12-month price target, $93.17, is almost equal to NEE’s 12-month high closing price at the end of 2021.
ETrade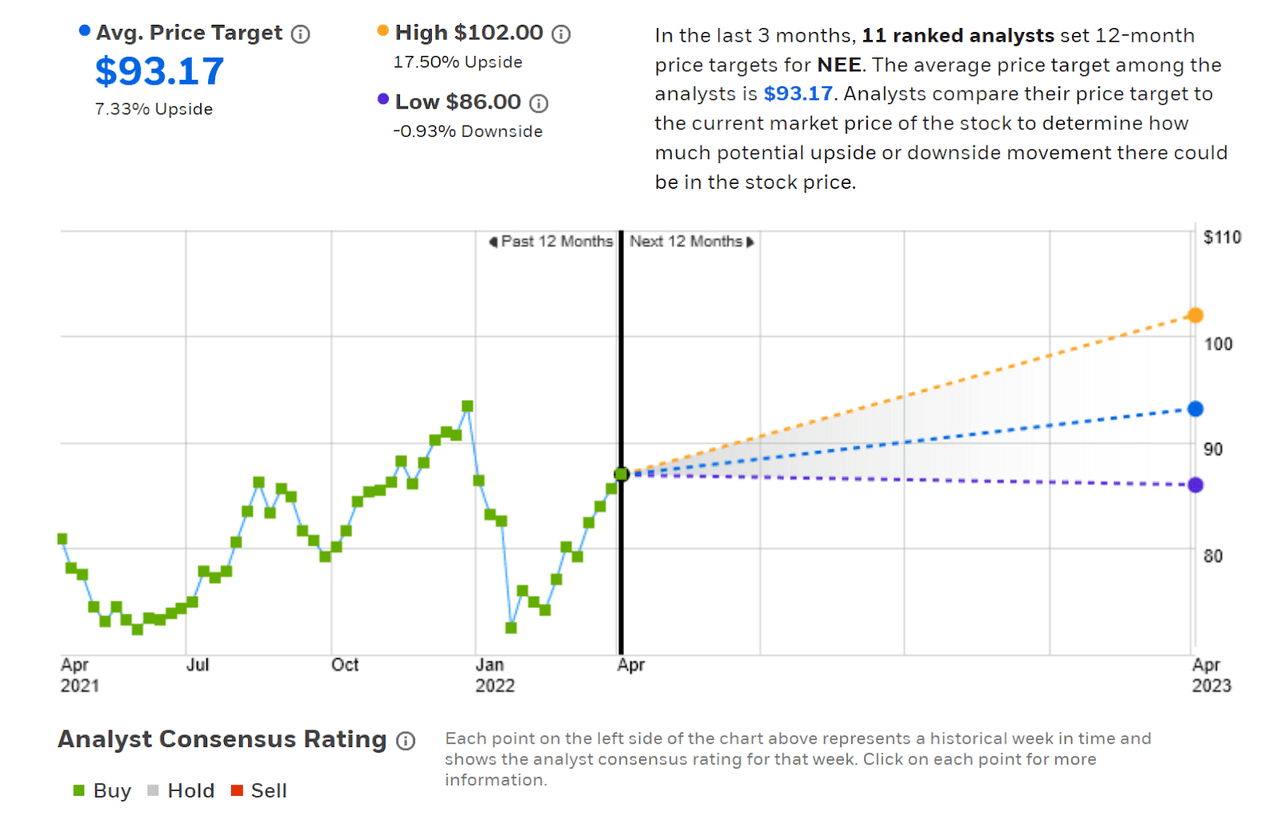
Wall Street consensus rating and 12-month price target for NEE (Source: ETrade)
Seeking Alpha calculates the Wall Street consensus using the views of 20 analysts who have published ratings and price targets over the past 90 days. The consensus rating is bullish and the consensus price target is 5.36% above the current share price.
Seeking Alpha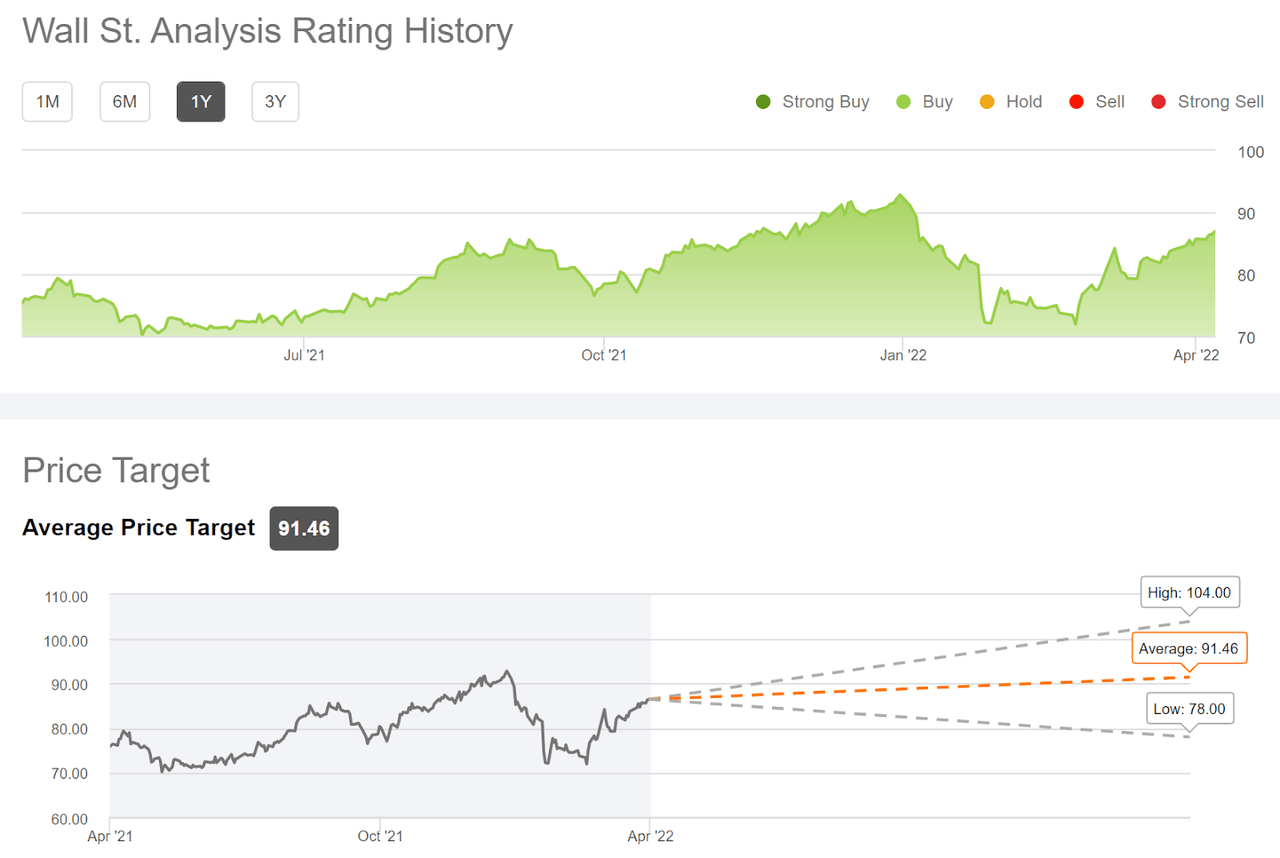
Wall Street consensus rating and 12-month price target for NEE (Source: Seeking Alpha)
While consensus outlooks often vary between sources, these two variations agree closely. Both are bullish and the average expected 12-month price appreciation is 6.35% above the current share price, for expected total return of 8.3%. This level of return is well below NEE’s long-term averages.
Market-Implied Outlook for NEE
I have calculated the market-implied outlook for NEE for the 9.4-month period from now until January 20, 2023, using the prices of options that expire on this date. I selected this specific expiration date to provide a view through the end of 2022 and because options expiring in January tend to be among the most liquid.
The standard presentation of the market-implied outlook is in the form of a probability distribution of price return, with probability on the vertical axis and return on the horizontal.
Geoff Considine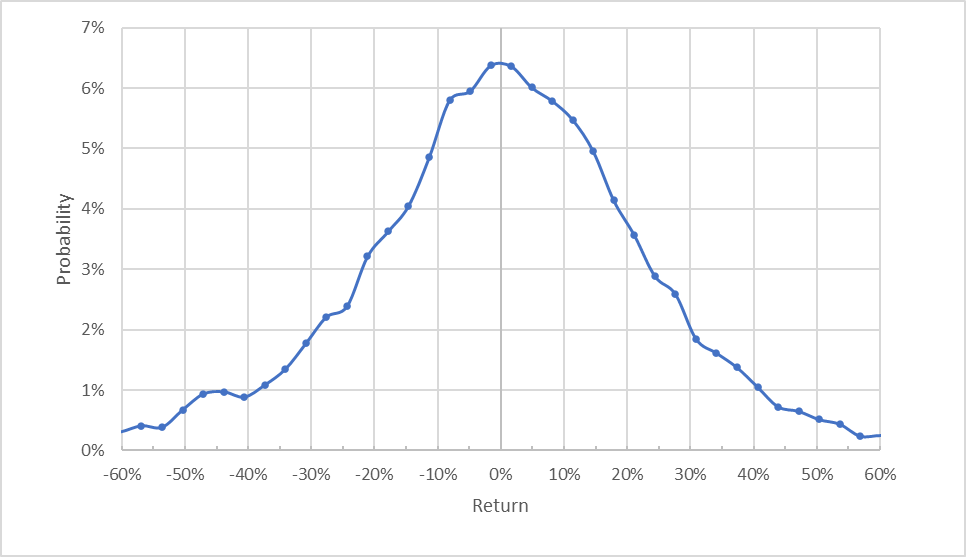
Market-implied price return probabilities for NEE for the 9.4-month period from now until January 20, 2023 (Source: Author’s calculations using options quotes from ETrade)
The market-implied outlook to January 20, 2023 is generally symmetric and the peak in probabilities is close to zero. The expected volatility calculated from this distribution is 27.7% (annualized). This is quite high for a large electric utility.
To make it easier to directly compare the probabilities of positive and negative returns, I rotate the negative return side of the distribution about the vertical axis (see chart below).
Geoff Considine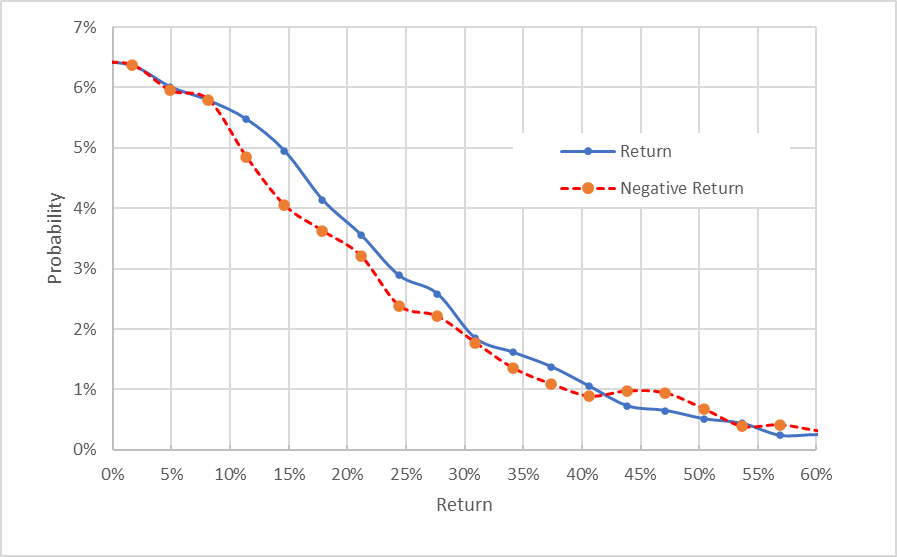
Market-implied price return probabilities for NEE for the 9.4-month period from now until January 20, 2023. The negative return side of the distribution has been rotated about the vertical axis (Source: Author’s calculations using options quotes from ETrade)
This view shows that the probabilities of positive returns tend to be slightly above the probabilities of negative returns of the same magnitude, across a wide range of the most probable outcomes (the solid blue line is mainly above the dashed red line over the left ⅔ of the chart above). This is a modestly bullish outlook.
Theory indicates that the market-implied outlook is expected to have a negative bias because risk-averse investors are willing to pay more than fair value for downside protection (put options). While there is no way to test whether this bias is present, the potential for this bias reinforces the bullish interpretation.
A covered call position in NEE is worth considering for income investors and for those who are somewhat uncomfortable with NEE’s fairly high valuation. As I have been writing this analysis, I bought shares of NEE for $86.86 and sold call options expiring on January 20, 2023, with a strike price of $87.75, for $7.60. The net position provides 8.7% ($7.60/$86.86) in option premium income, in addition to 1.46% in dividends between now and when the option expires, for a total income of 10.16% over the 9.4-month period.
Summary
NEE has long sold for a substantial premium relative to earnings, thanks to the company’s leading position in developing renewable energy and related assets (such as battery storage). As inflation surges, electrical utilities that have less exposure to commodity fuel prices look attractive. On the other hand, NEE is likely to be more sensitive to rising interest rates than many other major utilities. The Wall Street consensus outlook for NEE continues to be bullish, but the expected 12-month total return, 8.3%, is quite low.
As a rule of thumb for a buy rating, I want to see an expected 12-month total return that is at least ½ the expected annualized volatility (27.7%). NEE does not meet this criterion. The market-implied outlook for NEE to early 2023 is modestly bullish. I am maintaining my bullish rating on NEE, but I see lower-than-normal upside potential for the shares. Consistent with this view, I have bought shares and sold call options, as described in the previous section.
Be the first to comment