

zhongguo/E+ via Getty Images
Overview
NextEra Energy, Inc. (NYSE:NEE) is a leading developer, constructor, and operator of electric power generation assets that has a presence in 38 US states and 4 Canadian provinces. With $145 billion in assets and 61 GW of generation capacity, it provides nearly 5% of the total U.S. generation capacity of 1,200 GW and is one of the largest electric and energy infrastructure companies in North America.
Over the last 30 years, it has transformed itself from a fossil fuel power generator into a leading clean energy power generator, with more than 95% of its electricity generated from natural gas, wind, and solar power (figure 1).
Figure 1: NextEra Energy generation by fuel type
NextEra Energy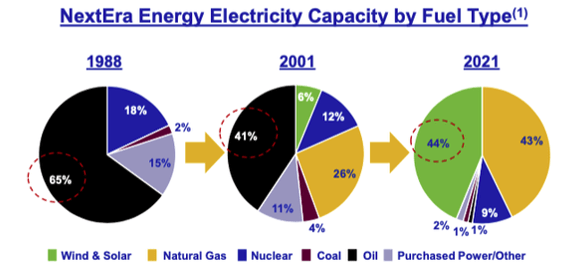
NextEra Energy is the world’s top generator of wind and solar energy, both of which have has gained consideration attention as governments and corporations around the world seek to reduce greenhouse gases to combat climate change. In 2021, NextEra Energy generated 50% more electricity from wind and solar than its next closest competitor (figure 2).
Figure 2: NextEra Energy is the world’s largest wind and solar energy generator
NextEra Energy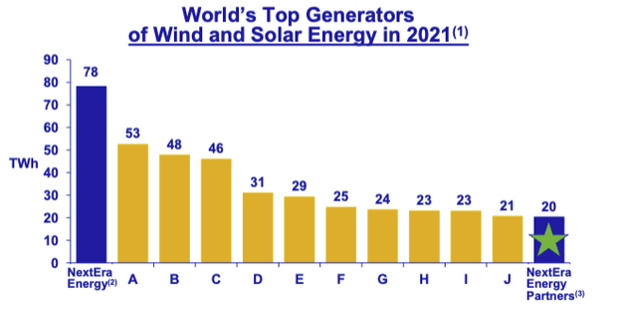
The company is organized into two segments–FPL (Florida Power and Light) and NextEra Energy Resources (NEER).
Even though both segments are in the business of generating electricity and draw upon NextEra Energy’s competencies, intellectual knowhow, and supplier relationships, they operate under very different revenue models. In addition, NextEra Energy serves as the general partner and is the largest shareholder with a 55% beneficial ownership of its affiliate NextEra Energy Partners, LP (NYSE:NEP), a publicly-listed limited partnership designed to provide steady distributions to shareholders.
Florida Power And Light
With assets of $79 billion and generation capacity of 31 GW, FPL is the largest regulated electric utility in Florida and one of the largest U.S. utilities as measured by retail MWh sales and number of customers.
As electricity generation is a natural monopoly that benefits greatly from scale, governments typically heavily regulate utilities to prevent their owners and management from taking advantage of their monopolistic power. NextEra’s FPL business is tightly regulated by a number of federal, state, and other organizations, including the Florida Public Service Commission (FPSC), US Federal Energy Regulatory Commission (FERC), North American Electric Reliability Corporation (NERC), Nuclear Regulatory Commission (NRC), and the Environmental Protection Agency (EPA).
The FPSC is the government body that regulates the profitability of public utilities in Florida to ensure customers are charged reasonable tariffs for electricity. It does so by setting the rates of electricity at a level that is intended to allow the utility the opportunity to collect from retail customers total revenues equal to its cost of providing service plus a reasonable rate of return on its invested capital. This is done by through the determination of a rate base, which according to S&P Global Market intelligence:
[it] is essentially the company’s “prudent” capital investment, as determined by the applicable regulatory authorities, net of accumulated depreciation. Stated differently, it is the net asset base from which the utility provides electric, gas or water service, and upon which the utility is allowed to earn a rate of return, usually the company’s weighted average cost of capital. Thus, the rate base value is a key variable in the determination of a utility’s revenue requirement.
Regulators like the FPSC are tasked with scrutinizing and approving utilities’ capital spending to achieve a balance between adequate spending to ensure the public receives reliable service while preventing unnecessary over-spending (e.g., over-engineering facilities or “gold platting” equipment) to drive up their rate bases.
As of 2021, FPL’s regulatory capital employed and rate base stand at $49.3 billion and $41.4 billion respectively, and its current authorized regulatory return on equity (ROE) on the rate base equity is 10.60%, subject to lower and upper limits of 9.70% and 11.70% respectively. FPL’s authorized earnings is 10.60% x the rate base (subject to some adjustments), which is the basis upon which the retail electricity tariff rate for customer are determined. However, if the earned regulatory ROE falls below 9.70% or rises above 11.70%, FPL or the FPSC can seek a review of the retail electricity rate. There is a provision for the ROE to rise by a relatively modest 20 basis points if the US treasury rate rises above 2.49% for a consecutive six-month period, which has already occurred since the Federal Reserve began its rate hikes (figure 3).
Figure 3: 30-year treasury rates
CNBC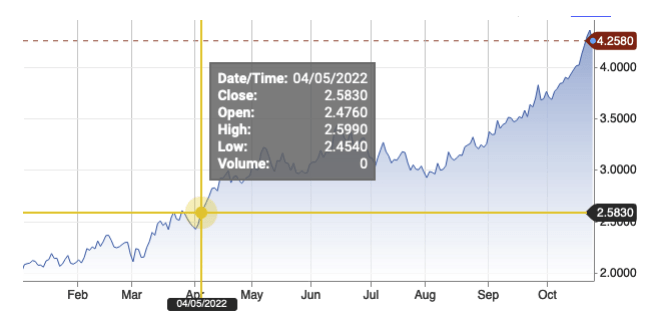
To create shareholder value for shareholders, regulated public utilities like FPL need to grow earnings by increasing their rate base while ensuring reliable service to customers, and manage costs to keep their return on equity within the regulatory range. FPL does not benefit directly from short term growth in demand for electricity as the higher profits for the year would be offset by an adjustment in tariffs the next year. However, long term growth in demand, which could be driven by population or economic growth, will necessitate the development of new generation facilities, which increases the rate base of the utility. Capital spending needed to ensure sufficient generation capacity, or that results in demonstrably lower costs, increased reliability, or cleaner energy for customers, are typically approved by regulators and added to the rate base.
FPL is a leader of clean generation among US utilities–it retired its last coal unit in 2020, generates 81% of its power from natural gas, nuclear, and solar sources, and plans to grow its solar generation from 4% today to 19% in 2031 (figure 4). The company has set a goal of zero carbon emissions by 2045 with the conversion of all its natural gas turbines into hydrogen generation facilities powered by green hydrogen hydrolyzed from renewable power sources.
Figure 4: FPL’s generation sources–2005, 2021 and 2045 (estimate)
NextEra Energy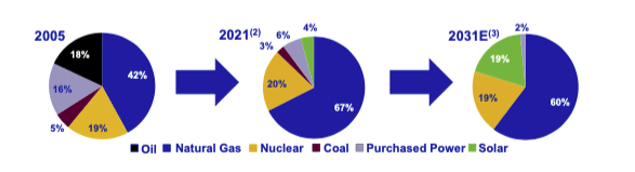
NextEra Energy Resources
NEER owns, develops, constructs, manages, and operates electric generation and transmission facilities, primarily in the competitive wholesale energy generation and the rate-regulated transmission businesses. With approximately 24,600 MW of total net generating capacity as of December 31, 2021, NEER is one of the largest wholesale generators of electric power in the U.S., producing approximately 24,070 MW of net generating capacity across 38 states and 520 MW of net generating capacity in 4 Canadian provinces. In 2021, over 95% of its energy generated comes from clean sources and over 80% from wind and solar energy (figure 5). NextEra Energy Transmission, NEER’s transmission subsidiary, which owns and operates approximately 265 substations and 2,680 circuit miles of transmission lines, is a strategic asset for the distribution of NEER’s solar and wind-generated power.
Figure 5: NEER power sources (2021)
NextEra Energy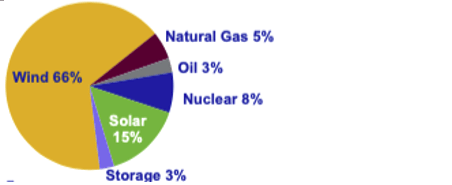
In contrast to FPL’s rate regulated utility business in which electricity rates are set by regulators, NEER competes on the basis of price in a reverse auction system run by the regional ISO (Independent Service Operator)–an entity regulated by the FERC that coordinates, controls, and monitors the electric power system. The ISO estimates the amount of power needed every hour of the year and invites producers to name the price they require to supply the electricity needed for that hour. Upon receiving the offers, the ISO sorts the offers in ascending order (figure 6). The cheapest producers will “clear” the market until the supply matches demand, at which point the marginal price named by the last resource to “clear” the market (plus other market operation charges) becomes the wholesale price of power (i.e., the green line).
Figure 6: Illustration of the reverse action process
Environmental Leader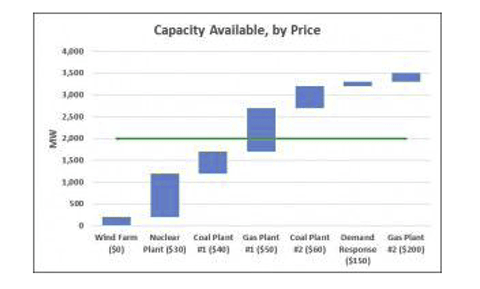
Renewables are typically the low-cost producers, followed by nuclear, then new combined cycle producers. Combustion turbines are the highest cost producers (figure 7).
Figure 7: Producers in order of lowest to highest cost
PJM ISO website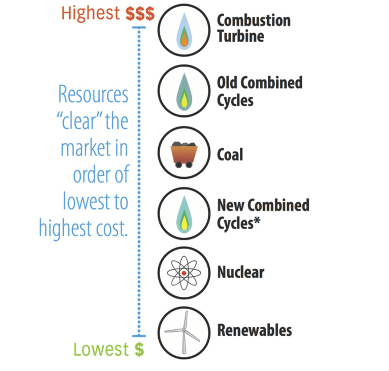
NextEra Energy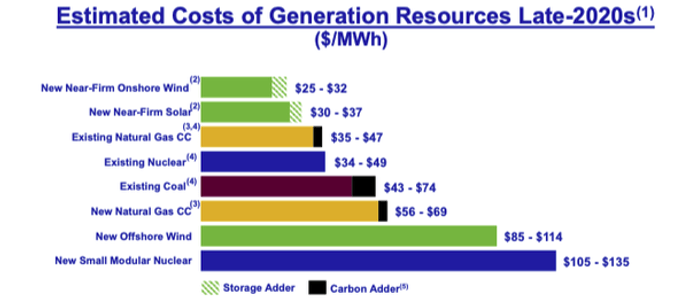
Renewable producers whose input “fuels” are wind and sunshine that cost nothing, and nuclear producers whose plants cannot be easily turned on and off, typically bid zero cents an hour. All producers who bid a lower price get paid the wholesale clearing price that is usually set by a higher cost producer (i.e., natural gas, nuclear, or coal), which establishes a pricing “umbrella” that gives the renewable and nuclear producers who bid zero cents per hour the confidence that they will receive reasonable revenues for the power they provide.
As there is no differentiation between the electricity generated by different sources, competitive producers like NEER have adopted the strategy of increasing shareholder value by aggressively expanding their low-cost, renewable generation capacity to capture more market share. NEER currently has about 28 GW of generation in operation, plus an additional 15 GW in wind and solar backlog which are under signed contracts that are expected to be completed by 2025.
NextEra Energy Partners
NEER’s heavy capital expenditures on its renewable power development projects suppresses NextEra Energy’s free cash flow generation (i.e., cash flow from operations less capital expenditures), locks up capital, and limits its ability to make dividend distributions, which makes the NextEra Energy stock less suitable for yield oriented investors.
To this end, NextEra Energy created NextEra Energy Partners (NEP), a limited partnership affiliate (figure 8) that it listed on the NYSE in 2014, to acquire renewable power generation and transmission assets from NEER and third parties. By focusing on operational cash flow generating assets that require modest maintenance capital expenditures, NEP is able to pay out dividends to attract yield-oriented investors, and the consideration it pays to NEER for operational assets frees up capital which enables NEER to re-invest in more new greenfield projects.
(NEP is structured as a limited partnership, which usually creates problems if held in deferred tax accounts. NextEra management stated in its May 2022 investor conference that NEP is structured to avoid such issues, but this is an issue I am decidedly unqualified to opine on and write about.)
NextEra Energy sold stock in NEP at the IPO and has been diluted down as NEP issued more stock to raise capital for its acquisitions but continues to own about 54.7% of NEP. NextEra also serves at the General Partner of NEP for which it receives an annual management of 1% of NEP OpCo’s EBITDA less certain non-cash, non-recurring items for the preceding fiscal year. Several NextEra Energy officers also serve as officers of NEP, while NEER President and CEO Rebecca Kujawa and NextEra Energy CFO Kirk Crewson serve both as officers and on the board of NEP.
Figure 8: Relationship between NextEra Energy, NEER, and NEP.
NEP S-3 filing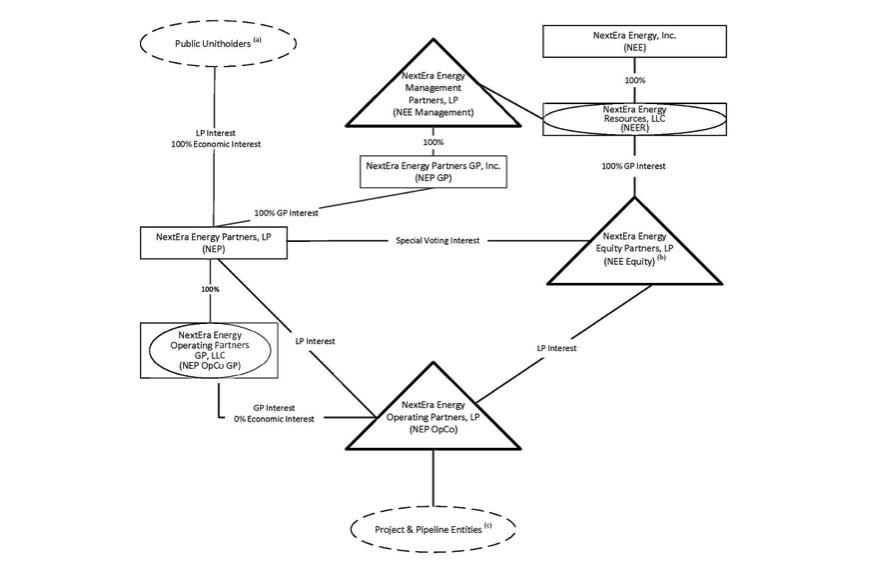
NEP currently has interests in 8.3GW of clean, contracted energy projects in 29 states it acquired from both NEE and third parties (figure 9, left panel). As its portfolio consisting mainly of completed, operating, and cash flowing generating and transmission assets, it can offer a strong and growing stream of distributions from its unitholders (right panel). NEP’s 8.3 GW of capacity is about one-eights that of NextEra Energy’s 61 GW portfolio, but it ranks #11 compared to its wind and solar power generation competitors on a standalone basis (see figure 2 above).
Figure 9: NEP portfolio and distributions.
NextEra Energy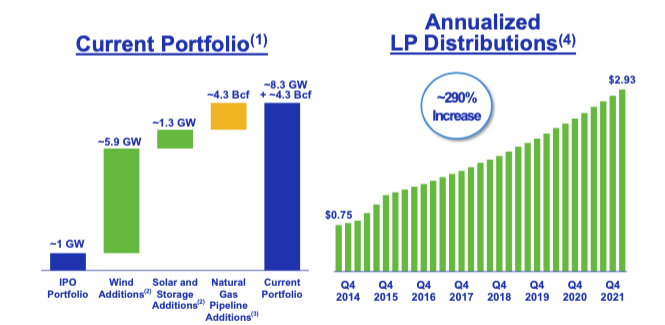
Market environment and implications for NextEra Energy
Low growth of power consumption in the U.S.
Demand for power in the U.S. has grown by about 33% in 1982 to 98 quadrillion Btus (qBtus) in 2021 (figure 10), for a modest compounded annualized growth rate of 0.75%. Energy consumption peaked in 2018 at 101,244 qBtus, declined to ~93,000 qBtus in 2020 with the COVID-19 lockdowns, but the 6-month year-through-June 2022 consumption of 50,300 qBtus is back to pre-COVID levels.
Figure 10: Electricity consumption in the U.S.
US EIA data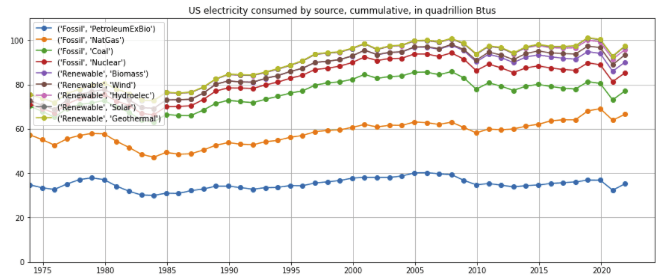
NextEra has capitalized on the growing importance in clean power
Fossil fuels such as petroleum (excluding biomass) and coal remain important fuel sources (figure 11, orange and dark blue lines) but have been in decline since peaking in 2005. Natural gas, a cleaner fossil fuel source, has grown in importance (green line).
Figure 11: Electric consumption in the US, by fuel source, in percent.
US EIA data
Wind and solar-generated power have increased their market shares to 3.4% and 1.5% respectively and did not decline through the COVID-19 pandemic due to their low generation cost (figure 12, red and green lines).
Figure 12: Electric consumption in the US, renewable fuel sources, in percent.
US EIA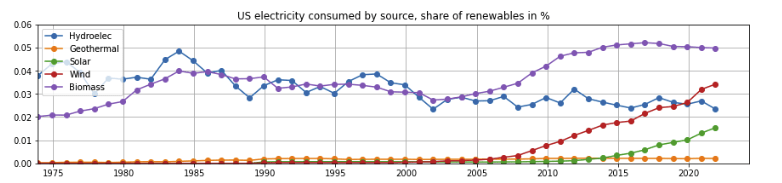
Wind and solar are the only energy sources that have grown share over the last two years (figure 13, grey and purple lines) and driven up the collective share of renewals (aqua dashed line). Fossil fuel usage declined sharply in 2020 through the COVID-19 economic slowdown and has remained below pre-COVID levels (dotted blue line).
Figure 13: Change in fuel sources of electricity generation.
US EIA data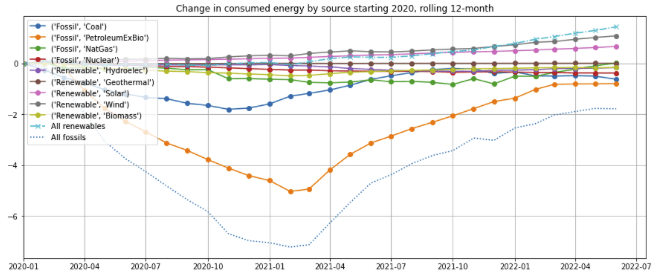
Florida’s large and growing economy expected to drive FPL’s long term rate base
NextEra management notes that the State of Florida, FPL’s main market, is the fourth largest economy in the US by GDP and would be the world’s sixteenth largest economy if it were a standalone country. It enjoys attractive demographic trends, including an above average population growth due to net inbound migration from other states, strong labor participation, low unemployment rates, and steady GDP growth (figure 14).
Figure 14: Florida’s attractive demographic trends.
NextEra Energy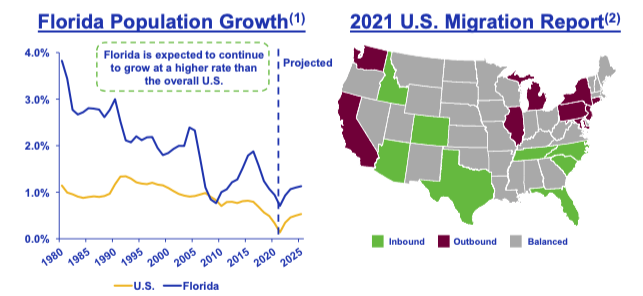
NextEra Energy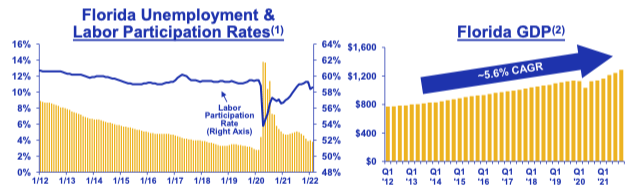
However, the state’s overall energy growth has been tepid–since 2000, total electricity generation has only grown by 1.35% p.a. (figure 15, pink dotted line). The vast majority of the state’s electricity is now generated by natural gas (orange line), while coal has continued to diminish in importance (blue line).
Figure 15: Florida state electricity generation by source.
US EIA data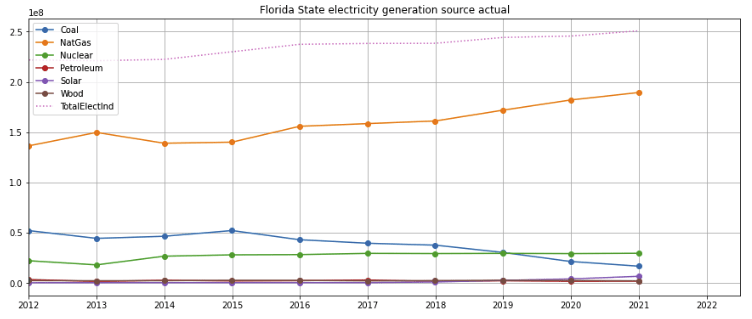
Nuclear energy has remained steady (figure 16, green line), but solar energy has increased from near-zero to about 2.5% of electricity production over the last five years (purple line).
Figure 16: Percentage of Florida state electricity generation from renewables.
US EIA data
Residential and commercial electricity prices in Florida are 10-15% cheaper than the US average, which partially explains the brisk cryptocurrency mining activity in the state (figure 17).
Figure 17: Florida electricity power compared to the U.S. average.
US EIA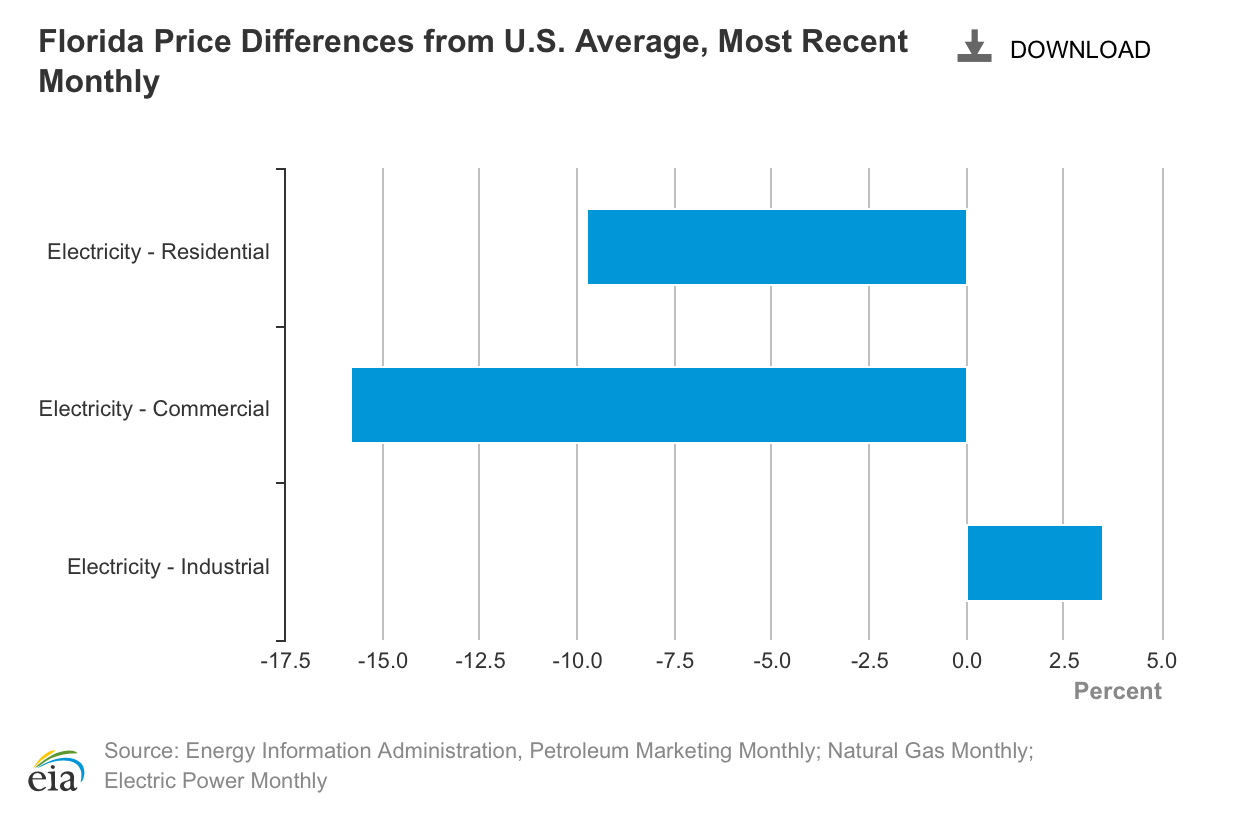
NextEra is well-positioned to address climate change challenges
Renewable energy and RECs
The long-term rise in global average temperature caused by the burning of fossil fuels has caused extreme weather patterns, sea levels to rise, and more acidic oceans, which threaten food and water security as well as coastlines around the world. Many organizations, including companies and governments, have committed to moving away from burning polluting fossil fuels such as coal and petroleum to cleaner energy derived from natural gas and nuclear electricity, and increasing the use of power generated from renewable sources such as wind and solar.
Movement towards clean energy
According to a Energy and Climate Intelligence Unit at least one-fifth of the world’s 2,000 largest public companies have committed to not adding new emissions to the atmosphere and meeting net zero targets in the future. This can be done in a number of ways, including, but not limited to, generating or purchasing power directly from clean sources, purchasing Renewable Energy Certificates (RECS) or carbon offsets, or planting trees to sequester carbon dioxide.
NextEra Energy generates about 96% of its electricity from clean or renewable sources such as natural gas, wind, solar, and nuclear energies (see figure 1 above). Natural gas critics maintain that the generation still releases significant amounts of carbon dioxide into the atmosphere, but the company is working on commercializing the use of green hydrogen, which is produced by splitting water into hydrogen through electrolysis using renewable solar or wind energy, to power converted natural gas generation turbines, and targets a full transition by 2045.
Each megawatt-hour of renewable energy that NextEra Energy generates and sells to the shared transmission grid entitles it to an openly tradable renewable energy certificate (REC). These RECs can be sold to purchasers of electricity, which can be used to meet compliance standards or voluntarily demonstrate to their stakeholders (typically customers) that they have met a certain standard of carbon emissions.
In recent years, the market pricing for RECs has appreciated significantly. In Texas, the price of RECs representing 1 MWh has appreciated by over 5-fold from 2018 to 2022, and the forecasted demand for RECs is expected to increase five-fold from 20 TWh (teraWatt-hours) to 107 TWh from 2022 through 2030 (figure 18). Even though NextEra does not report its revenues derived from the sale of RECs, I posit that the number is not negligible as over 80% of NEER’s power is generated from wind and solar energy (figure 5 above).
Figure 18: Pricing of renewable energy certificates in Texas.
NextEra Energy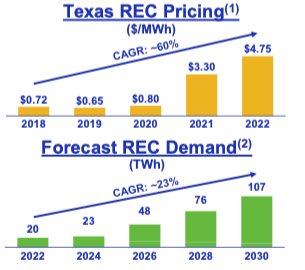
Storm-proofing transmission infrastructure
The intense storms resulting from climate change have caused widespread damage and electricity outage. FPL estimates that one day of improved storm recovery in its service territory is worth up to $2 billion in economic output. As such, it has invested heavily to harden its transmission infrastructure, which has resulted in a sharp reduction in customer outages, days to restore electricity serves, and transmission poles lost from Hurricane Irma in 2017 compared to damages incurred from Hurricane Wilma in 2005. FPL continues to invest heavily–it has doubled the number of underground and hardened feeders since 2017 and expects its transmission, excluding Gulf Power equipment which it acquired 2019, to be 100% steel or concrete by the end of 2022. Such investments increase FPL’s regulatory rate base and thus its allowable authorized earnings.
The Inflation Reduction Act (IRA) that was recently passed into law provides the policies and incentives, including production tax credits on rate base solar projects, will further lower the cost of decarbonization for customers, which directly benefits NextEra’s existing and future renewable energy investments.
Inflationary pressures
Recent inflation has driven up the price of natural gas, which tripled since the onset of the COVID-19 pandemic and reached an eight year high (figures 19 and 20). With almost half of electricity in the US is generated with natural gas and coal (figure 11 above), the price of electricity has surged (figure 21).
Figure 19: Natural gas spot price.
St. Louis Federal Reserve FRED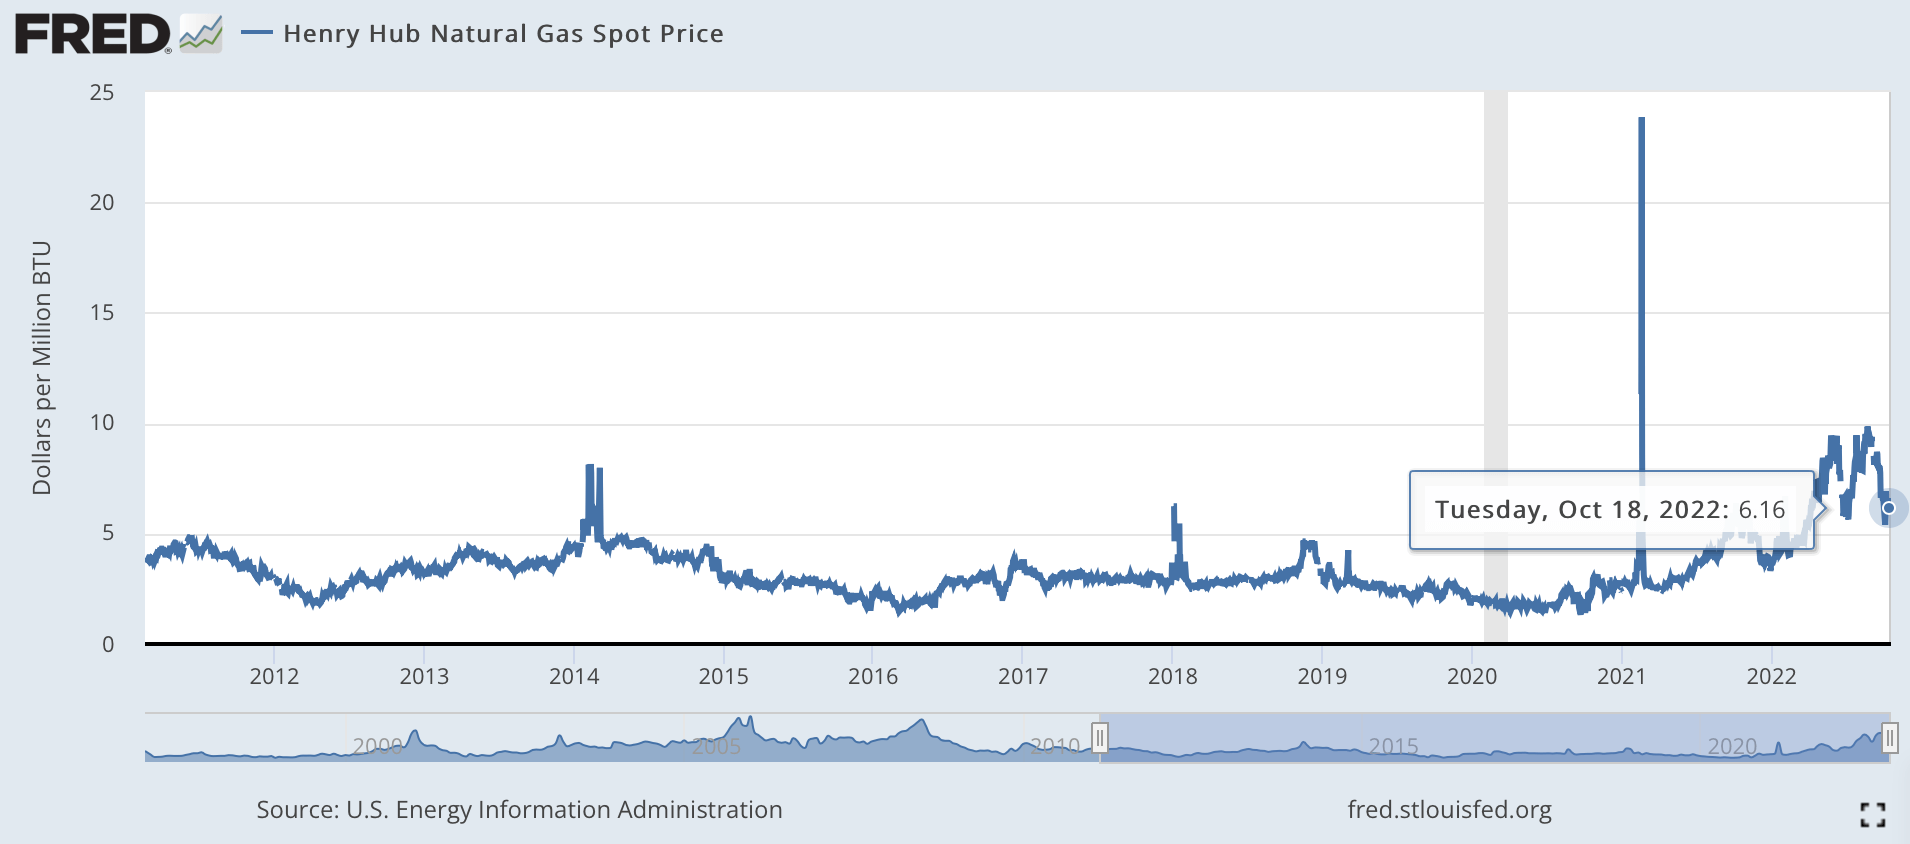
Figure 20: Coal prices.
St. Louis Federal Reserve FRED
Figure 21: Average electricity prices in the U.S.
St. Louis Federal Reserve FRED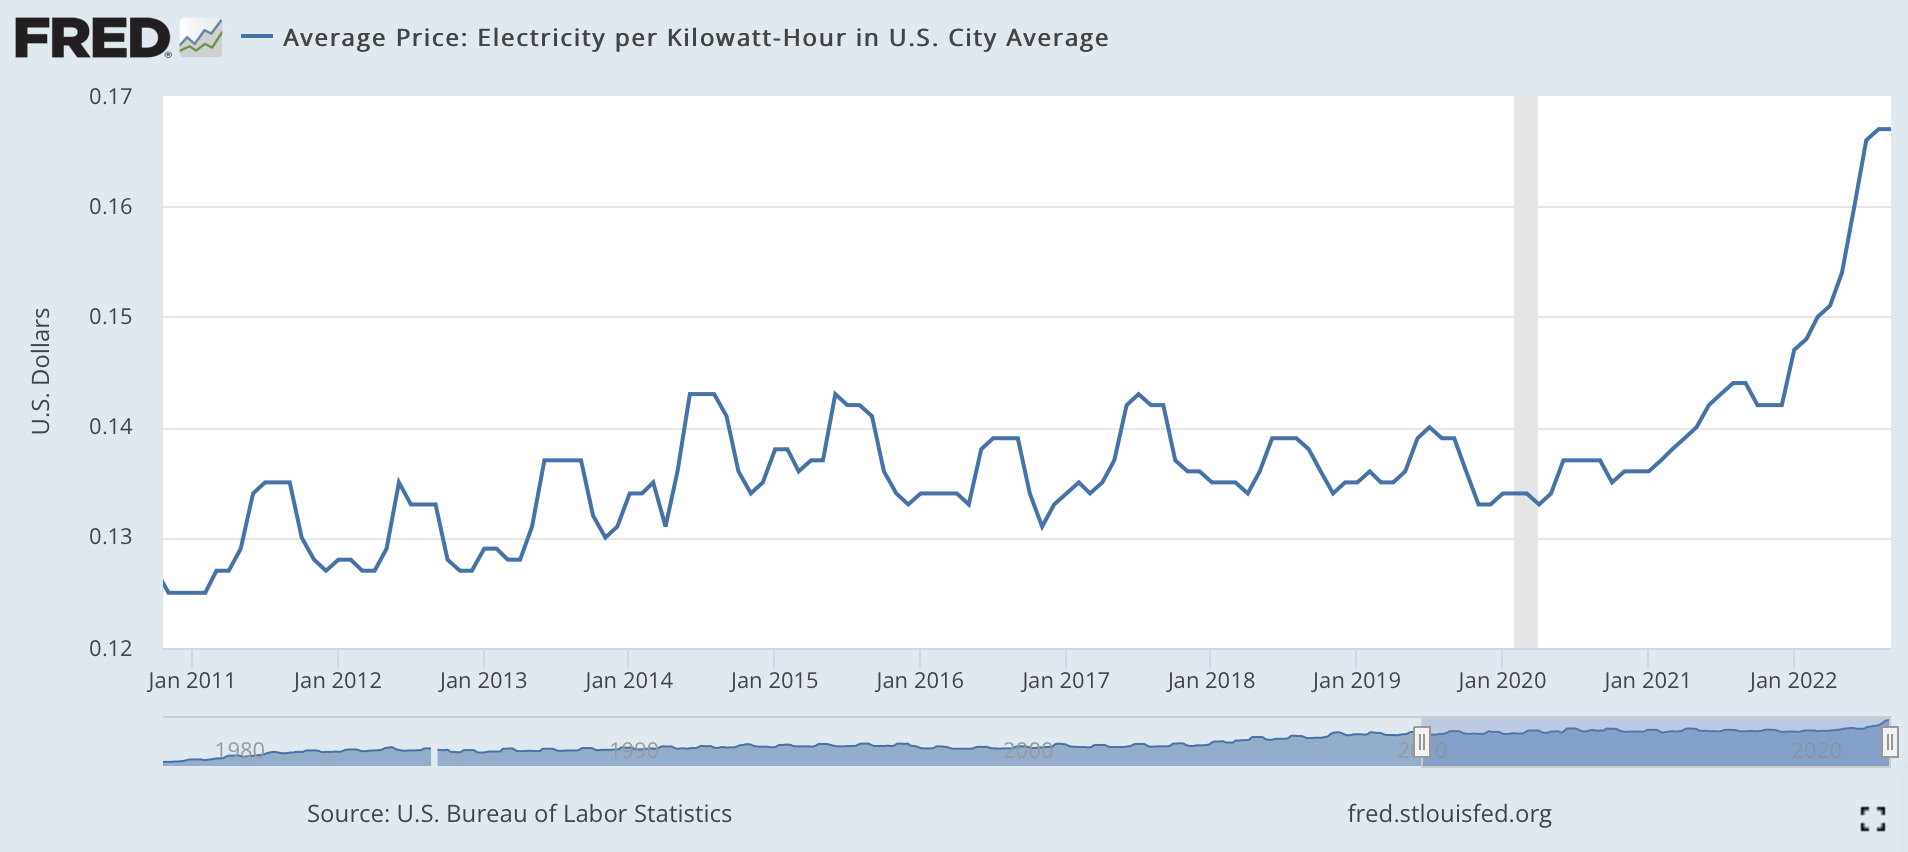
As wind and sunshine inputs are not subject to inflationary pressures, the inflation in natural gas and coal prices widens the cost advantage that wind and solar power already has over fossils (discussed in figure 7 above). NEER estimates that the cost advantage of wind and solar energies over natural gas will widen to 53% and 49% respectively (figure 22), benefiting NEER as 44% of its electricity is generated by wind and solar power.
Figure 22: Effect of inflation on levelized costs of wind and solar vs natural gas generation.
NextEra Energy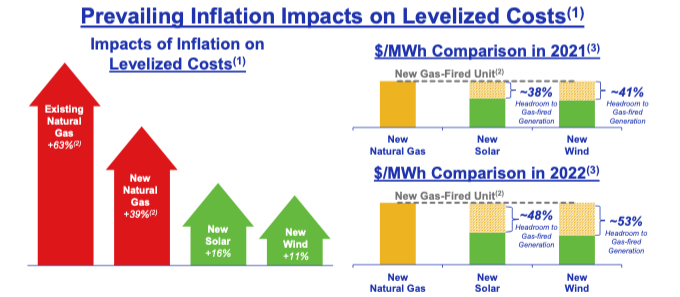
Investment thesis
NextEra‘s key competencies and the current market environment
NextEra has executed well and generated attractive shareholder returns over the last decade. I narrow its key competencies to five key factors: operational excellence, data analytics, leadership in electricity production from renewables, scale, and access to capital. These competencies are mutually reinforcing, perpetuating a virtuous cycle that enables the company to capitalize on the opportunities in its markets to outgrow, stay ahead of, and create more shareholder value than its peers.
Operational excellence
Over the last 30 years, FPL has transformed itself from an average utility with operation expenses (as measured by non-fuel operational and maintenance costs (O&M) per megawatt hour) that is 4% above the US industry average to one that is 66% below the average utility (figure 23).
Figure 23: FPL non-fuel O&M costs per megawatt hour.
NextEra Energy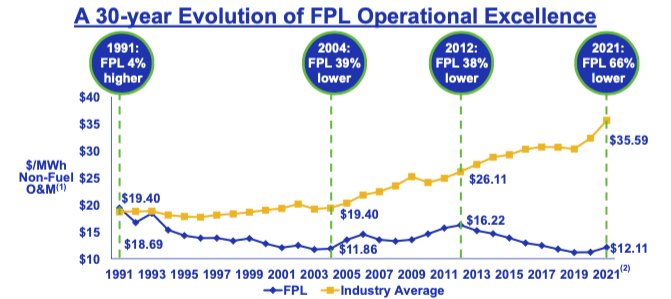
FPL’s operational cost effectiveness now ranks well above the top decile compared to its peers (figure 24).
Figure 24: FPL’s operational cost effectiveness.
NextEra Energy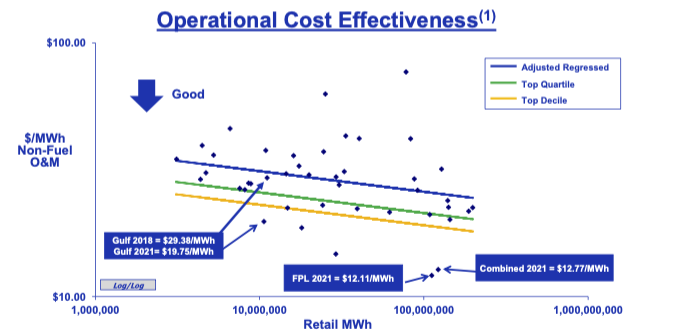
As a result, residential customers in FPL’s service territories pay almost 20% and 30% less for each megawatt hour compared to Florida and US national averages (figure 25, left panel). In addition, FPL customers experience 56% less power outages than the average customer in Florida (right panel) despite the cost of remediating damages caused by the highly destructive storms and hurricanes that regularly hit the area.
Figure 25: Comparison of FPL’s electricity bills and reliability vs peers.
NextEra Energy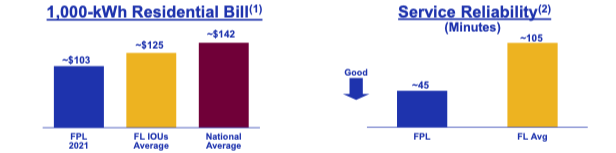
The company attributes its revenue growth and cost savings to an “annual, bottoms-up, employee-generated process,” which has yielded annual run-rate cost savings of over $2.3 billion since 2013 (figure 26).
Figure 26: Cost savings from employee-generated ideas.
NextEra Energy
While management has rightly limited the disclosure of the details in its cost-cutting playbook for competitive reasons, it cited several examples, including the installation of smart meters to cut down meter reading costs, use of drones to perform labor-intensive tasks such as transmission line inspection, as well as cross-training and improve scheduling of field technicians to reduce both the time and cost of repairs (figure 27).
Figure 27: Digital applications at FPL.
NextEra Energy
Employee feedback on Glassdoor.com has been mixed: some current and former employees cited the company’s leadership in clean energy and management’s willingness to listen as plusses. However, others complained about being overworked, the lack of flexibility, and expressed concern that Project Velocity is a cost cutting exercise used to hold cost stagnant and lay off employees.
For the next phase of cost reduction, management is planning the implementation of computer image recognition to enhance its preventative maintenance and application of machine learning and artificial intelligence in the construction of its smart grids.
NextEra‘s operational excellence and cost discipline leads to more future growth opportunities:
(1) Cost leadership leads to more volume and higher profitability in NEER’s wholesale markets
In the competitive wholesale markets where merchant power producers bid on the basis of price in the reverse auction process conducted by independent system operators based on the mechanism described in figure 6 above, the ability to reduce and keep costs below that of its peers enables NEER’s existing and new power generation plants to better meet or beat the market clearing price and maximize profitability for each unit of power it supplies.
(2) Rate base increases at FPL
As FPL’s authorized earnings is limited by the upper bound of its regulatory return on equity, which is 110 basis points above its 10.60% of its rate base, the ability for FPL to benefit from large short-term cost cuts is capped. To grow its long-term earnings, the company needs to expand its rate base by growing FPSC-approved capital spending.
I expect FPSC will continue to approve new generation facilities to accommodate the state’s population and economic growth. However, I believe FPL’s consistently lower than state average and declining power costs likely gives FPSC regulators leeway to approve more capital spending to enhance reliability and reduce emissions.
Over the last 10 years, FPL’s rate base increase was largely driven by capital expenditures to expand and harden its transmission and distribution system (figure 28, blue blocks) and reduce emissions. More recently, the company reported in its Q3 2022 earnings call that FPL’s regulatory capital employed grew by 11.3% in the quarter compared to Q3 2021. This capital spending has yielded clear tangible results–management noted that despite the devastating storms and 150 mph winds caused by Hurricane Ian in September 2022, none of FPL’s transmission poles or towers were lost, underground distribution power lines had one-fifth the outages compared to overhead transmission, and there was almost no structure damage to any FPL power plant. The company’s generation maintenance spending has also greatly reduced the carbon dioxide (CO2), sulfur oxide (SOX), and nitrogen oxide (NOX) emissions, which is now far below U.S. industry averages (figure 29).
Figure 28: FPL’s capital expenditures.
NextEra Energy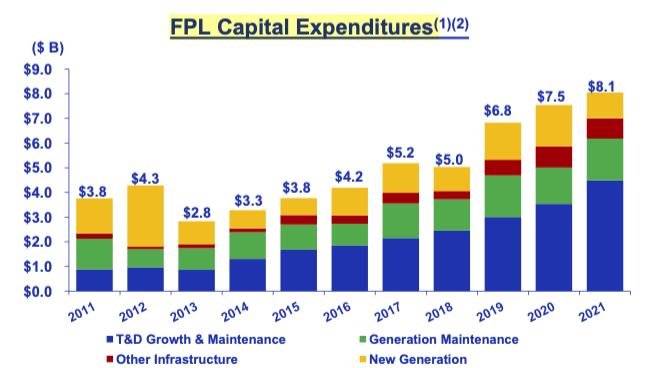
Note (1): Total baseline capital expenditures represents potential incremental expenditures in addition to previously approved projects;
Figure 29: FPL’s emissions rate over time and compared to industry averages.
NextEra Energy 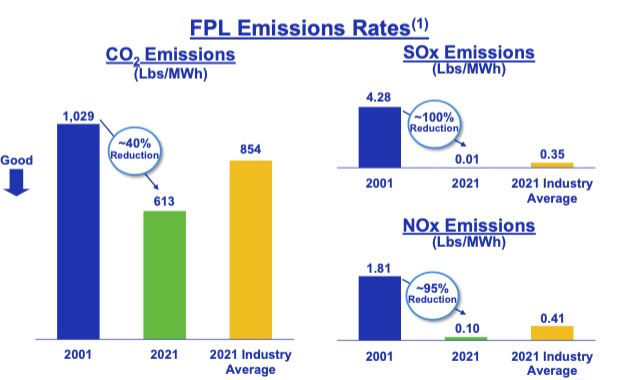
(3) Acquisition opportunities at both FPL and NEER
Since FPL acquired Gulf Power from The Southern Company (SO) in 2017, it has driven down Gulf Power’s O&M expenses down by 40% (figure 30, left panel), vaulting from a second quartile to a top-decile performer in three years (see figure 24 above). In addition, it has improved Gulf Power’s service reliability, as measured by outages, by 60% (right panel).
Figure 30: Gulf Power operational costs and reliability post-FPL acquisition
NextEra Energy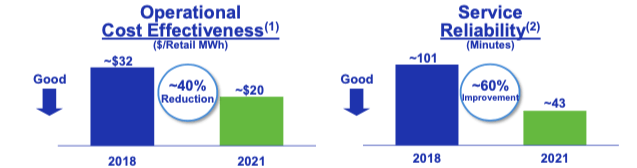
The acquisitions of regulated monopolistic power utilities have been highly politicized and complicated endeavors. Several of NextEra’s previous proposed efforts to acquire regulated utilities have been rejected, including Hawaiian Electric Industries for $4.3 billion in 2014, Texas’s Oncor Electric for $18 billion in 2017, and Duke Energy–the dominant utility in North Carolina which also serves parts of Florida–in 2020. FPL’s demonstrated record of lowering utility bills for customers of Gulf Power may put more pressure on regulators, legislators, and boards of future acquisition targets to seriously consider the transactions.
NextEra Energy’s established playbook and knowhow to take out costs and improve generation efficiency also creates additional opportunities for NEER to acquire and turnaround under-managed plants in attractive locations for its portfolio.
(4) Improve assets acquired by NextEra Energy Partners
As NEP acquires generation and transmission from both NEER and third parties, it can also leverage and benefit from NextEra Energy’s intellectual knowhow to improve its assets, lower costs, and grow earnings. This benefits shareholders of both NEP and NextEra Energy, which continues to hold a majority (~55%) ownership stake in NEP.
Leadership and data analytics in renewables
In the early 2000s, NextEra Energy become one of the first adopters of renewable energy generation. Its early start in renewables included the 2006 acquisition of Windlogics (since renamed NextEra Analytics), which applies advanced math, data, and physical sciences to forecast wind and solar energy patterns as well as optimize siting, plant and grid operations, power marketing, and consumption patterns. Leveraging this knowhow, the company was able to acquire rights to pieces of land that are most conducive to wind and solar generation and build or gain access to transmission grids for distribution. This early mover advantage has enabled the company to expand its wind and solar capacity by ten-fold (figure 31, right panel) since 2002, reduce CO2 emissions (left panel), grow into the world’s largest developer and owner of renewable energy generation–generating 50% more energy from renewables than its closest competitor (figure 2 above), and capture a substantial share of the renewables market from 2019-21, including for half of the total wind market in 2021 (figure 32).
Figure 31: NextEra Energy CO2 emissions reduction and wind and solar capacity additions.
NextEra Energy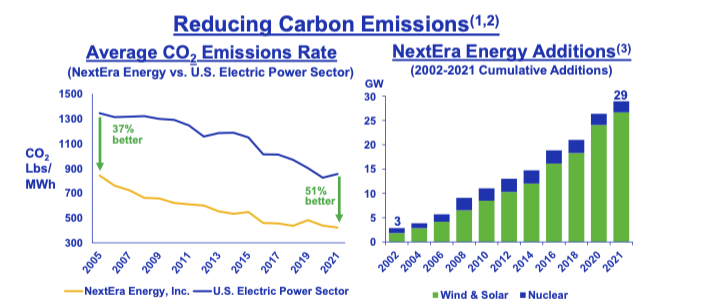
Figure 32: NEER share of the renewables market.
NextEra Energy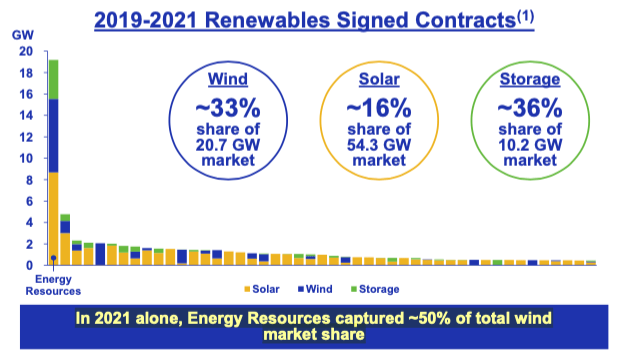
Over the years, many independent solar and wind power developers have come and gone. However, NextEra Energy has remained among the largest and most consistent long term purchaser of wind turbines, solar panels, and batteries, and has built relationships with vendors that give it preferential access to generation equipment even in tight supply-constrained markets. It has also continued to invest in transmission assets to ensure the power it generates can be distributed to the end-markets.
Wind and solar generation facilities are expected to remain the lowest cost producers of electricity for the foreseeable future (see figure 7 above) and will almost certainly clear the threshold clearing prices set in the ISO reverse auctions (see figure 6 above). As such, wholesale wind and solar developers with access to the appropriate land, generation equipment (i.e., turbines or solar panels), transmission grids, and expertise to build generation facilities at reasonable cost, are likely to receive an attractive return on their investment for the coming years.
I also note that FPL’s total fuel expense has dropped at a -3.1% annualized rate as its shifted its power generation fuel mix away from higher cost coal and petroleum towards solar and lower cost fuels such as natural gas (figure 33, right panel).
Figure 33: FPL capital spending and operating expenses.
NextEra Energy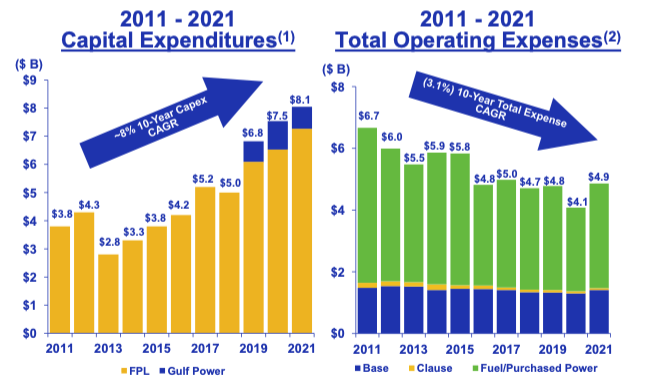
Access to capital to build more assets
NextEra Energy has a strong balance sheet and a higher credit rating (A- by S&P and Fitch, Baa1 by Moodys–all stable) compared to its peers (figure 34), which has enabled it to obtain twice the amount of credit than its next largest peer (figure 35) at with lower weighted interest rates (figure 36), giving it more firepower to continue making more investments.
Figure 34: Utility credit ratings.
NextEra Energy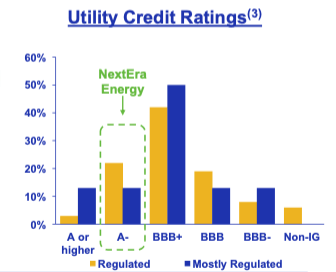
Figure 35: NextEra credit facilities compared to utility peers.
NextEra Energy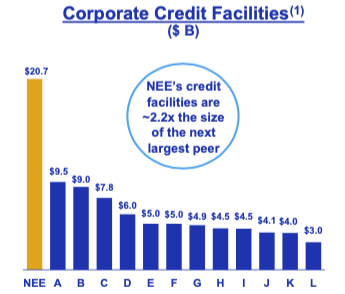
Figure 36: NextEra debt profile vs peers.
NextEra Energy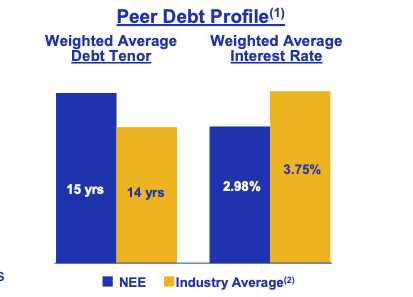
NextEra Energy’s scale and strong credit rating has made it the fifth largest capital investor in the U.S. (figure 37), behind only Amazon (AMZN), AT&T (T), Verizon (VZ), and Alphabet (GOOG). The ability to invest capital at attractive rates of return makes the company a good vehicle to compounding capital over the long term.
Figure 37: NextEra’s ranking amongst the top 10 U.S. capital investors.
NextEra Energy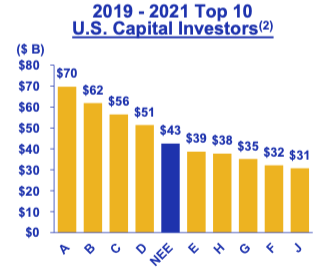
NextEra Energy Partners, which invests in and holds more mature renewable power generation assets, is better suited to risk-averse investors who favor stable operating assets with higher cash flow visibility over more risky developmental projects. By selling shares in NEP to the public, NextEra Energy has expanded its addressable shareholder base to include more income-oriented, yield seeking investors.
NextEra Energy and NextEra Energy Partners have formed a mutually beneficial relationship (figure 38). The ability for NEER to sell some of its mature assets to NEP enables NextEra Energy to free up and recycle capital to develop more plants, while its ownership of NEP shares entitles it to dividends. NEP also benefits from the management and operational expertise it receives from NEER.
Figure 38: The symbiotic relationship between NextEra Energy and NextEra Energy Partners.
NextEra Energy
Scale advantages
NextEra Energy has grown into the world’s largest utility in 2022 with a market capitalization of $148 billion, 72% larger than the next largest player, up from the 30th largest utility in 2001 (figure 39). The company’s large size gives it significant advantages in terms of economies of scale, the ability to attract talent, as well as leverage and negotiating power over its suppliers. While size can lead to bureaucracy and potentially become a liability, NextEra Energy appears to be very well managed, continues to be entrepreneurial, and this does not appear to be an issue so far.
Figure 39: Market capitalization.
NextEra Energy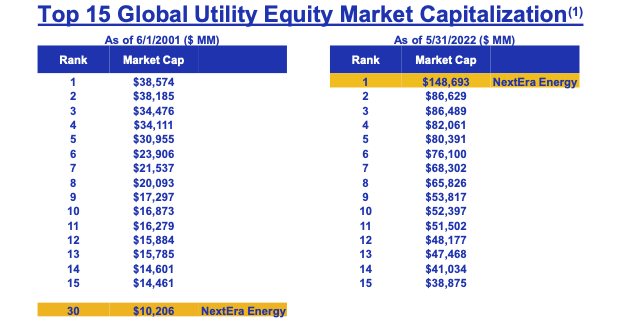
Summary of thesis
The company’s operational excellence, cost leadership, expertise in data analytics, competence in building and operating low-cost wind and solar power generation facilities, access to capital, and scale advantages, along with FPL’s attractive customer demographics and rising rate base, and potential for future acquisitions, create and perpetuate a virtuous cycle that gives NextEra Energy a competitive advantage and drives continued growth over the long term.
Growth expectations
FPL
FPL’s regulatory capital employed stands at $49.3 billion at of 2021, which it expects to grow at a 9% annual rate through 2025 (figure 40). Assuming the company continues to achieve its authorized regulatory return on equity of 10.6%, the segment’s earnings should grow at the pace of the rate base. Additional upside could come from approvals for more wind generation capacity or future acquisitions.
Figure 40: FPL’s regulatory capital employed.
NextEra Energy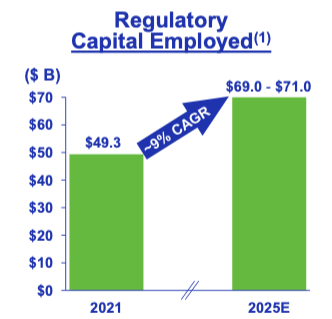
Note: excludes accumulated deferred income taxes.
NextEra Energy Resources
NEER expects to invest $14-16 billion each year, the majority in renewables, from 2023 through 2025 (figure 41 green bars).
Figure 41: NEER projected capital expenditure.
NextEra Energy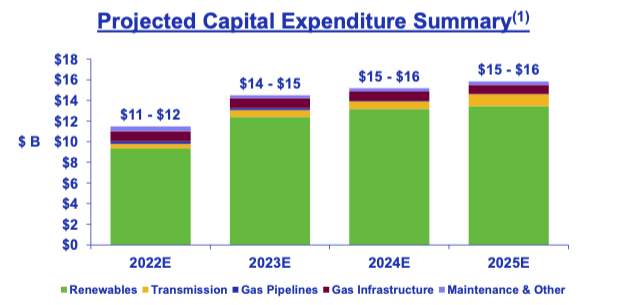
Note: includes $2.8-3.2 billion in cumulative capex in transmission from 2022-2025, or about $700-800 a year
Assuming the capital expenditure meets the company’s return on investment expectations, NEER’s earnings should grow by 50% through 2025, for an annualized rate of ~12% (figure 42).
Figure 42: NEER earnings projections.
NextEra Energy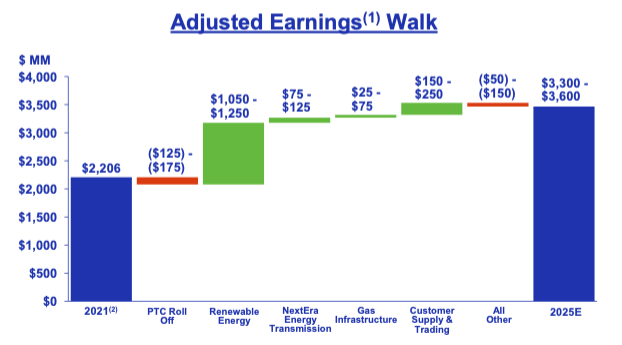
Blending the growth estimates of FPL and NEER yields a 10-11% annual growth rate for the next several years. In NextEra Energy’s Q3 2022 earnings presentation, management re-affirmed a 10% compounded annual growth rate through 2025, adding that “we will be disappointed if we are not able to deliver financial results at or near the top end of our adjusted EPS expectations ranges through 2025”.
NextEra Energy Partners
NEP has a current yield of 4.2% as of the time of the writing of this article, and in the Q3 2022 earnings presentation, management reaffirmed its 12-15% annual per share distribution growth of 12-15% p.a. through 2025 (figure 43).
Figure 43: NextEra Energy Partners yield and growth expectations.
NextEra Energy
I believe this projected growth rates at NextEra Energy and NextEra Energy Partners will both generate highly attractive risk-adjusted returns for long term investors.
Valuation
On the surface, the valuations of NextEra Energy and NextEra Energy Partners on a free cash flow yield basis (FCFy) are very high but roughly in line with other major utilities (figure 44). The FCFy is depressed because of the high capex spending on renewable generation facilities and transmission lines. NextEra Energy’s free cash flow is projected to remain low to negative through 2025 (figure 45).
Figure 44: Free cash flow yield of NextEra Energy and NextEra Energy Partners vs peers.
Created by author using publicly available financials and stock price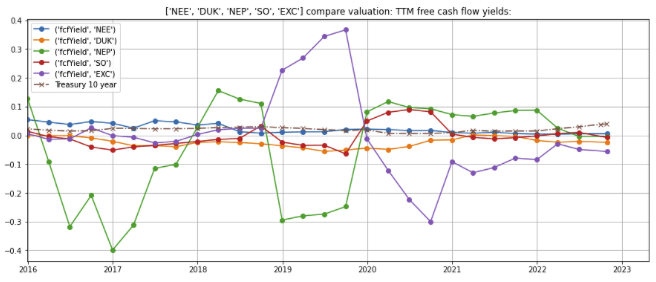
Figure 45: NextEra’s projected free cash flow profile.
NextEra Energy
However, under a hypothetical “steady state” scenario in which NextEra Energy stops new development and only spends necessary maintenance capital expenditures on its existing assets, the business would generate $8.4 billion in cash (figure 46), for a free cash flow yield of 5%. This hypothetical “steady state” scenario, which measures the valuation based on its operational assets, suggests that the valuation is not as steep as it might appear prima facie.
Figure 46: NextEra Energy “steady state” cash flows.
NextEra Energy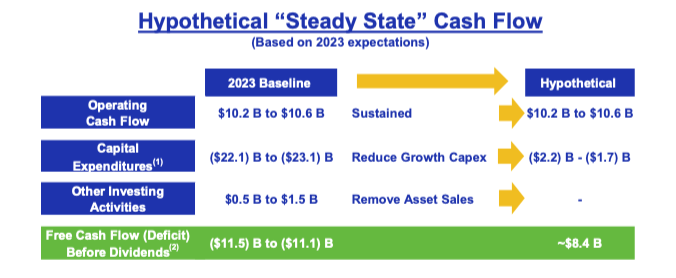
At just below 2%, the earnings yield valuation (i.e., the reciprocal of the price earnings ratio, figure 47, blue line) for NextEra Energy based on GAAP (generally accepted accounting principles) earnings is also high. However, if we were to factor in gains/losses from non-qualifying hedges and non-recurring charges (discussed in concern #2 below), the adjusted earnings per share of $2.55 results in a more reasonable 3% earnings yield.
NextEra Energy Partners appears to be more reasonably valued at a ~6% earnings yield (green line).
Figure 47: Earnings yield valuation of NextEra Energy and NextEra Energy Partners vs peers.
Created by author using publicly available financials and stock price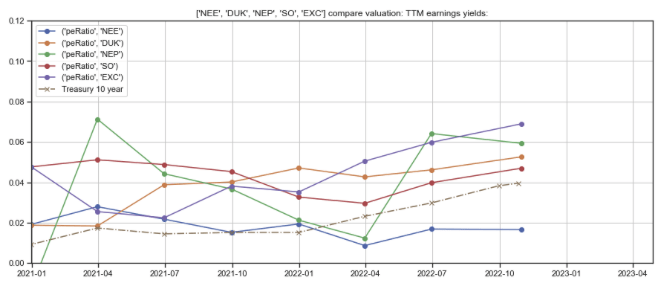
Investing with a DRIP strategy
Long term investors who invested in NextEra Energy or NEP in tax-deferred accounts using a dividend reinvestment plan (DRIP)–a strategy in which dividends received are automatically used to purchase additional stock–would have done quite well.
NextEra Energy shares
An investment of $10,000 for 677 NEE shares in February 2007 would be worth $84,600 today (figure 48, blue line), comprising of $53,500 from the 677 shares acquired (orange dashed line) plus $31,100 from the 394 shares purchased through the DRIP strategy (dotted green line).
Figure 48: NextEra Energy share DRIP strategy–15-year returns.
Created by author using publicly available financials and stock price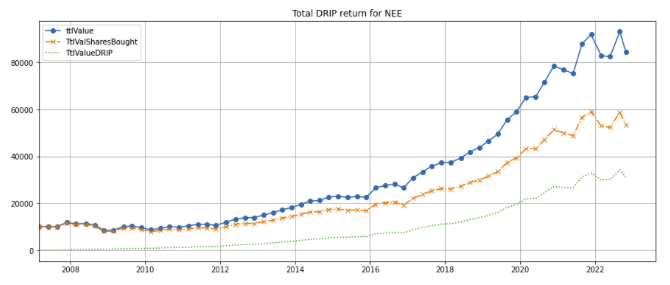
NextEra Energy Partner shares
Similarly, an investment of $10,000 for 278 NEP shares in November 2014 shortly after the IPO would be worth $28,000 today (figure 49, blue line), comprising of $20,800 from the 278 shares acquired (orange dashed line) plus $7,200 from the 96 shares purchased through the DRIP strategy (dotted green line).
Figure 49: NextEra Energy Partners DRIP strategy–returns since IPO.
Created by author using publicly available financials and stock price
Concerns
(1) More interest rate hikes
If the Federal Reserve continues to raise interest rate, the dividend yields of both NextEra Energy and NextEra Energy Partners become comparatively less attractive to risk-free treasuries, which could cause the stock prices of both entities to pull back. Even though the escalator in FPL’s regulatory return on equity agreement with the FPSC has come into effect as the 30-year treasury yield has risen above 2.49% for more than a consecutive six months (figure 3 above), the 20 bp adjustment is modest and does not benefit NEER or NEP. In addition, the economic slowdown resulting from rate hikes could cause a near-term decreased in energy demand. In mitigation, I believe the value of NextEra and NextEra Energy Partners will continue to appreciate over the long term as they raise dividends along with the growth of cash flow from their power generation assets.
(2) NextEra Energy has shown flat per-share GAAP financials for the last five years
NextEra Energy’s trailing twelve-month ((TTM)) per-share GAAP financials have been flat for the last half a decade, but the stock price has tripled (figure 50) in part due to the expansion of the valuation multiple.
Figure 50: NextEra Energy TTM per-share financials (indexed to December 31, 2016).
Created by author using publicly available financials and stock price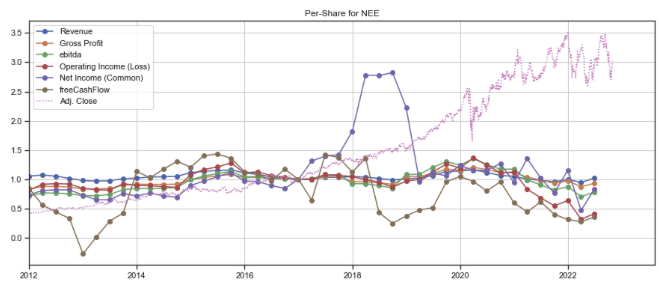
However, under GAAP, there are non-cash gains/loss from the mark-to-market valuation of hedges and non-recurring items that create volatility, potentially causing earnings to be less indicative of the actual performance and thus the intrinsic value of the company.
According to Note 3 of NextEra Energy’s financial report presented in page 80 of the 2021 10-K filing (this gets a quite technical):
NEE and FPL use derivative instruments (primarily swaps, options, futures and forwards) to manage the physical and financial risks inherent in the purchase and sale of fuel and electricity, as well as interest rate and foreign currency exchange rate risk associated primarily with outstanding and expected future debt issuances and borrowings, and to optimize the value of NEER’s power generation and gas infrastructure assets.
Derivative instruments, when required to be marked to market, are recorded on NEE’s and FPL’s consolidated balance sheets as either an asset or liability measured at fair value.
For NEE’s non-rate regulated operations, predominantly NEER, essentially all changes in the derivatives’ fair value for power purchases and sales, fuel sales and trading activities are recognized on a net basis in operating revenues and the equity method investees’ related activity is recognized in equity in earnings of equity method investees in NEE’s consolidated statements of income.
Settlement gains and losses are included within the line items in the consolidated statements of income to which they relate. Transactions for which physical delivery is deemed not to have occurred are presented on a net basis in the consolidated statements of income.
By excluding the effect of the mark-to-market of non-qualifying hedges, one-time investment gains/losses/write-offs, and non-recurring charges, the adjusted earnings per share presents a clearer picture of the consistency of growth in NextEra Energy’s core earnings power (figure 51, bottom line).
Figure 51: Reconciliation of GAAP earnings per share to adjusted earnings per share.
NextEra Energy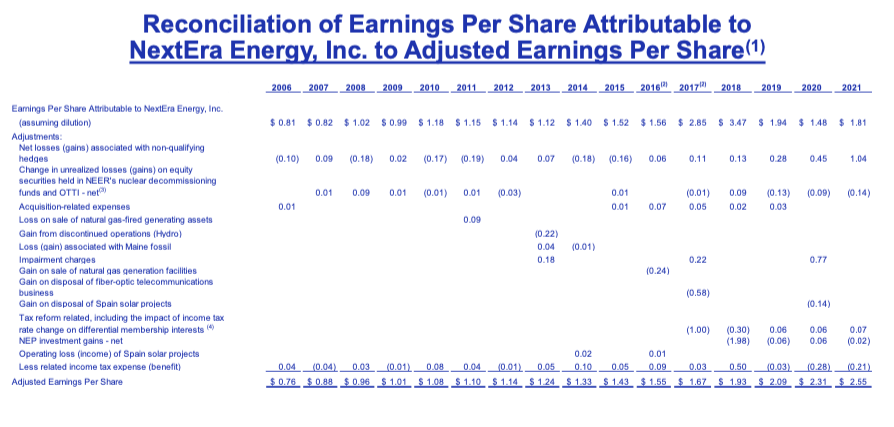
(3) Risk of overspending and overcapacity in the wholesale market:
Most large US investors in power generation capacity are public utility companies which have regulated rate bases. The largest, Duke Energy (DUK) has a relatively small wholesale renewables segment which it announced in August 2022 that it is exiting. Exelon Corp (EXC) is primarily a regulated utility company. Southern Companies (SO) and Dominion Resources (D) both own unregulated wholesale power businesses but at $2.2 billion and $1 billion in revenue respectively, they are smaller than NEER.
Mid-American Energy, a subsidiary backed by the deep pockets of Berkshire Hathaway (BRK.A, BRK.B), is a formidable competitor in wind energy but seems to be quite focused in Iowa, whereas NEER’s wind farms are spread out from North Dakota through Texas, New Mexico, and California.
As US electric utilities still own a large amount of higher cost generation facilities, it can sometimes be cheaper for some utilities to purchase power from wholesale power producers rather than generate power using their own facilities. As such, wholesale producers like NEER who maintain a cost advantage will continue to thrive for the foreseeable future.
(4) High leverage:
The debt to EBITDA coverage ratios for both NextEra Energy and NextEra Energy Partner exceed 6x (figures 52 and 53, dotted red lines, right axis) which is quite high on both an absolute basis and relative to its large utility peers. However, I believe the company’s stable cash generation from its existing portfolio and expected growth from assets with signed contracts and expected to commence operation over the next several years helps mitigates this concern.
Figure 52: Credit statistics for NextEra Energy.
Created by author using publicly available financials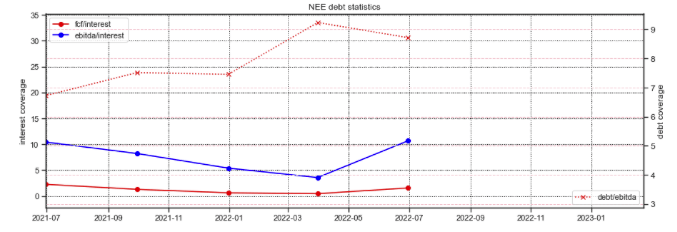
Figure 53: Credit statistics for NextEra Energy Partners.
Created by author using publicly available financials and stock price
(5) Trade tariffs and supply disruptions on solar panels
On April 1, 2022, the US Department of Justice announced a review of anti-dumping and countervailing duties circumvention claim on solar cells and panels supplied from four Southeast Asian countries (Malaysia, Cambodia, Vietnam, and Thailand). This review created significant price uncertainty as the additional tariffs on panels from these countries would be retroactive and remain unknown for the next two years, leading to widespread solar project cancellations and delays. However, in June 2022, the Biden Administration announced a two-year waiver on new tariffs on solar modules imported from Southeast Asia gave developers the clarity to resume imports to restart projects.
Future new tariffs on solar cell and panel imports could undermine the deployment of solar technology and NextEra Energy’s growth.
In summary
- NextEra Energy is a leading US developer, constructor, and operator of electric and energy infrastructure, providing nearly 5% of all US generation capacity through its two segments–a regulated public utility in Florida and a wholesale clean electricity provider
- NextEra Energy Partners, a publicly-listed affiliate of NextEra Energy, acquires more mature, cash flowing renewable power generation and transmission assets from NEER and third parties, and may be appropriate for yield seeking investors
- NextEra Energy’s operational excellence, data analytics, leadership in renewables, scale, and access to capital positions both companies well to benefit from the growing demand for clean power, need to enhance Florida’s transmission infrastructure, and inflation in natural gas prices which widens its cost advantage vs fossil fuels
- Valuations are high but are less daunting if we take into account the mark-to-market accounting for its hedges, non-cash gains/losses, non-recurring items, and heavy investment spending in long term generation and transmission assets.
- Both are potentially interesting investments for long-term buy-and-hold investors, especially by employing a dividend reinvestment plan strategy.
Be the first to comment