

bodnarchuk
1 – Presentation
Newmont Corporation (NYSE:NEM) is the world’s leading gold miner, producing primarily gold and copper, silver, zinc, and lead. I have owned this company for over a decade and consider it one of my significant investments in the gold sector.
Newmont Corporation is part of a small group of gold miners that I consider safe for long-term investment.
My portfolio is comprised of three solid gold producers.
Newmont presents an excellent profile. During the second quarter of 2022, the company announced revenues of $3,058 million, nearly unchanged compared to the second quarter of 2021. Revenues from gold represented 89% of the total revenues.
NEM Quarterly revenues per metal in 2Q22 (Fun Trading)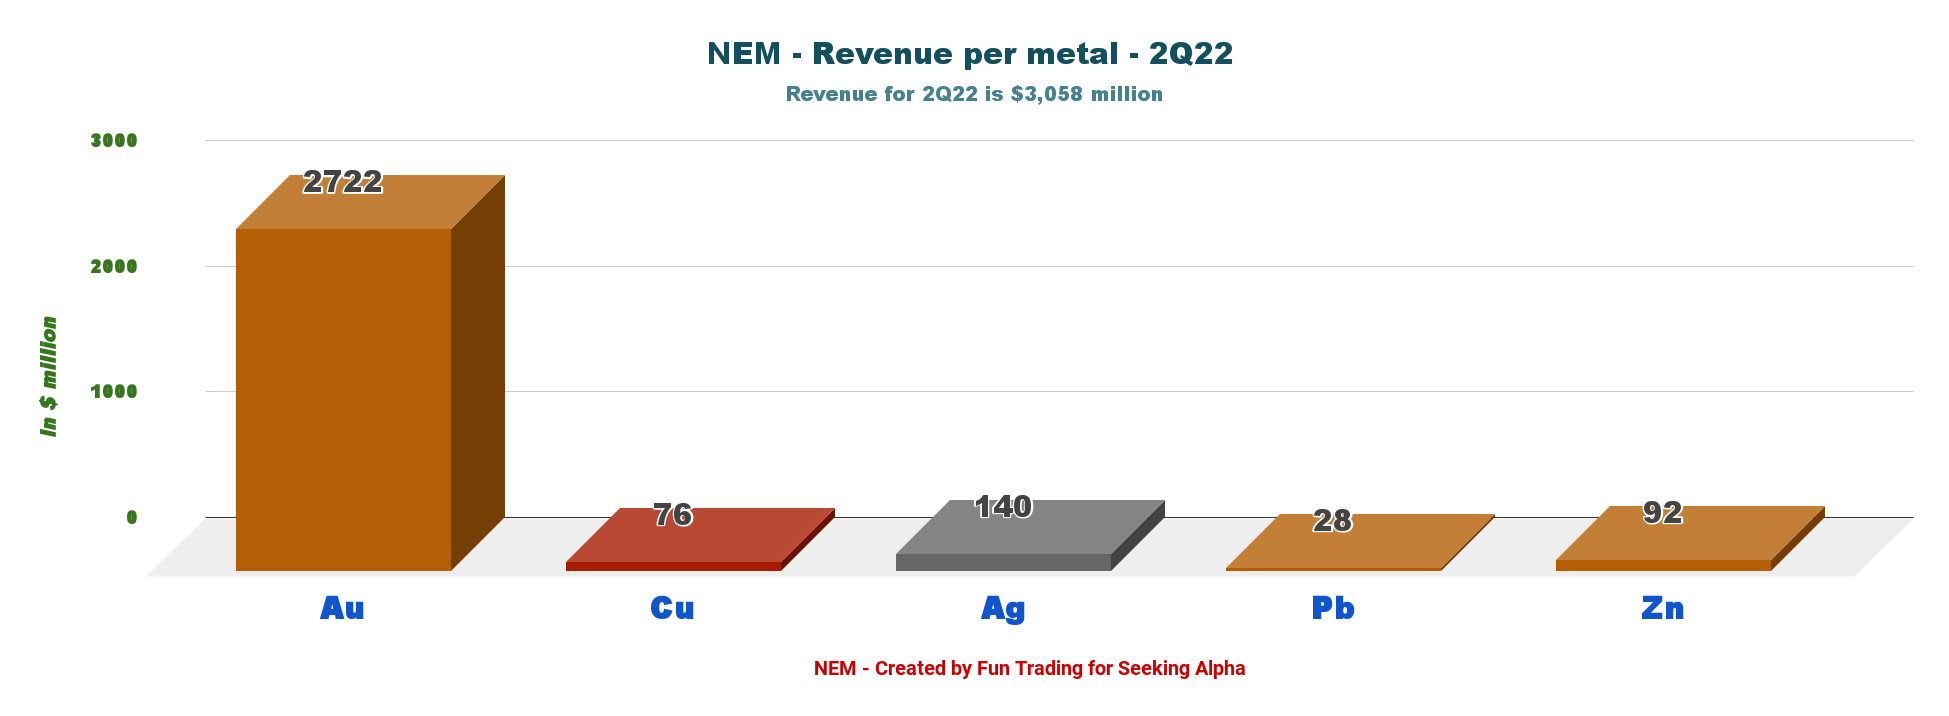
Regarding revenues and production, Newmont is leading GOLD and AEM at a competitive all-in sustaining costs AISC, albeit inflationary pressures are starting to bite. Newmont’s AISC increased by 15.8% year over year.
| Gold Production | K Au Oz | Revenues | AISC |
| NEM | 1,495 | 3,058 | 1,199 |
| GOLD | 1,043 | 2,859 | 1,212 |
| AEM | 858 | 1,581 | 1,026 |
Newmont Corp. produced gold and other metals from thirteen mines and its Nevada JV with Barrick Gold.
NEM Quarterly gold production per mine in 2Q22 (Fun Trading)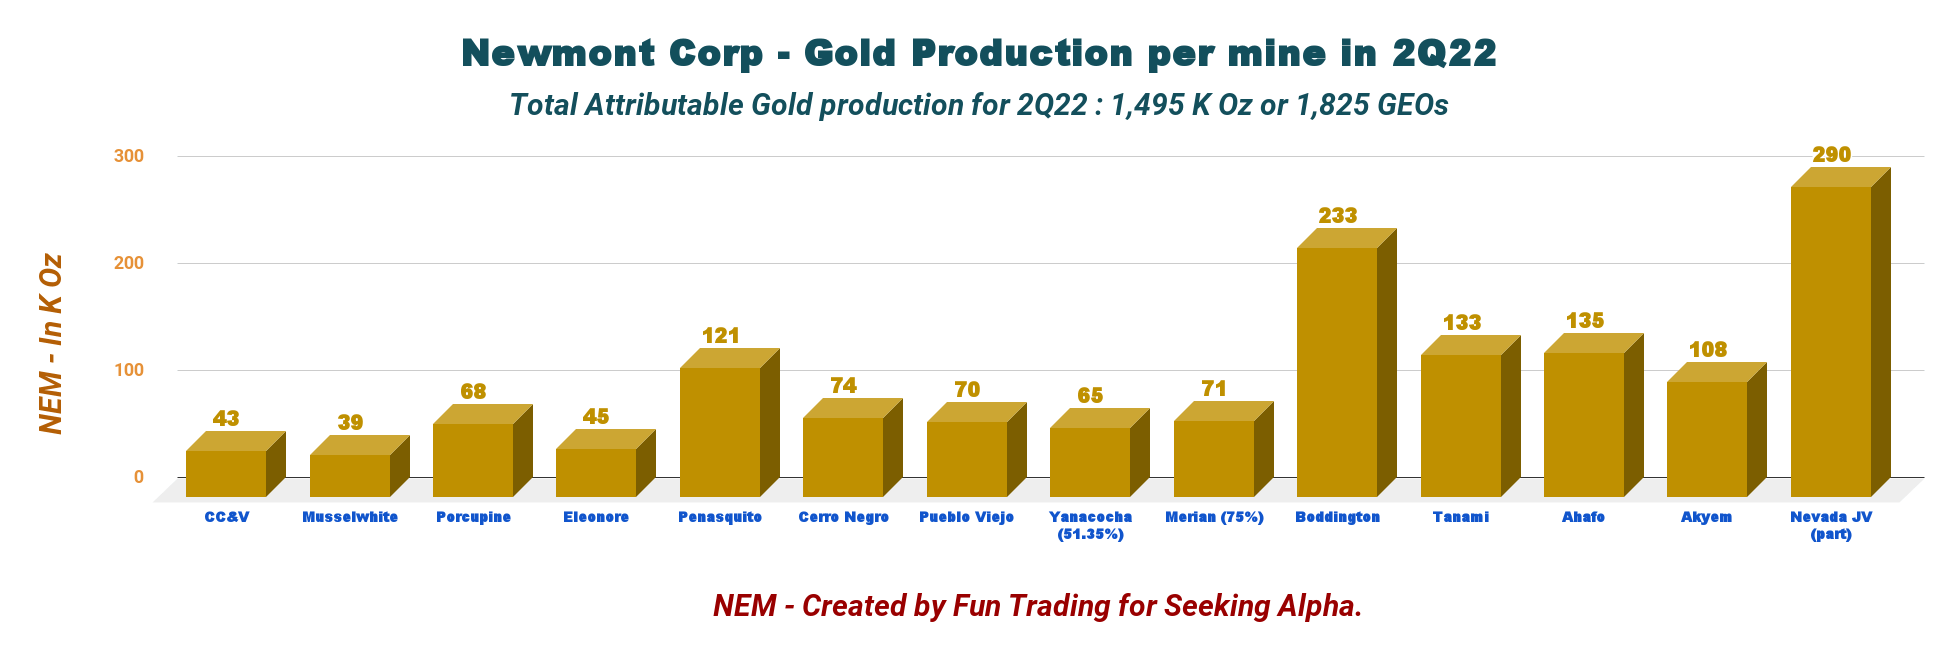
2 – Excellent Mineral Reserves Proven & Probable limit the long-term risk
On February 22, 2022, Newmont reported gold Mineral Reserves of 92.8 million attributable ounces for 2021 compared to the company’s 94.2 million ounces at the end of 2020. This compared to 69 million attributable ounces for Barrick Gold and 44.6 million for Agnico Eagle.
| Gold Production | Million Au Oz |
| NEM | 92.8 |
| GOLD | 69.0 |
| AEM (including Kirkland Lake) | 44.6 |
Note: Barrick Gold also indicates 12 MMlb in Copper from its three mines producing copper.
Newmont has over 88% of gold reserves in top-tier jurisdictions, with only 12% in Africa. Gold reserves life at operating sites is 10 years or more.
NEM Mineral reserves per region (Newmont Corporation)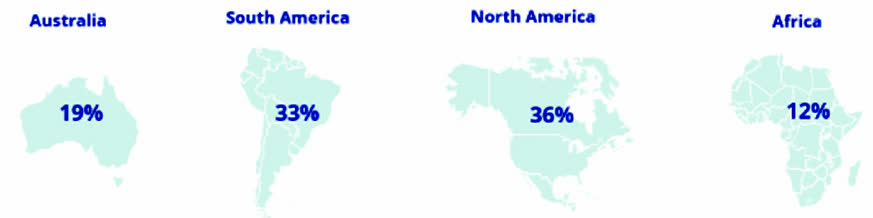
CEO Tom Palmer said in the conference call:
At Newmont, we have created a robust and diverse portfolio of operations, along with a pipeline of more than 20 organic projects with the scale and mine life to deliver strong long-term results. Newmont will produce more than 6 million ounces of gold each year and almost 2 million gold equivalent ounces from copper, silver lead and zinc. Combined, that is nearly 8 million gold equivalent ounces every year for at least the next decade, the most of any company in our industry.
3 – A compelling dividend of 5.33%, But…
Newmont Corp. is paying a quarterly dividend of $0.55 per share, representing a yield of 5.33% today.
| Gold Production | Yield % | Yearly Dividend per share | Stock Price |
| NEM | 5.33% | 2.20 | 41.25 |
| GOLD | 5.52% | 0.80* | 14.48 |
| AEM | 4.10% | 1.60 | 39.07 |
* Barrick Gold declared a $0.20 per share quarterly dividend in 2Q22. It includes a $0.10 per share performance component in line with its new dividend policy.
Note: I recommend reading my recent article on Barrick Gold, published on September 2, 2022, and my recent article on Agnico Eagle, published on September 3, 2022.
The critical thinking is to decide if this high-yield dividend can be sustainable in the bearish gold market environment we are experiencing now.
With gold down to $1,645 per ounce last Friday, I believe this generous dividend will be scaled down as free cash flow will probably shrink in the next few quarters.
The company is committed to returning 40%-60% of excess free cash flow, which will take a cut in 3Q22 and 4Q22. Furthermore, inflationary pressures are increasing CapEx and eroding even more free cash flow.
Free cash flow in 2Q22 was $524 million in 2Q22 but could be lower in 3Q22. The gold price realized was $1,836 per ounce in 2Q22 and will probably drop to $1,730 this coming quarter.
The gold price is down 6.4% on a one-year basis.
NEM: Gold and Silver prices 1 year (Fun Trading StockCharts)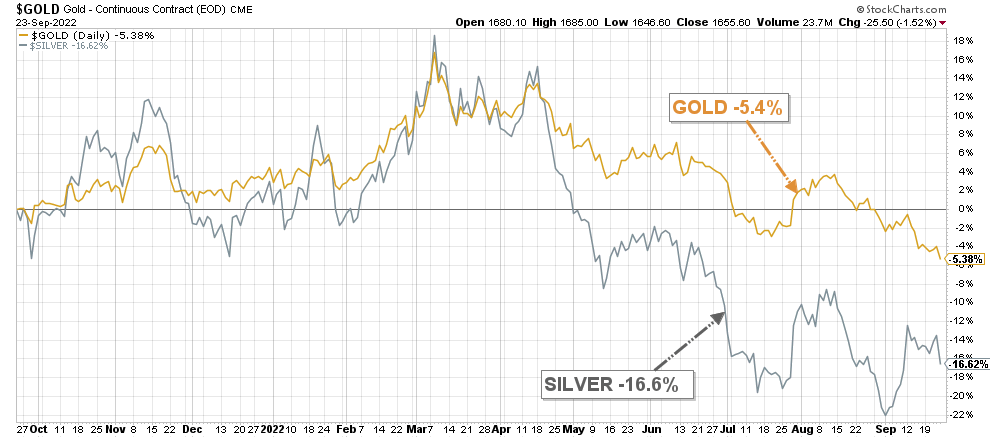
If we look at the recent company presentation, operating costs (labor costs, materials & consumables, and Fuel & Energy costs) have increased significantly.
NEM Inflationary pressures 2Q22 (Newmont Corp.)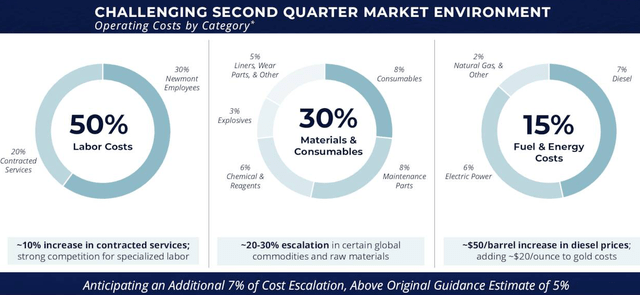
UBS analyst Cleveland Rueckert believes Newmont “can continue to pay an annual dividend of $2.20 per share.” Rueckert wrote:
[W]e are confident the dividend is based on a multi-year framework with visibility to falling Capex in 2025,
Despite now higher cost estimates, we continue to expect NEM will generate strong free cash flow supporting capex, dividends and possibly future buybacks,
I’m afraid I have to disagree with those comments, and I seriously doubt that NEM, GOLD, and AEM will be able to keep the dividend at this level in 4Q22.
We can expect a more reasonable dividend yield of about 3%-3.5%, which is still compelling.
Ultimately, the dividend will be determined by the free cash flow generated in 3Q22, estimated at $230 million. Below is the quarterly free cash flow history until 2Q22.
NEM Quarterly Free cash flow history (Fun Trading)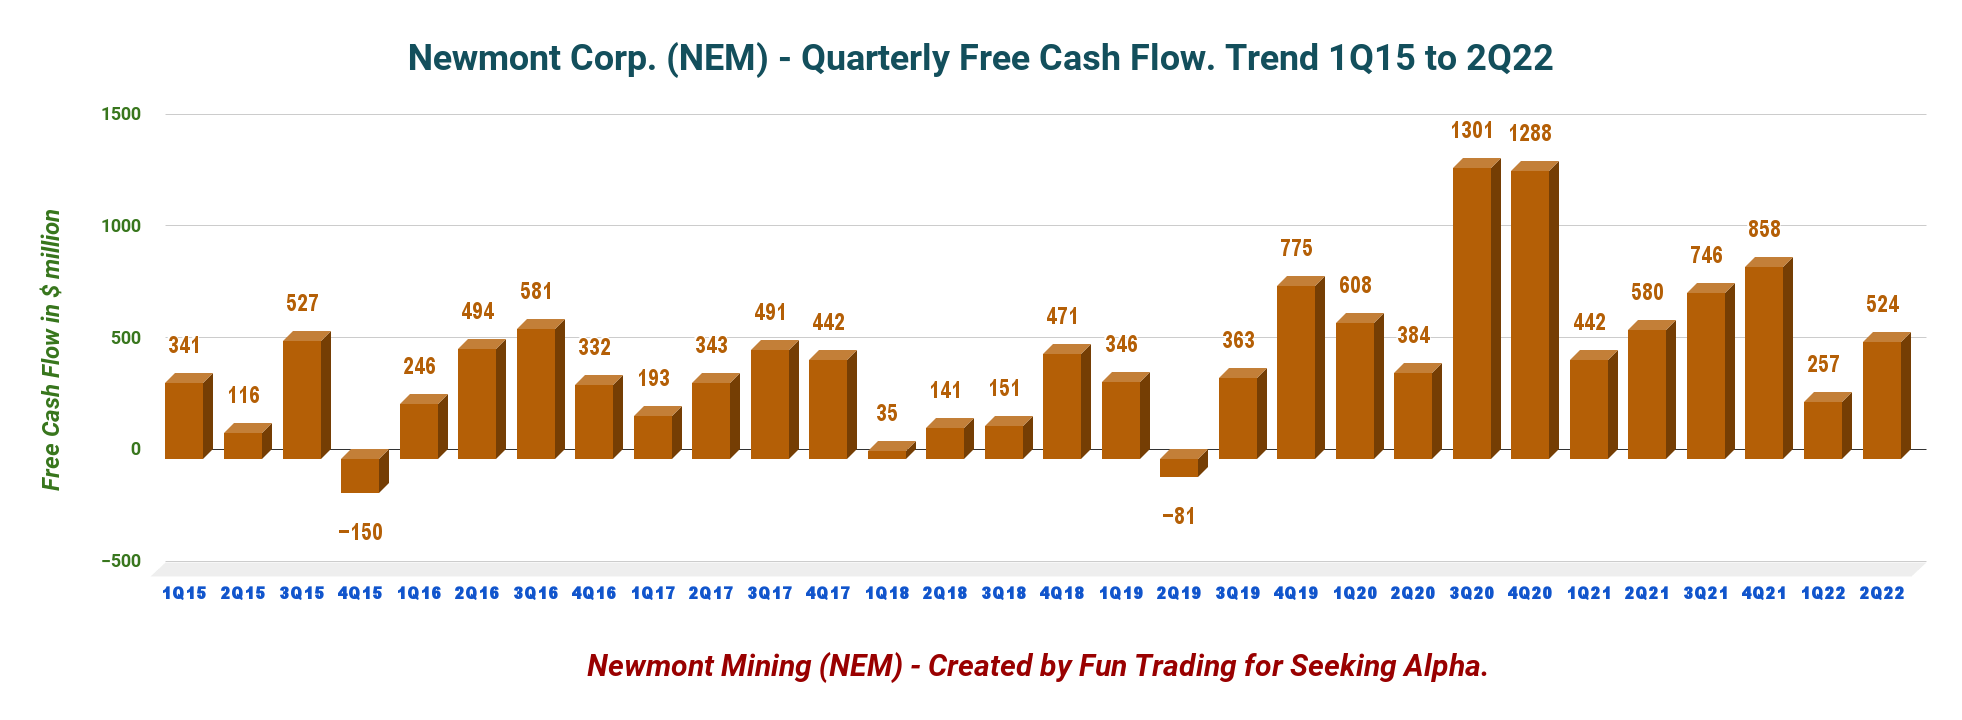
4 – Debt and liquidity at a good level
NEM Quarterly Cash versus debt history (Fun Trading)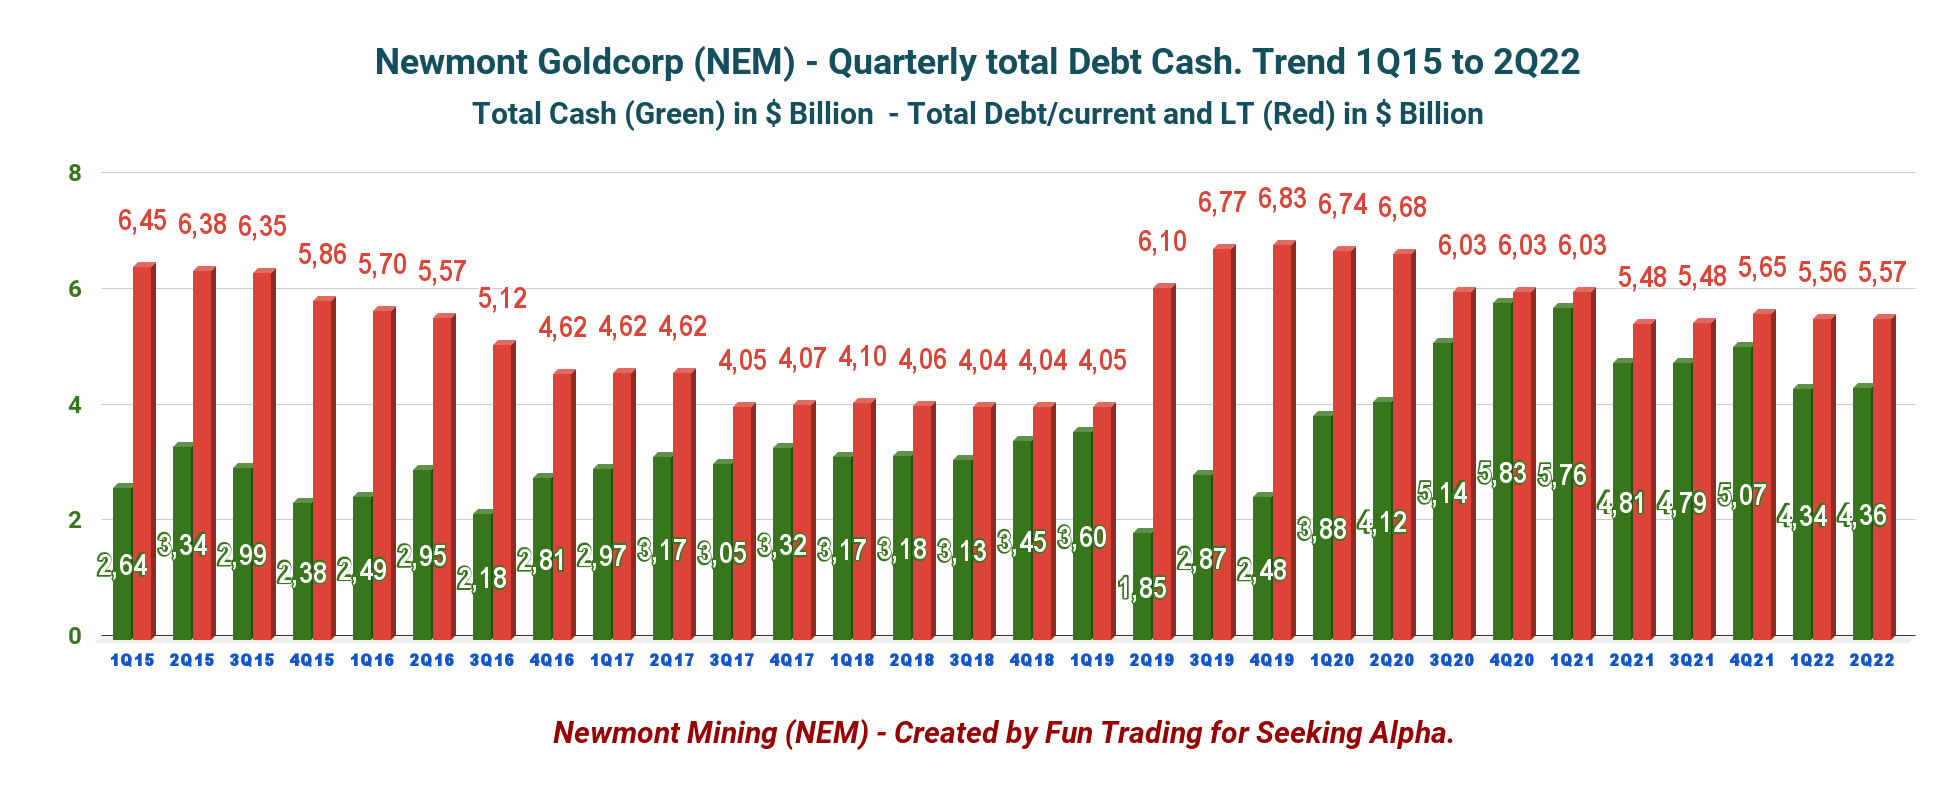
NEM had a net debt of $1.21 billion in 2Q22 with total cash of $4,358 million and Long-term debt of $5,568 million. The total liquidity was $7.3 billion at the end of June, with no debt due until 2029.
5 – Stock performance and TA analysis
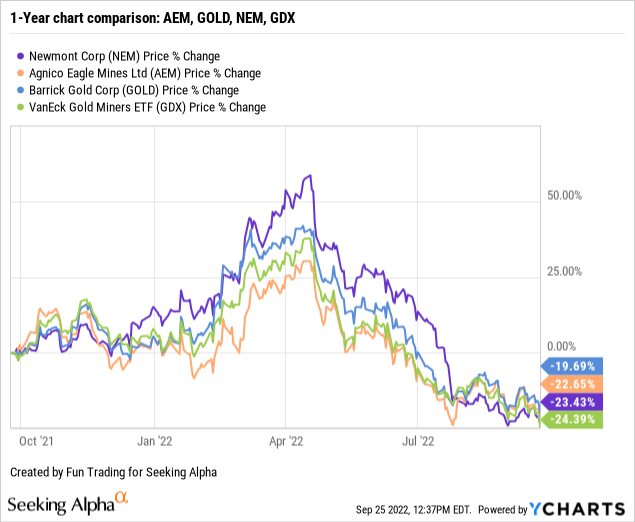
NEM stock performance has been abysmal since May 2022, when the FED started to hike interest rates to fight record inflation. NEM is slightly underperforming its peers and is down 23% on a one-year basis.
The contrasting effects of persistently high inflationary pressures and central banks raising interest rates have seriously degraded the gold market.
Moreover, the U.S. dollar has rallied due to slowing growth in China, the impact of the Russia-Ukraine war, and the growing prospect of a global recession.
The U.S. dollar has recently hit a 20-year high which exerts even more pressure on gold that tends to move in an inverse direction.
The gold price closed last Friday at $1,645 an ounce, and gold miners tumbled.
In this situation, it isn’t easy to be optimistic for 2022. However, the gold stocks have retraced significantly over the past few weeks and present an attractive valuation.
Conclusion: Buying NEM now makes sense, especially considering the company’s debt and liquidity and a decent level of dividend.
4.1 Technical Analysis
NEM TA Chart short-term (Fun Trading StockCharts)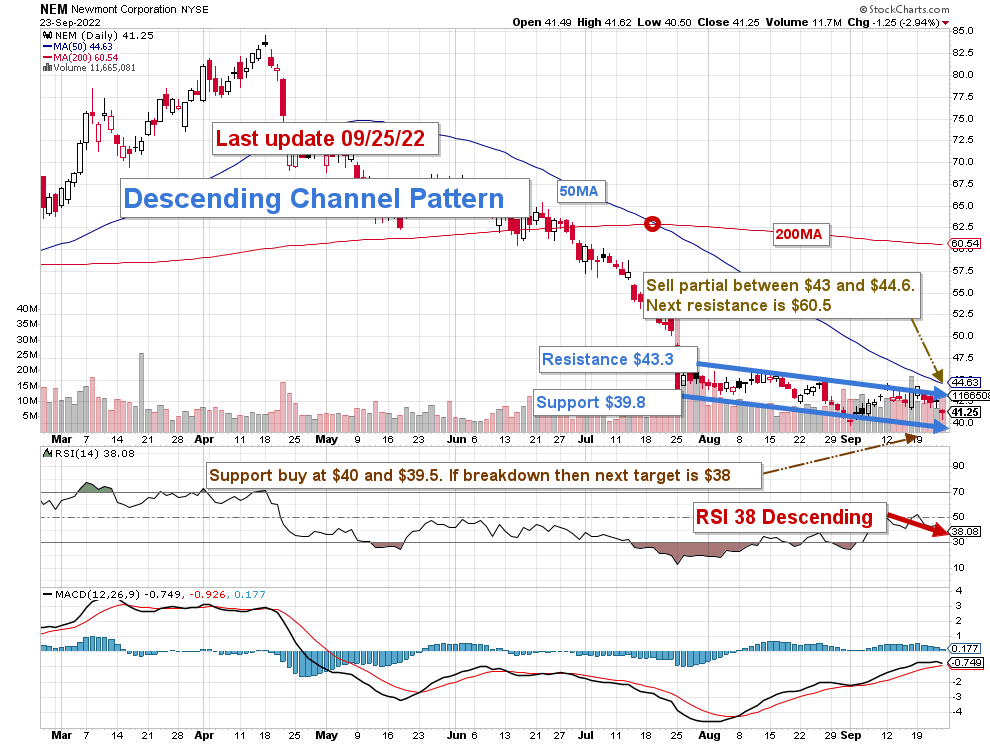
Note: The chart has been adjusted for dividends.
NEM forms a descending channel pattern with resistance at $43.3 and support at $39.8. A falling channel is considered bullish.
The short-term trading strategy is to trade LIFO about 25-30% of your position and keep a core long-term amount for a much higher payday. I suggest selling between $43 and $44.6 and waiting for a retracement below $40-$39.50 with potential lower support at $38.
If the gold price turns bullish, NEM could quickly recover and re-test $60.50.
Watch the gold price like a hawk.
Note: The LIFO method is prohibited under International Financial Reporting Standards (IFRS), though it is permitted in the United States by Generally Accepted Accounting Principles (GAAP). Therefore, only U.S. traders can apply this method. Those who cannot trade LIFO can use an alternative by setting two different accounts for the same stock, one for the long-term and one for short-term trading.
Warning: The TA chart must be updated frequently to be relevant. It is what I am doing in my stock tracker. The chart above has a possible validity of about a week. Remember, the TA chart is a tool only to help you adopt the right strategy. It is not a way to foresee the future. No one and nothing can.
Author’s note: If you find value in this article and would like to encourage such continued efforts, please click the “Like” button below to vote for support. Thanks.
Be the first to comment