

New Zealand Dollar, NZD, EUR/NZD, NZD/CAD, NZD/JPY – Talking Points
- EUR/NZD potentially eyeing fresh yearly low on break of bear flag
- NZD/CAD falls below trendline support, pair set to test key pivot zone
- NZD/JPY bull flag forming, price backtracking after robust melt higher
EUR/NZD Technical Analysis
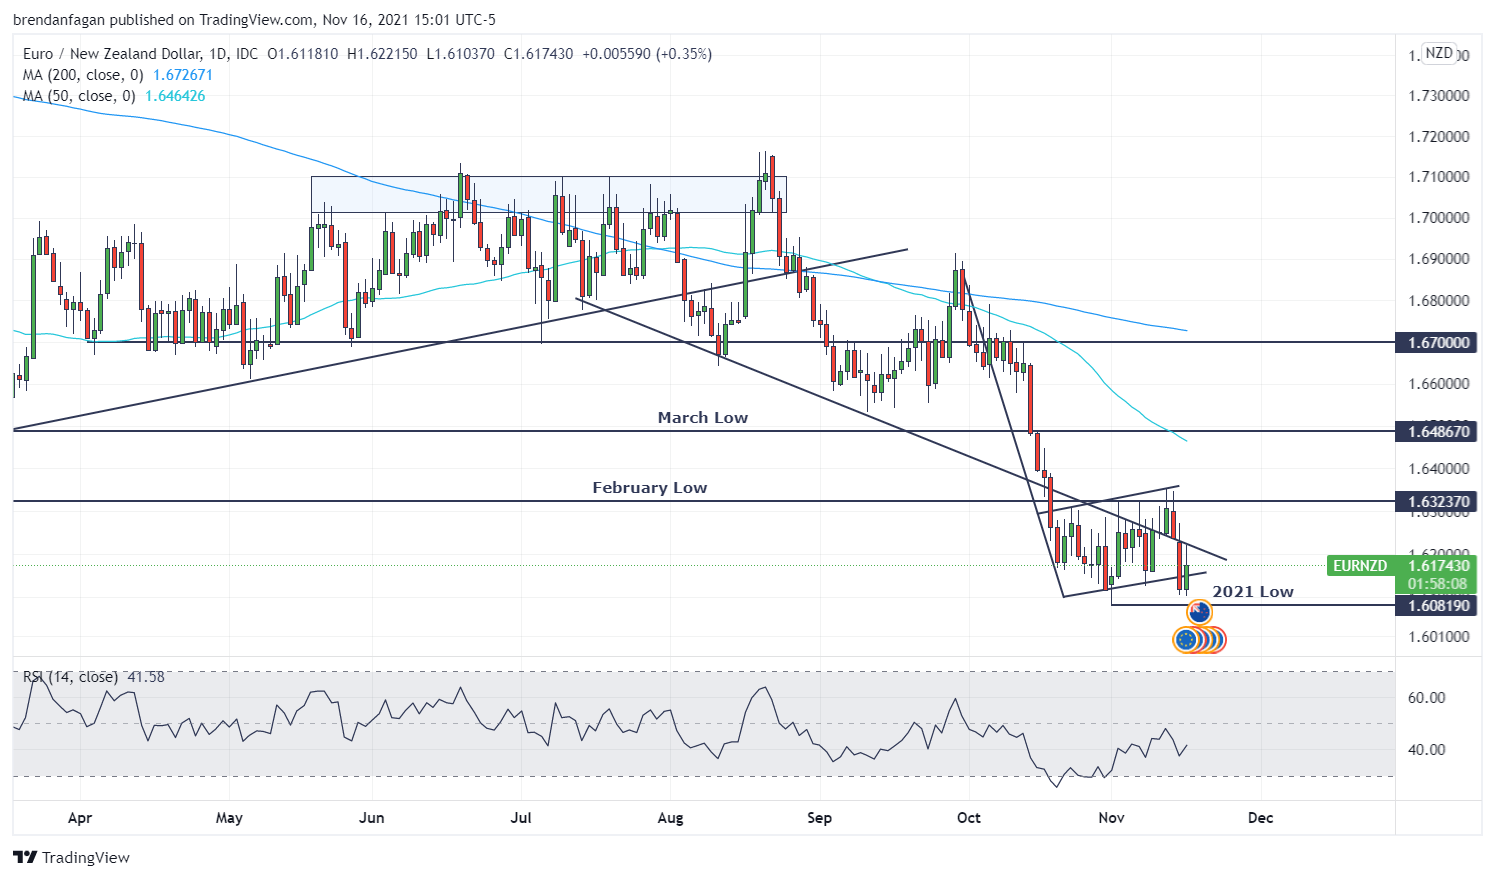
Kiwi strength saw EUR/NZD make fresh yearly lows to start the month, having sunk right through key trendline support. Since carving out a fresh bottom around 1.608, price has gyrated, allowing for the pair to recover from oversold territory on the relative strength index (RSI). The sideways price action has seen the formation of a bear flag, which may indicate that further weakness may be ahead. Candles in the flag have found stiff resistance in the form of the February low at 1.6323. Should price bounce and not make a fresh 2021 low, a retest of the February or even March lows could be on the cards.
EUR/NZD Daily Chart
Chart created with TradingView
NZD/CAD Technical Analysis
NZD/CAD has struggled for direction of late, with the pair gyrating around both sides of 0.8850. With a Death Cross formation potentially imminent, as the 50-day and 200 day moving averages converge, market participants may look for this Kiwi cross to explore lower prices. Declining relative strength adds to the notion that bullish sentiment remains weak. Downside targets may be found in the 0.5 Fib retracement level at 0.8675, or further below at 0.8600. Should price reverse its current course, a break through the 50 and 200-day moving averages may be preliminary targets for market participants.
NZD/CAD Daily Chart
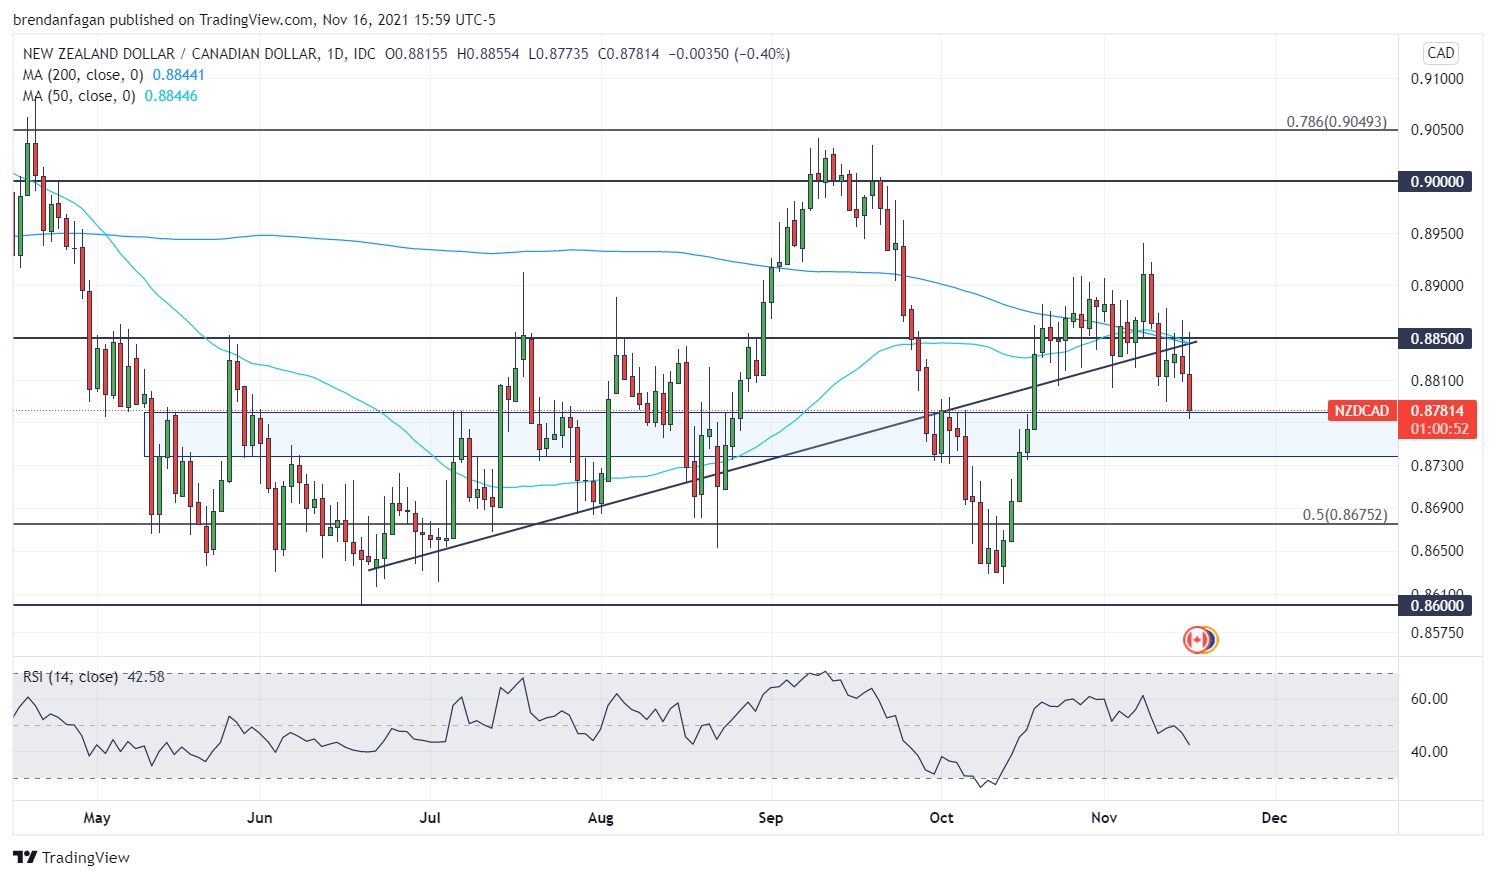
Chart created with TradingView
NZD/JPY Technical Analysis
NZD/JPY price action has seen the formation of a bull flag, following a sharp move higher in October. For much of the last few months, price has gyrated between 76.00 and 79.00, with the aforementioned leg higher in October finally breaking the pair out of its range. A cooldown in price has seen price gravitate back towards the 1.0 Fibonacci retracement level at 80.182. A break higher and confirmation of the bull flag formation could see the cross run out to fresh yearly highs above 82.50. Should price breakdown and explore lower prices, a test of the 50-day moving average may be on the cards around 79.25.
NZD/JPY Daily Chart
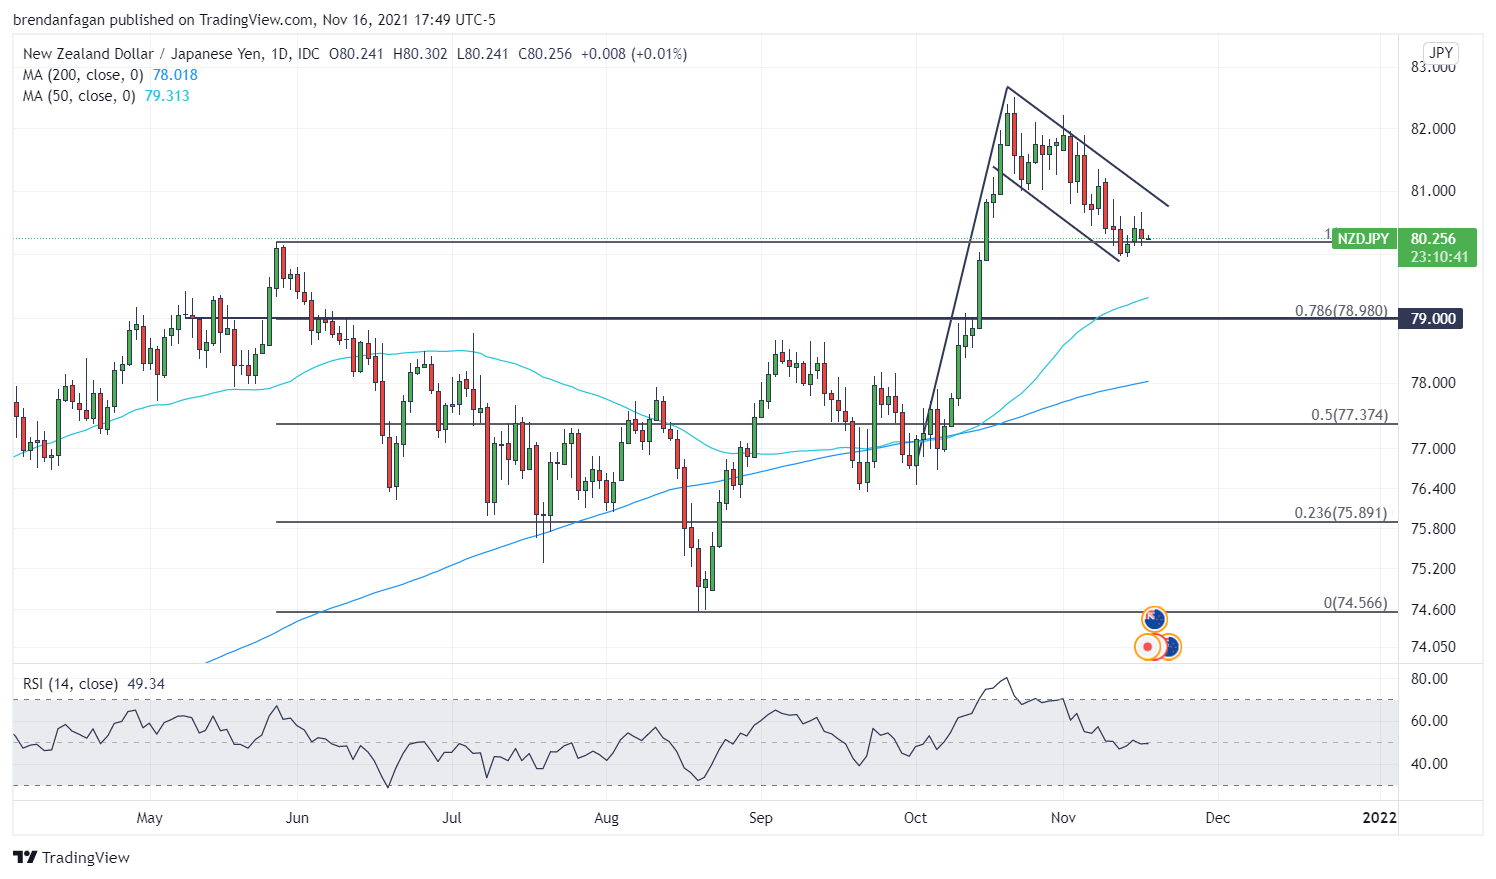
Chart created with TradingView
Resources for Forex Traders
Whether you are a new or experienced trader, we have several resources available to help you; indicator for tracking trader sentiment, quarterly trading forecasts, analytical and educational webinars held daily, trading guides to help you improve trading performance, and one specifically for those who are new to forex.
— Written by Brendan Fagan, Intern
To contact Brendan, use the comments section below or @BrendanFaganFX on Twitter
Be the first to comment