


imaginima/E+ via Getty Images
Investment summary
There remains many selective opportunities to extract true alpha within the healthcare universe. Here at HB Insights we cover the healthcare sector very well and continue to recognize the opportunity for those looking to shift up in the quality spectrum and add a layer of resiliency to equity portfolios looking ahead.
Here I turn to National Research Corporation (NASDAQ:NRC) and demonstrate the company has the fundamental criteria to reverse a 2-year period of downside, where shares have been compressed to substantial lows since before the pandemic. NRC’s return on its ongoing and existing investments in addition to a resilient earnings profile are attractive features, alongside recent contract activity in its operations. Net-net, I rate NRC a buy for contrarians seeking exposure to quality in the space on a price target of $64. Note, I do not discuss NRC’s dividend in this report.
Novant – first contract for Human Understanding Program
One key takeout from the last quarter for NRC, was that it secured the first contract for its Human Understanding Program (“HUP”) with Novant Health. Novant is an integrated network of health systems spanning 4 states and is the owner of 15 medical centres and 600 clinics in these jurisdictions. It has been a long-time customer of NRC and this would have had a bearing on the company’s decision to sign the contract by estimate. No financials were discussed on a “client-by-client basis” on the Q2 earnings call, however, management noted Novant has purchased additional products from NRC’s portfolio that it hadn’t been previously.
The particulars aren’t entirely clear as of yet but language on the earnings call explains that the HUP provides unique patient data and analytics that can be accessed by primary care givers at the point of care delivery. This is a value-add for Novant and another revenue stream for NRC, that sees the existing client expand its purchasing volume, and also sweep up the remainder of NRC’s product line with the HUP embedded into the offering.
When asked about any other key differentials for Novant to adopt the HUP, CEO Michael Hays said:
“The readiness of that organization in adopting new things is pretty traditional, so that didn’t necessarily surprise us. I think the tipping point at Novant quite frankly and the other ones that are unfolding is that the mission of most healthcare organization is to treat each patient as a unique person and personalize the care that is being delivered.
And Novant, as long as other healthcare systems have always professed that that’s the reason and the underlying driver of their mission, but they’ve never really been able to perform that at scale. And Novant’s Board is very focused on treating each person is unique. So we fit in clearly with the driver of their mission and this helped enable it. That no doubt had impact in consolidating or condensing the decision cycle. So long way to say it was a happy customer that wanted to purchase more to drive the purpose of their business.”
We’ve been keeping a close eye on any movement on this segment and I’ll be looking very closely at the numbers for this new venture.
NRC Q2 earnings pile supportive of further upside capture
The company came in with a mixed set of numbers in Q2 FY22 with equally mixed results vertically throughout the P&L. Overall revenue came in ~240bps higher YoY to $37.9 million (“mm”), whereas total recurring contract value (“TRCV”) came into $147.7mm, a ~100bps decrease over the year, however the TRCV growth rate was c.300bps ahead of Q1 FY22. The downside in TRCV was attributed to the company’s strategy to shift the revenue mix towards digital core solutions and discontinuing various non-core segments.
Meanwhile, OPEX widened by 665bps YoY to ~$25.8mm reducing operating income by a similar amount to $11.5mm. This is despite non-cash expenditures decreasing across the period, and a slight loss of leverage at the SG&A line.
As seen in Exhibit 1, NRC’s quarterly cash flow and free cash flow (“FCF”) trends have remained in cyclical fashion from FY15 to date. The company converted $8.5mm of FCF from the quarter, ~$2.5mm net of dividends, whereas TTM FCF yields have remained steady at ~300bps on a sequential basis, as observed. These are attractive numbers in my estimation, and serve NRC well in terms of fundamental momentum when looking ahead. Definitely a bullish point of consideration.
Exhibit 1. Sequential FCF trends have remained in situ with steady aggregate growth across the FY15′-Q2 FY22′ period.
- Whilst absolute FCF and FCF yields are pulling back to range this is accompanied by stellar return on investment [discussed below].
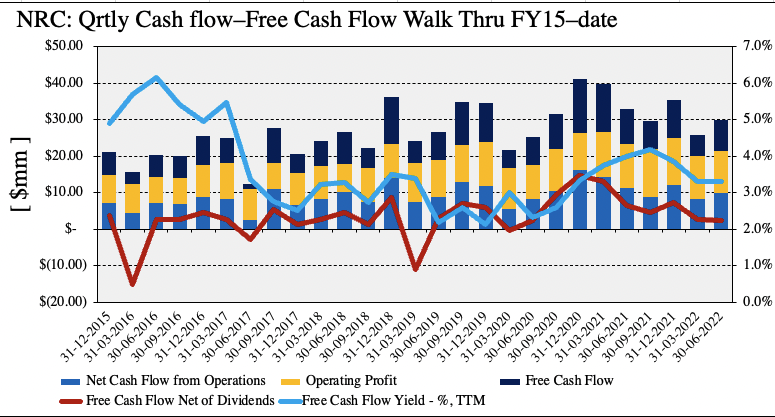
Note: All figures in $mm or [%]. Free cash flow calculated as [NOPAT – investments]. FCF net of dividends the same less dividend payout. FCF yield calculated as a function of enterprise value on a TTM basis. (Image: HB Insights. Data: HB Insights, NRC SEC filings)
Return on investment a major standout
Certainly a key feature in the NRC investment debate is the company’s ongoing return on its invested capital (“ROIC”). Here I wanted to see how much net operating profit after tax (“NOPAT”) the company generated from the previous period’s invested capital. As seen in Exhibit 2, whilst ongoing invested capital has stretched up from FY18 lows, quarterly ROIC has pulled back to FY18 ranges. Note, however, this is still a large print on absolute terms, with Q2 FY22 ROIC pulling in to 6.9% – in-line with the same time last year. These trends are consistent with TTM recordings too, with the company realizing a 37.4% TTM return on its invested capital, as seen below.
Exhibit 2. Return on investment trends continue to remain favourable for NRC.
- TTM ROIC comfortably outpaces the WACC hurdle of 7.75% by 4.8 turns
- These trends easily offset any decline in FCF and FCF yields as noted in the section above
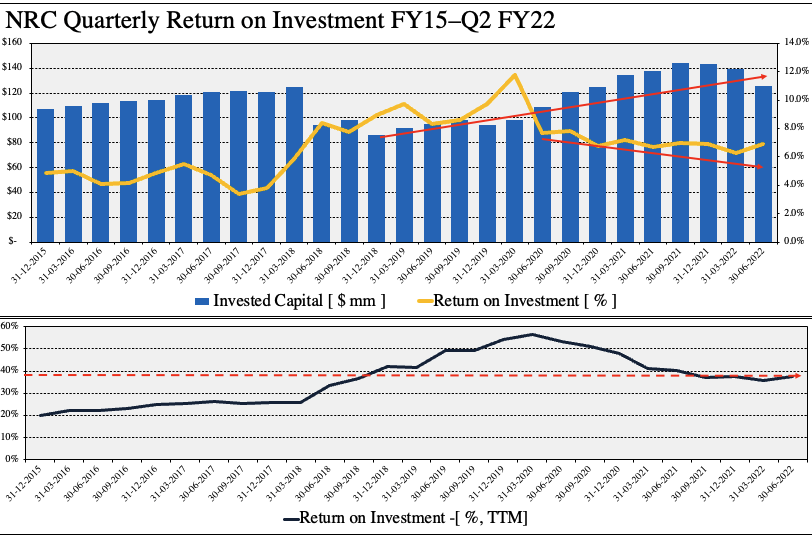
Note: All figures in $mm or [%]. Return on invested capital a function of NOPAT and invested capital. All figures are calculated with GAAP earnings with no reconciliations. (Image: HB Insights. Data: HB Insights, NRC SEC Filings)
In addition, the pullback in the NRC share price has resulted in an asymmetrical value proposition. As seen in the chart below, in buying NRC, we are receiving FY22 levels of TTM ROIC at FY18′ market capitalization. With the latest curl up of ROIC trends this could serve as a solid bedrock for a NRC’s market cap to re-rate to the upside.
Exhibit 3. FY22 return on invested capital at FY18 market capitalization for NRC.
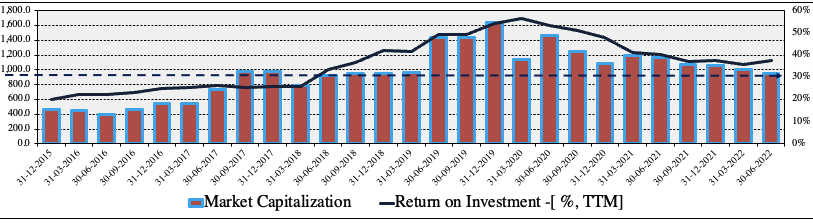
Image: HB Insights. Data: HB Insights, Refinitiv Datastream
Finally, I’ve examined NRC’s ongoing investment/ROIC trends, however, as observed below, the company’s existing capital/asset base is still generating substantial returns. TTM asset turnover suggests the company generates $1.05 for every $1 invested into its asset base whilst TTM return on assets came into 25.1% last quarter. This indicates to me that NRC is a long-term cash compounder that could justify a premium to valuation.
Exhibit 4. Trailing investments/asset base also generating substantial double-digit returns for NRC.
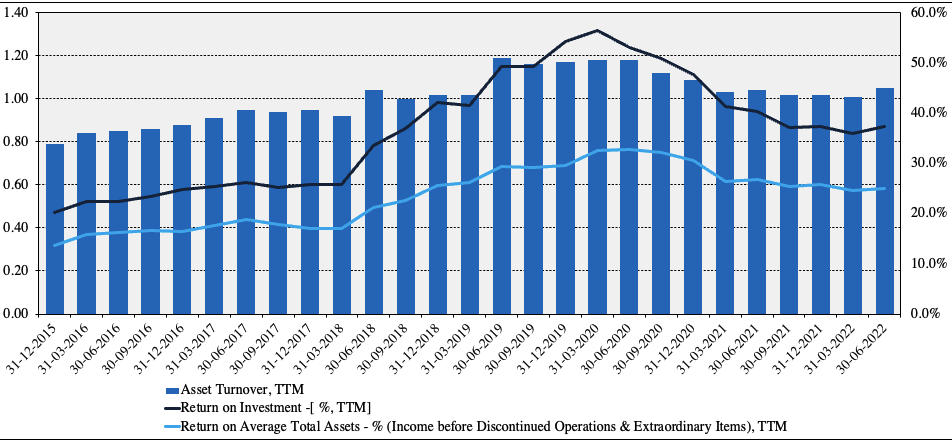
Note: All figures as absolute number of in [%]. (Data: HB Insights,NRC SEC Filings)
Technical factors for consideration
One key risk in the investment debate is the price action seen on the chart over the past 2-years to date. As seen the chart below, the stock is currently testing the inner resistance line of a long-term downtrend that’s continued since the onset of the pandemic in FY20. Price distribution remains tilted bearish, although, the stock has set a series of higher-highs in the past 1–2 months.
Exhibit 5. NRC 3-year price distribution and down-trends
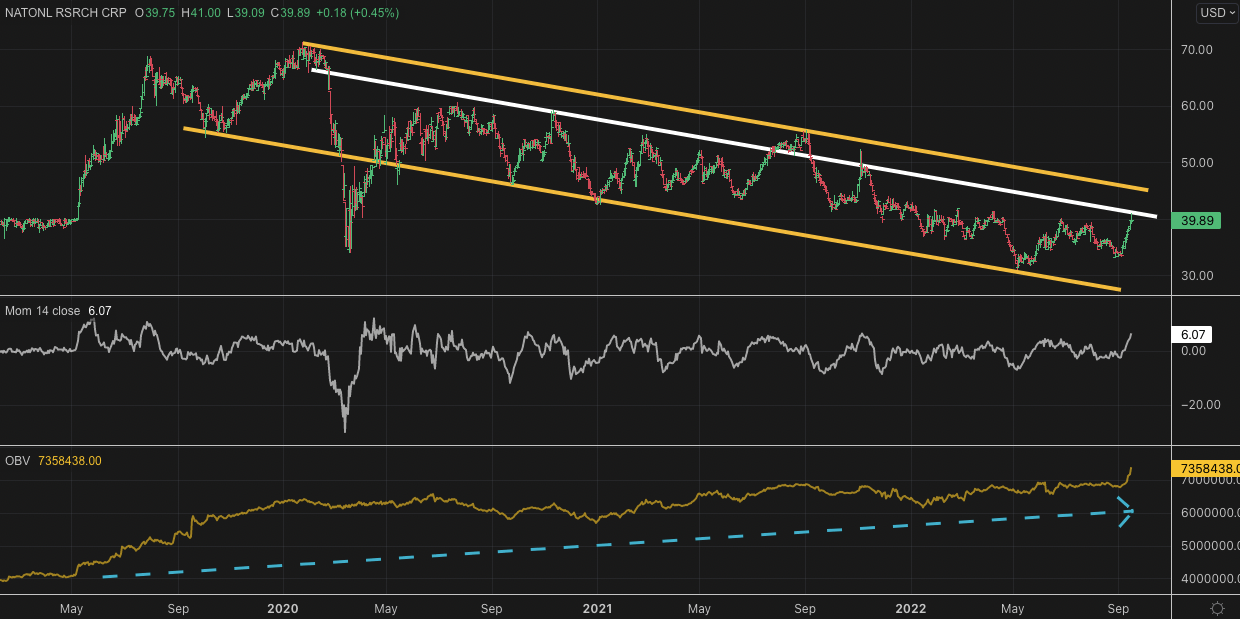
Data: Refinitiv Eikon
However, as seen in the bottom frame in Exhibit 5, and the chart below, on balance volume (“OBV”) has remained heavy and ticked upwards whilst the NRC share price has in fact broken out above the inner resistance line seen above. With the recent resurgence in OBV and price action this serves as good data to suggest we could be seeing a re-rating to the upside.
Exhibit 6. NRC 9-month price distribution shows more bullish near-term trend patterns
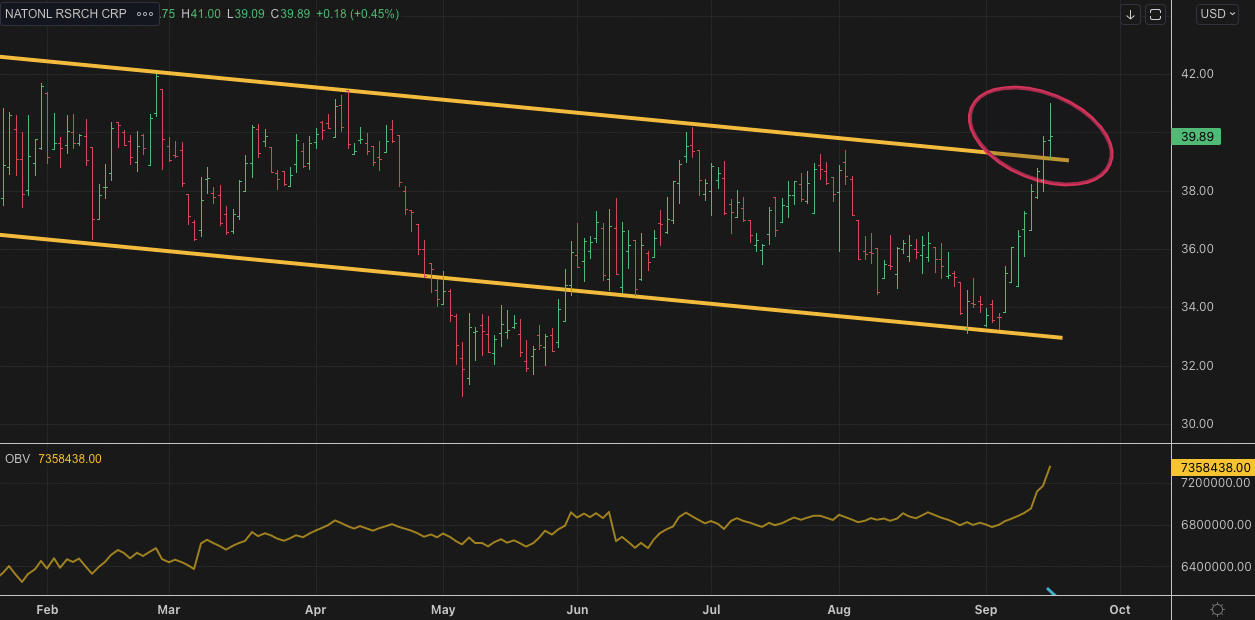
Data: Refinitiv Eikon
Valuation and conclusion
Shares look to be trading at a discount to shares on trailing P/E, however are richly priced vs. the GICS Industry peer group on book value and sales multiples. Other factors that must be factored into consideration are the 2.4% dividend yield at time of writing, and the company’s return on equity (“ROE”) that sits in the 99th percentile of the peer group.
However, I’d just note that 50.07% is NRC’s TTM ROE, and not ours as investors. Factoring in that we’re paying nearly 11.6x the company’s total book value, our ROE as investors is just 4.3% at this multiple. Shares are also priced at a normalized P/FCF of 52x, and prescribing this to TTM FCF of ~$329mm sets a price target of $64, roughly 60% upside on the current share price.
Exhibit 7. Multiples and comps
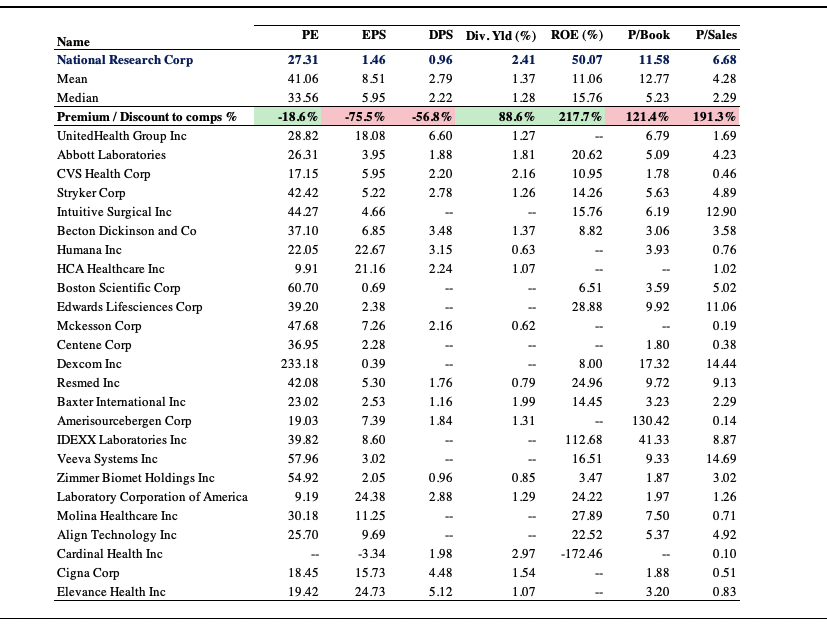
Data: HB Insights, Refinitiv Datastream
The culmination of these points illustrate that NRC is currently a buy in my estimation. We have debated at lengths on how to position in the name and from our discussions firmly believe NRC warrants inclusion into the equity risk bucket as a contrarian play for those investors looking to shift up in the quality spectrum and position against long-term cash compounders. Whilst shares have had a difficult time breaking the long-term downtrend, I believe there’s an alpha opportunity in the coming 12 months as the market looks to continue rewarding bottom-line fundamentals instead of top-line growth.
Be the first to comment