

US Tech 100 -Talking Points:
- Weak US consumer confidence and retail sales data halt ‘tech heavy’ Nasdaq gains
- US Tech 100 continues consolidation, landscape remains bullish
Disappointing Consumer Data Dampens The Nasdaq Index
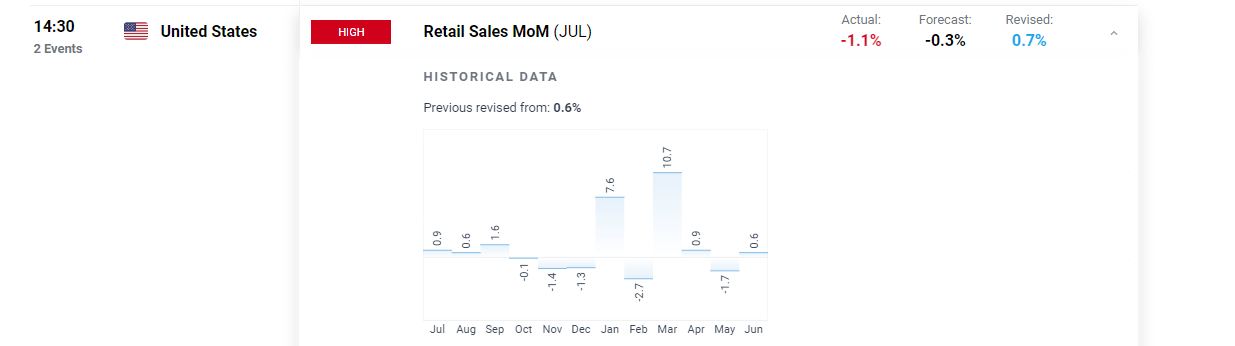
Disappointing retail sales data came in at -1.1% month on month after a decline of only 0.3% was forecasted. The decline was largely attributed to the automotive sector as this has the greatest weighting in the composition of the data. Adding to the data woes, e-commerce witnessed a decline as in person sales at restaurants and other stores saw a relative increase.
Retail Sales Data:
For all market-moving data releases and events see the DailyFX Economic Calendar
Furthermore, Last Friday we saw the preliminary data for the Michigan Consumer Sentiment survey come in at 70.2 which was well below the previous and forecast figure of 81.2. The survey attempts to gain insight into consumers’ perceptions of their own financial stability and the prospects of the economy over the short and long-term so the lower figure lends itself to the slow down in the tech heavy Nasdaq.
Key Technical levels – US Tech 100
The US Tech 100 recently ended a rather impressive and extended bullish move (the grey ascending channel) and now continues to trade sideways as signs of exhaustion appear.
The 76.4% Fib extension of the March 2020 to September 2020 move has provided a robust level of resistance, capping gains and resulting in a three week period of consolidation around the 15,000 psychological level.
The majority of price action over the last three weeks has been contained between the 14,900 and 15,177 markers. 15,000 represents the nearest level of support but if selling continues into the rest of the session the 14,900 mark becomes the next level of support. Signs of fatigue are showing up in price action as we fail to make new highs but also in the declining prints of the MACD and RSI indicators.
With that being said, short term corrections around the 15,000 level can be expected but do not discount the potential for a deeper correction or a resumption of the longer-term bullish trend.
US Tech 100 Daily Chart
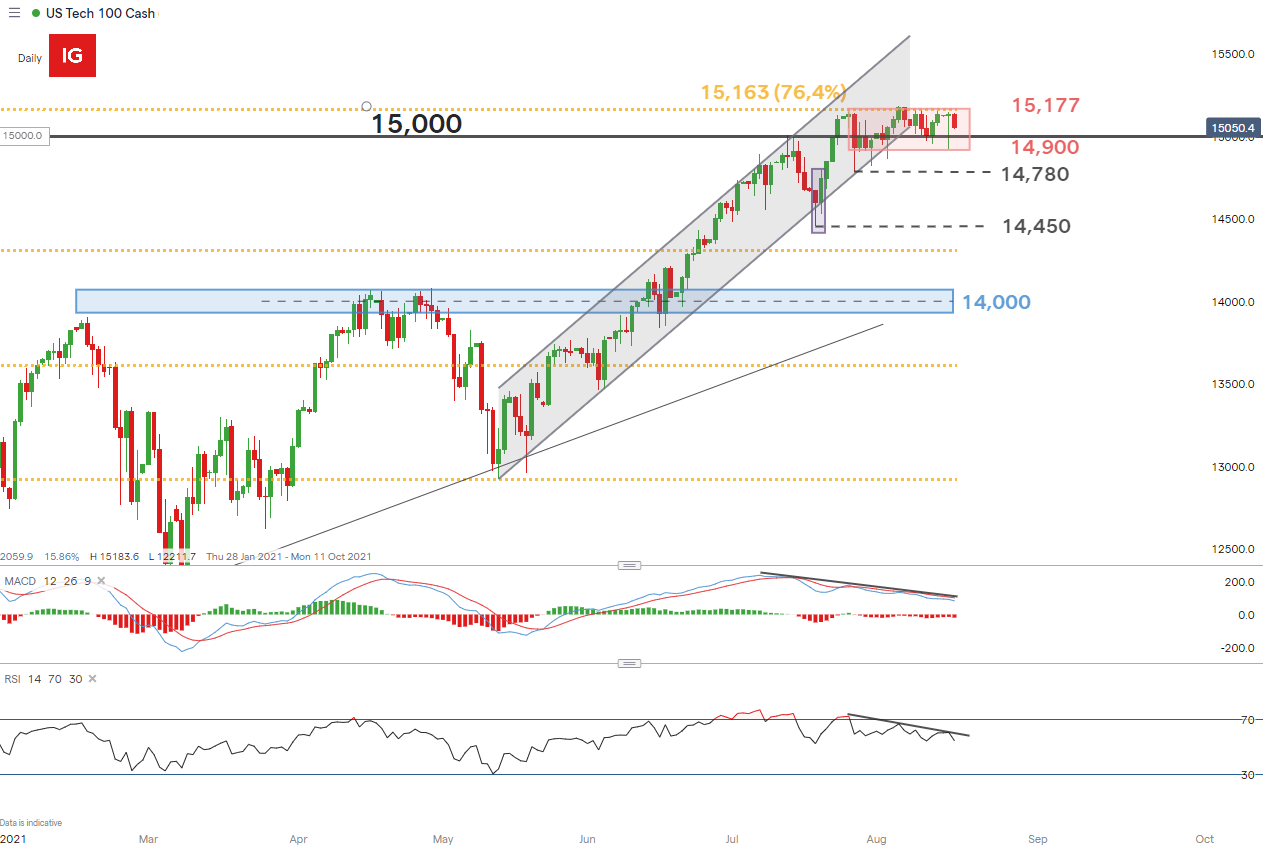
Chart prepared by Richard Snow, IG
The recent dip in consumer confidence and US retail sales data currently weighs on the record breaking index, however, the landscape still remains accommodative as runaway inflation looks to have been reigned in – aligning itself with the Fed’s narrative that inflationary pressures are merely ‘transitory’.
This suggests that the Fed may hold its stance on monetary policy later this month at the Jackson Hole Economic Symposium, maintaining its current QE program and talking down the possibility of raising interest rates ahead of the anticipated time.
Reuters Poll, U.S. Economy and Federal Reserve’s Policy Outlook
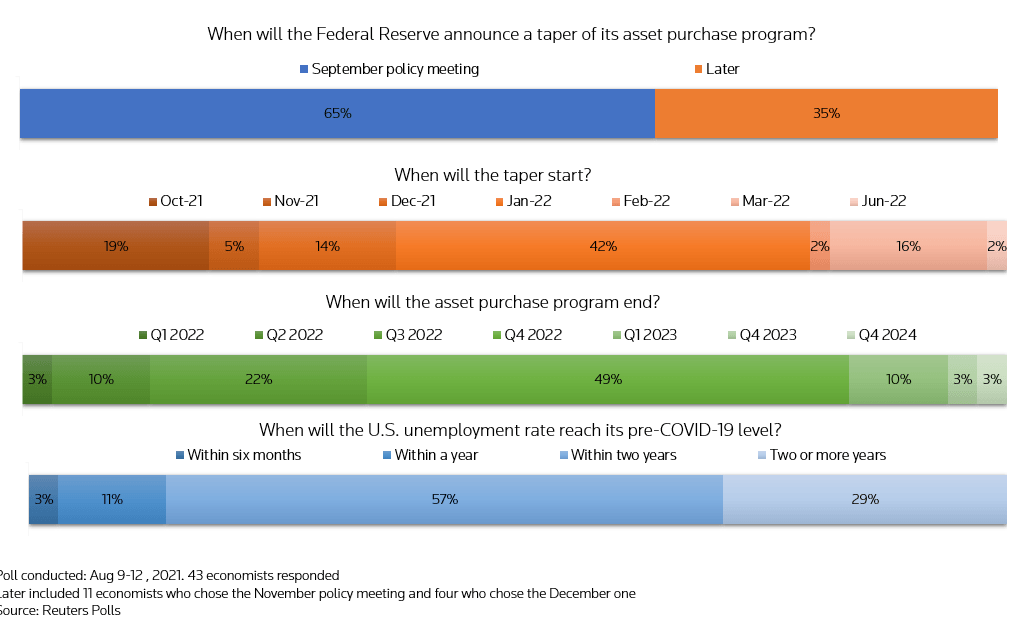
Source: Reuters Polls
— Written by Richard Snow for DailyFX.com
Contact and follow Richard on Twitter: @RichardSnowFX
Be the first to comment