

Lemon_tm
Market Recap
And the stock market roller coaster continues this year with a strong rally in October as the market attempts to trim some losses before the year comes to an end. The SPDR S&P 500 Trust ETF (SPY) gained 8.13% last month, Vanguard’s High Yield Dividend ETF (VYM) gained a more impressive 12.23%, and my watchlist only managed a gain of 5.28%. Year-to-date, through October, SPY is down 17.73%, my watchlist is down 14.38% and VYM is down 2.93%. While VYM is not known to outperform SPY, the fund is enjoying a spell of better than average results against the broad market.
Comparing the combined returns for my monthly watchlist against VYM and SPY can be a little misleading. My watchlists are meant to showcase the best quality and value opportunities offering attractive dividend yields during each month. The true results of these selections can be better evaluated in a long term buy and hold strategy.
While it’s never fun to watch your investments decline in value if you are a long-term investor, these are mostly paper losses. A sharp decline in a quality high yield stock should be viewed as an opportunity to dollar cost average into the position.
The main purpose of a high dividend yield portfolio is not to outperform the broad market but to generate a passive income stream that is relatively safe, reliable, and one that can grow in the future. The top 10 stocks on my watchlist for November 2022, collectively, offer a 3.78% dividend yield that is more than double the dividend yield of the S&P 500. It is also significantly better than the dividend yield of VYM that hovers around 3%. These 10 stocks have also grown their dividends at a historical rate of 21.1% per year during the last five years. Collectively, all 10 stocks appear to be potentially about 47% undervalued right now based on dividend yield theory.
The best way to create a strong high yield dividend portfolio is with a buy-and-hold strategy. This strategy forces you to think about the stocks you decide to invest your capital into as the plan is to hold the positions indefinitely. Applying this approach over the long term while focusing on potentially undervalued stocks, allows investors to generate alpha through capital appreciation. While this may not pan out for every position, diversifying your high-yield portfolio across 20 or more unique stocks will increase the odds of picking up shares of certain stocks when they are trading for bargain prices. The beauty of a long-term outlook is time; you can sit back and wait for the valuation to revert to historical norms, all the while collecting a generous passive income stream.
Watchlist Criteria
Creating the high yield watchlist, I had four areas of interest that I focused on: basic criteria, safety, quality, and stability. First off, the basic criterion aims to narrow down the list of stocks to those that pay a dividend, offer a yield above 2.75%, and trade on the NYSE and NASDAQ. The next set of criteria focuses on safety because that is a crucial part of a high yield investing strategy. The filter excludes companies with payout ratios above 100% and companies with negative 5-year dividend growth rates. Another level of safety can be associated with larger companies; therefore, the watchlist narrows in on stocks with a market cap of at least $10 billion. The next set of criteria set out to narrow down the list to include higher quality businesses.
The three filters for quality are: a wide or narrow Morningstar moat, a standard or exemplary Morningstar stewardship, and an S&P quality rating of B+ or higher. A Morningstar moat rating represents the company’s sustainable competitive advantage, the main difference between a wide and narrow moat is the duration that Morningstar expects that advantage to last. Companies with a wide moat are expected to maintain their advantage for the next 20 years, whereas companies with a narrow moat are expected to maintain their advantage for the next 10 years. The Morningstar stewardship evaluates the management team of a company with respect to shareholders’ capital.
The S&P quality rating evaluates a company’s earnings and dividend history. A rating of B+ or higher is associated with above-average businesses. The last set of criteria focuses on the stability of a company’s top-line and bottom-line growth. The filter eliminates companies with negative 5-year revenue or earnings per share growth rate. I believe a company that is growing both their top-line and bottom-line has the ability to provide growth to its investors in the future.
All of the stocks that pass the initial screener criteria (38 this month) are then ranked based on quality and valuation. Further, I sort the stocks in descending order based on the best combination of quality and value and select the top 10 stocks that are forecasted to have at least a 12% annual long-term return.
November 2022 Watchlist
Here is the watchlist for November 2022. There are three changes from the prior month: BlackRock (BLK), Blackstone (BX) and Comcast (CMCSA) drop off and are replaced by Advance Auto Parts (AAP), Texas Instruments (TXN) and Truist Financial (TFC). The data shown in the image below is as of 10/31/22.
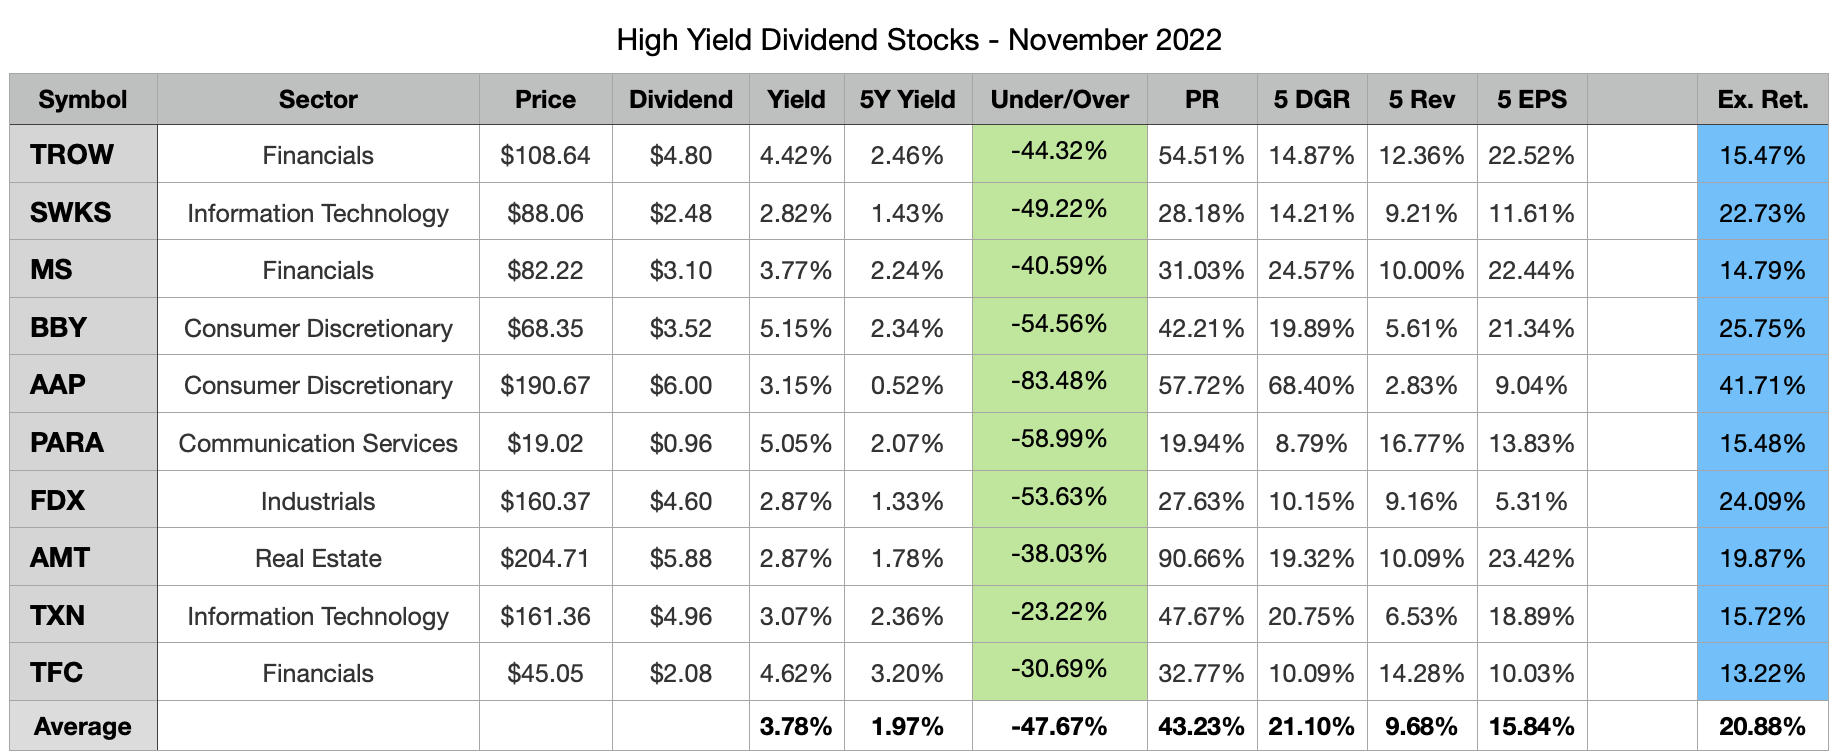
Created by Author
All 10 selected stocks this month appear to be potentially undervalued based on dividend yield theory.
The expected rate of return shown in the last column is computed by taking the current dividend yield plus a return to fair value over the next 5 years and a discounted long-term earnings forecast.
Please keep in mind that my return forecasts are based on assumptions and should be viewed as such. I am not expecting that these 10 companies will hit the forecasted returns. What I do expect is that these 10 companies have the potential to offer better returns during the next 5 years compared to the 28 high yield stocks that passed my initial filters but ranked worse on quality and valuation.
Past Performance
The October watchlist did not perform well against the benchmarks I track, collectively gaining only 5.28% last month. This was 6.95% worse than VYM and 2.85% worse than SPY. However, on a year-to-date basis the watchlist remains ahead of SPY but continues to trail VYM. As a result the annualized underperformance to VYM widens from minus 3.36% following September to 7.04% after October.
The watchlist also gave up a lot of its previously earned alpha to SPY, the outperformance shrinks from +3.38% to +1.85%. I do not expect that this watchlist will beat VYM or SPY every month. However, I believe that a buy-and-hold investing approach leveraging the stocks presented on this watchlist will generate long-term alpha compared to the broad market. I also have a personal target rate of return of 12% that I believe will be attained by this watchlist when measured over long periods of time.
Following October, the long-term annualized rate of return for the watchlist moves back ahead of 12% (12.21%). The 2 years of history I have measured thus far is a long period of time but I would really like to have 5 or 10 years of results before I start passing more judgment.
|
Date |
Watchlist |
ALL |
VYM |
SPY |
|
6 month |
-9.60% |
-3.50% |
0.61% |
-5.46% |
|
3 month |
-10.41% |
-4.21% |
0.84% |
-5.87% |
|
1 month |
5.28% |
7.84% |
12.23% |
8.13% |
|
YTD |
-14.38% |
-6.47% |
-2.93% |
-17.73% |
|
Since Inception |
25.92% |
39.29% |
42.22% |
21.81% |
|
Annualized |
12.21% |
18.02% |
19.26% |
10.37% |
Individual watchlist returns for October 2022 were:
- (BLK) +17.38%
- (BX) +9.94%
- (CMCSA) +9.16%
- (BBY) +8.00%
- (FDX) +7.95%
- (MS) +4.98%
- (TROW) +1.10%
- (SWKS) +0.87%
- (AMT) -2.77%
- (PARA) -3.87%
Top 5 Stocks by total return since joining the watchlist:
- (PFG) +142.42% (24 months)
- (GD) +99.54% (24 months)
- (CVS) +77.01% (24 months)
- (MTB) +72.37% (24 months)
- (BMO) +67.31% (24 months)
PFG gained 22.15% in October and sees its watchlist return jump well above 100%. GD gained 18.4% in October and jumps into 2nd place and very close to a 100% return now. CVS lost 0.1% in October and remains in 3rd best place. MTB lost 4.51% in October and drops down to 4th place. BMO gained 6.23% and retains its grip on 5th place.
Top 5 Stocks by Average Monthly return since joining the watchlist:
- (FDX) +7.95% (1 month)
- (PFG) +3.76% (24 months)
- (GD) +2.92% (24 months)
- (CMI) +2.46% (8 months)
- (CVS) +2.41% (24 months)
In total there have been 66 unique high yield dividend stocks that have appeared in the top 10 list during the past 2 years. Out of these 66 unique stocks 50 have a positive total return since first appearing on the top 10 list. The average total return for these 50 stocks is 30.46%. The average loss for the 16 stocks that have negative total returns is -18.39%. Here are all 66 stocks, their total return since inception and the number of months since they first appeared in the top 10 list.
|
Symbol |
Since Inception |
Count |
|
PFG |
142.42% |
24 |
|
GD |
99.54% |
24 |
|
CVS |
77.01% |
24 |
|
MTB |
72.37% |
24 |
|
BMO |
67.31% |
24 |
|
HBAN |
58.47% |
24 |
|
TD |
56.42% |
24 |
|
PGR |
50.45% |
21 |
|
MRK |
49.94% |
18 |
|
LMT |
47.09% |
24 |
|
PEP |
44.04% |
24 |
|
K |
41.76% |
20 |
|
GIS |
41.21% |
15 |
|
RY |
40.84% |
24 |
|
PAYX |
40.45% |
21 |
|
SRE |
37.59% |
20 |
|
JPM |
35.81% |
24 |
|
CSCO |
34.36% |
24 |
|
STT |
33.20% |
24 |
|
AMGN |
32.49% |
24 |
|
CM |
32.06% |
24 |
|
CPB |
31.79% |
13 |
|
BK |
28.83% |
24 |
|
BNS |
26.66% |
24 |
|
TRP |
24.74% |
24 |
|
SO |
23.37% |
24 |
|
EPD |
22.78% |
15 |
|
CMI |
21.47% |
8 |
|
ATO |
20.13% |
11 |
|
PM |
19.87% |
20 |
|
EVRG |
18.78% |
24 |
|
USB |
16.82% |
24 |
|
XEL |
16.66% |
20 |
|
TFC |
14.65% |
24 |
|
NTRS |
13.62% |
24 |
|
DTE |
13.50% |
24 |
|
CMS |
9.94% |
20 |
|
SNA |
8.71% |
9 |
|
HD |
8.68% |
4 |
|
RCI |
8.61% |
24 |
|
FDX |
7.95% |
1 |
|
AVGO |
7.77% |
18 |
|
TXN |
6.03% |
4 |
|
BLK |
4.92% |
6 |
|
WEC |
4.62% |
22 |
|
CMA |
3.51% |
19 |
|
DRI |
2.41% |
15 |
|
SWKS |
0.87% |
1 |
|
KMB |
0.17% |
21 |
|
LNT |
0.09% |
24 |
|
AMT |
-2.77% |
1 |
|
QSR |
-3.05% |
14 |
|
AAP |
-4.75% |
8 |
|
CLX |
-9.72% |
14 |
|
MS |
-10.84% |
15 |
|
CMCSA |
-11.54% |
2 |
|
MMM |
-15.66% |
24 |
|
HAS |
-16.64% |
24 |
|
UPS |
-18.98% |
8 |
|
DLR |
-23.47% |
8 |
|
BX |
-25.66% |
7 |
|
BEN |
-27.45% |
10 |
|
TROW |
-29.14% |
9 |
|
BBY |
-30.37% |
10 |
|
INTC |
-31.94% |
24 |
|
PARA |
-32.18% |
24 |
Buy-And-Hold Portfolios
The buy-and-hold portfolios are a more useful measure of how a long-term investing approach utilizing this watchlist could perform. I started tracking one for 2022 and one since 2021. Both buy-and-hold portfolios invest an equal amount each month into all 10 chosen high yield stocks, the positions are never sold and all dividends are reinvested back into the issuing stock.
Here’s a quick breakdown of how each portfolio is performing.
The 2021 buy-and-hold portfolio has now been around for 22 full months. It gained 9.69% in October, losing to VYM but beating SPY. After this mixed result month, the portfolio sees its cumulative alpha over VYM shrink to 1.22% and increase to 9.74% over SPY. On an annualized basis, the portfolio has a return of 12.93% compared to 11.71% for VYM and 3.19% for SPY.
|
TOTAL |
Cumulative |
2021 |
2022 |
Annualized |
|
2021 B&H |
24.97% |
32.97% |
-6.02% |
12.93% |
|
VYM |
22.51% |
26.21% |
-2.93% |
11.71% |
|
SPY |
5.92% |
28.76% |
-17.73% |
3.19% |
The portfolio is made up of 48 unique high yield dividend stocks. Below is a table of all of the positions, the cumulative return for each component and the allocation as of October 31, 2022.
|
Symbol |
Return |
Alloc. |
|
AAP |
1.53% |
3.15% |
|
AMGN |
23.54% |
6.02% |
|
AMT |
-2.77% |
0.43% |
|
ATO |
20.13% |
0.53% |
|
AVGO |
0.54% |
2.67% |
|
BBY |
-14.34% |
3.79% |
|
BEN |
-27.45% |
0.32% |
|
BK |
4.30% |
0.46% |
|
BLK |
3.66% |
2.75% |
|
BMO |
-9.72% |
0.80% |
|
BX |
-7.81% |
2.86% |
|
CMI |
21.47% |
0.54% |
|
CMA |
-1.03% |
1.31% |
|
CMCSA |
-1.19% |
0.87% |
|
CMS |
-2.91% |
0.86% |
|
CSCO |
-10.28% |
0.79% |
|
DLR |
-26.31% |
1.63% |
|
DRI |
7.96% |
3.35% |
|
DTE |
5.35% |
1.40% |
|
EPD |
13.04% |
1.00% |
|
EVRG |
2.93% |
2.28% |
|
FDX |
7.95% |
0.48% |
|
GD |
76.73% |
1.56% |
|
HBAN |
29.42% |
0.57% |
|
HD |
8.68% |
0.48% |
|
INTC |
-23.78% |
1.35% |
|
JPM |
3.76% |
0.92% |
|
LMT |
44.12% |
4.47% |
|
MMM |
-25.74% |
5.26% |
|
MS |
-4.84% |
5.48% |
|
MTB |
19.94% |
4.25% |
|
NTRS |
-4.50% |
1.27% |
|
PEP |
29.87% |
2.30% |
|
PFG |
52.72% |
5.41% |
|
PGR |
51.53% |
1.34% |
|
PM |
4.16% |
3.69% |
|
QSR |
7.26% |
4.75% |
|
RY |
6.11% |
2.35% |
|
SNA |
8.71% |
0.48% |
|
SWKS |
0.87% |
0.45% |
|
STT |
8.46% |
1.44% |
|
TD |
3.81% |
4.14% |
|
TFC |
-16.58% |
1.85% |
|
TROW |
-15.15% |
3.38% |
|
TXN |
2.01% |
0.90% |
|
UPS |
-13.00% |
1.54% |
|
USB |
-16.90% |
1.10% |
|
PARA |
-26.71% |
0.97% |
The 2022 buy-and-hold portfolio did not perform as well in October, gaining 8.80%. The portfolio trails VYM by 7.62% after 10 months but is outperforming SPY by 7.19%. I believe the portfolio will catch-up with VYM and offer alpha in the long run.
|
TOTAL |
Cumulative |
|
2022 B&H |
-10.55% |
|
VYM |
-2.93% |
|
SPY |
-17.73% |
As of month end October, it includes 32 unique high yield dividend stocks. Below is a table of all of the positions, the cumulative return for each component, and the allocation as of October 31, 2022.
|
Symbol |
Return |
Alloc. |
|
AAP |
1.53% |
7.56% |
|
AMGN |
22.51% |
2.61% |
|
AMT |
-2.77% |
1.03% |
|
BBY |
-14.34% |
9.11% |
|
BEN |
-27.45% |
0.77% |
|
BLK |
3.66% |
6.61% |
|
BMO |
-16.57% |
0.89% |
|
BX |
-7.81% |
6.86% |
|
CMCSA |
-1.19% |
2.10% |
|
CMI |
21.47% |
1.29% |
|
DLR |
-26.31% |
3.92% |
|
DRI |
22.54% |
2.61% |
|
EPD |
3.30% |
1.10% |
|
FDX |
7.95% |
1.15% |
|
HD |
8.68% |
1.16% |
|
INTC |
-18.36% |
2.60% |
|
LMT |
39.62% |
1.48% |
|
MMM |
-17.72% |
4.37% |
|
MS |
-2.96% |
10.32% |
|
MTB |
11.81% |
1.19% |
|
PM |
0.70% |
1.07% |
|
QSR |
9.27% |
6.97% |
|
RY |
-16.48% |
0.89% |
|
SNA |
8.71% |
1.16% |
|
SWKS |
0.87% |
1.07% |
|
TD |
-15.38% |
1.80% |
|
TFC |
-4.38% |
1.02% |
|
TROW |
-15.15% |
8.12% |
|
TXN |
2.01% |
2.17% |
|
UPS |
-13.00% |
3.70% |
|
USB |
-23.75% |
1.62% |
|
PARA |
-20.71% |
1.69% |
Two benefits these portfolios offer over VYM and SPY are a higher starting dividend yield and more consistent dividend payment schedules. The 2021 buy-and-hold portfolio is performing very well thus far, and the 2022 portfolio hasn’t been around long enough to be properly evaluated.
I believe that a buy-and-hold investing approach is the best strategy for all dividend investors. If you apply this strategy targeting quality companies trading for attractive prices, you should achieve better-than-average results in the long run.
Be the first to comment