

Pgiam/iStock via Getty Images
Portfolio Changes in May
Starting in May 2021, I have been reducing the volume of my monthly investment activity given elevated valuations and my desire to save cash either for investment or some other endeavors. The stock markets have been very kind to me over the last couple of years as I did manage to build some decent positions at a good cost basis.
I have been hesitant to increase my monthly investment rates but that sentiment changed in May as inflation prints and inflation woes have started to create attractive buying opportunities. Inflation continues to run hot and while the Fed has now responded with a rare 75bps hike in June I expect inflation to remain high for a long time.
The war in Ukraine is no longer dominating market movements as inflation has entered center stage. And while a large part of record inflation is undoubtedly caused by the war structural supply chain problems and poor energy policies in western countries are another major factor. As the west scrambled to unleash as many sanctions as possible on Russia they either completely underestimated or didn’t care about the impact of sanctioning the world’s most important commodity exporter. Russia can provide for its own people as it has access to food and energy while especially Europe has completely messed up the energy part. As a result, oil and especially gas prices are climbing ferociously and with energy being ingrained in every supply chain either directly or indirectly the impact of sky-high energy and transportation costs affects basically every good and service.
In May I completed my exit in Preferred Apartment Communities (APTS) and channeled most of the proceeds into STORE Capital (STOR) and STAG Industrial (STAG), two deeply undervalued REITs with attractive dividends. Needless to say that given the carnage which unfolded in June all these purchases are already deep in the red but as timing the market is impossible for me I remain confident over the long-term on both stocks.
Against the backdrop of these events, I have decided to limit my monthly purchases in early March while waiting for more attractive buying opportunities. I have been way more active in May by predominantly buying dividend stocks and largely avoiding any tech stocks. Therefore, I continued suspending my savings plans on Apple (AAPL) and Microsoft (MSFT) and instead added rather heavily to my REIT holdings especially after all of them reported very solid earnings or were at least expected to do so in early May as in the case of STAG Industrial and STORE Capital. STAG is back to yielding significantly above 4% and STOR has entered the 6% yield sector with an around 5% dividend growth rate as well.
Thus, my net investment for May reached a record $3,500 and I fully expect things to get much worse in the next quarters as the American and European consumer is getting pummeled by inflation which should seriously hit the demand side and lead to sharp earnings revisions. I am predominantly a value and dividend investor and even though favorite tech stocks like Apple and Microsoft are finally also getting hit by negative market sentiment the magnitude of these drops pales in comparison to the likes of Netflix (NFLX) or Meta (META).
I am waiting for more good deals on solid dividend stocks to cushion the impact of inflation while I keep running my savings plans on dividend stocks with a yield of at least around 3%.
Due to the nature of how the monthly investment plan process works, I am investing relatively equally into these stocks at two points of time during the month – at the beginning of the month and mid-month – which breaks down as shown below. Figures are in Euro and show that, for instance, at the beginning of the month, I am investing between 50 and 75 EUR each into Microsoft, The Home Depot (NYSE:HD), Visa (NYSE:V), W. P. Carey (WPC), and BP (NYSE:BP). Mid-month, I am adding between 33 and 40 EUR each into STAG Industrial (NYSE:STAG), AT&T (T), NextEra Energy (NYSE:NEE), Toronto-Dominion Bank (NYSE:TD), Main Street Capital (NYSE:MAIN) and JPMorgan (NYSE:JPM).
I have added several investment plans starting mid-September 2020 which include AGNC Investment Corp. (NASDAQ:AGNC), Ares Capital (NASDAQ:ARCC), Medical Properties Trust (NYSE:MPW), The Bank of Nova Scotia (NYSE:BNS) and The Trade Desk (NASDAQ:TTD). Investments here will be focused on high-yield as well as high-growth stocks in the technology, therapeutic and renewables sectors.
All those purchases substantially raised my forward annual dividend income, breaking down as follows:
Added Dividend Income (Designed by Author)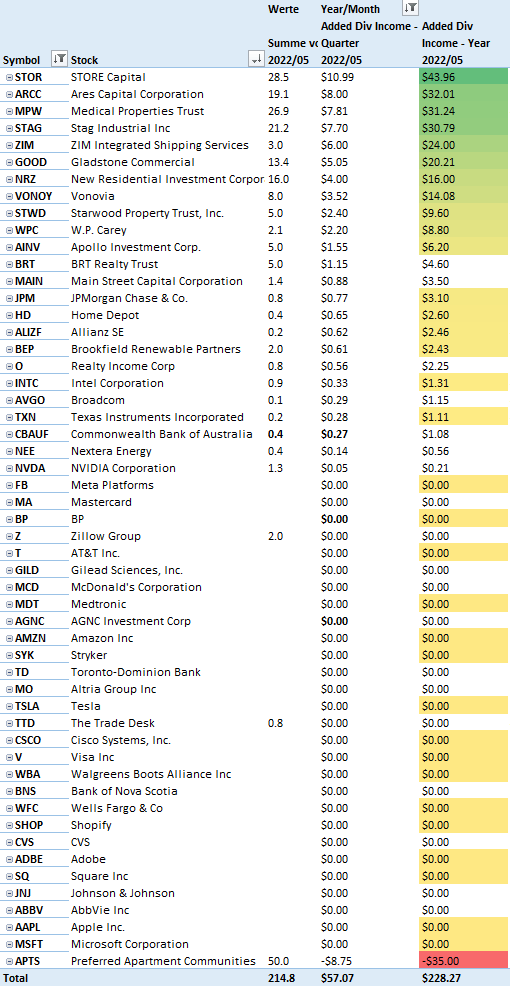
All net purchases in May can be found below:
Net Purchases in May (Designed by Author)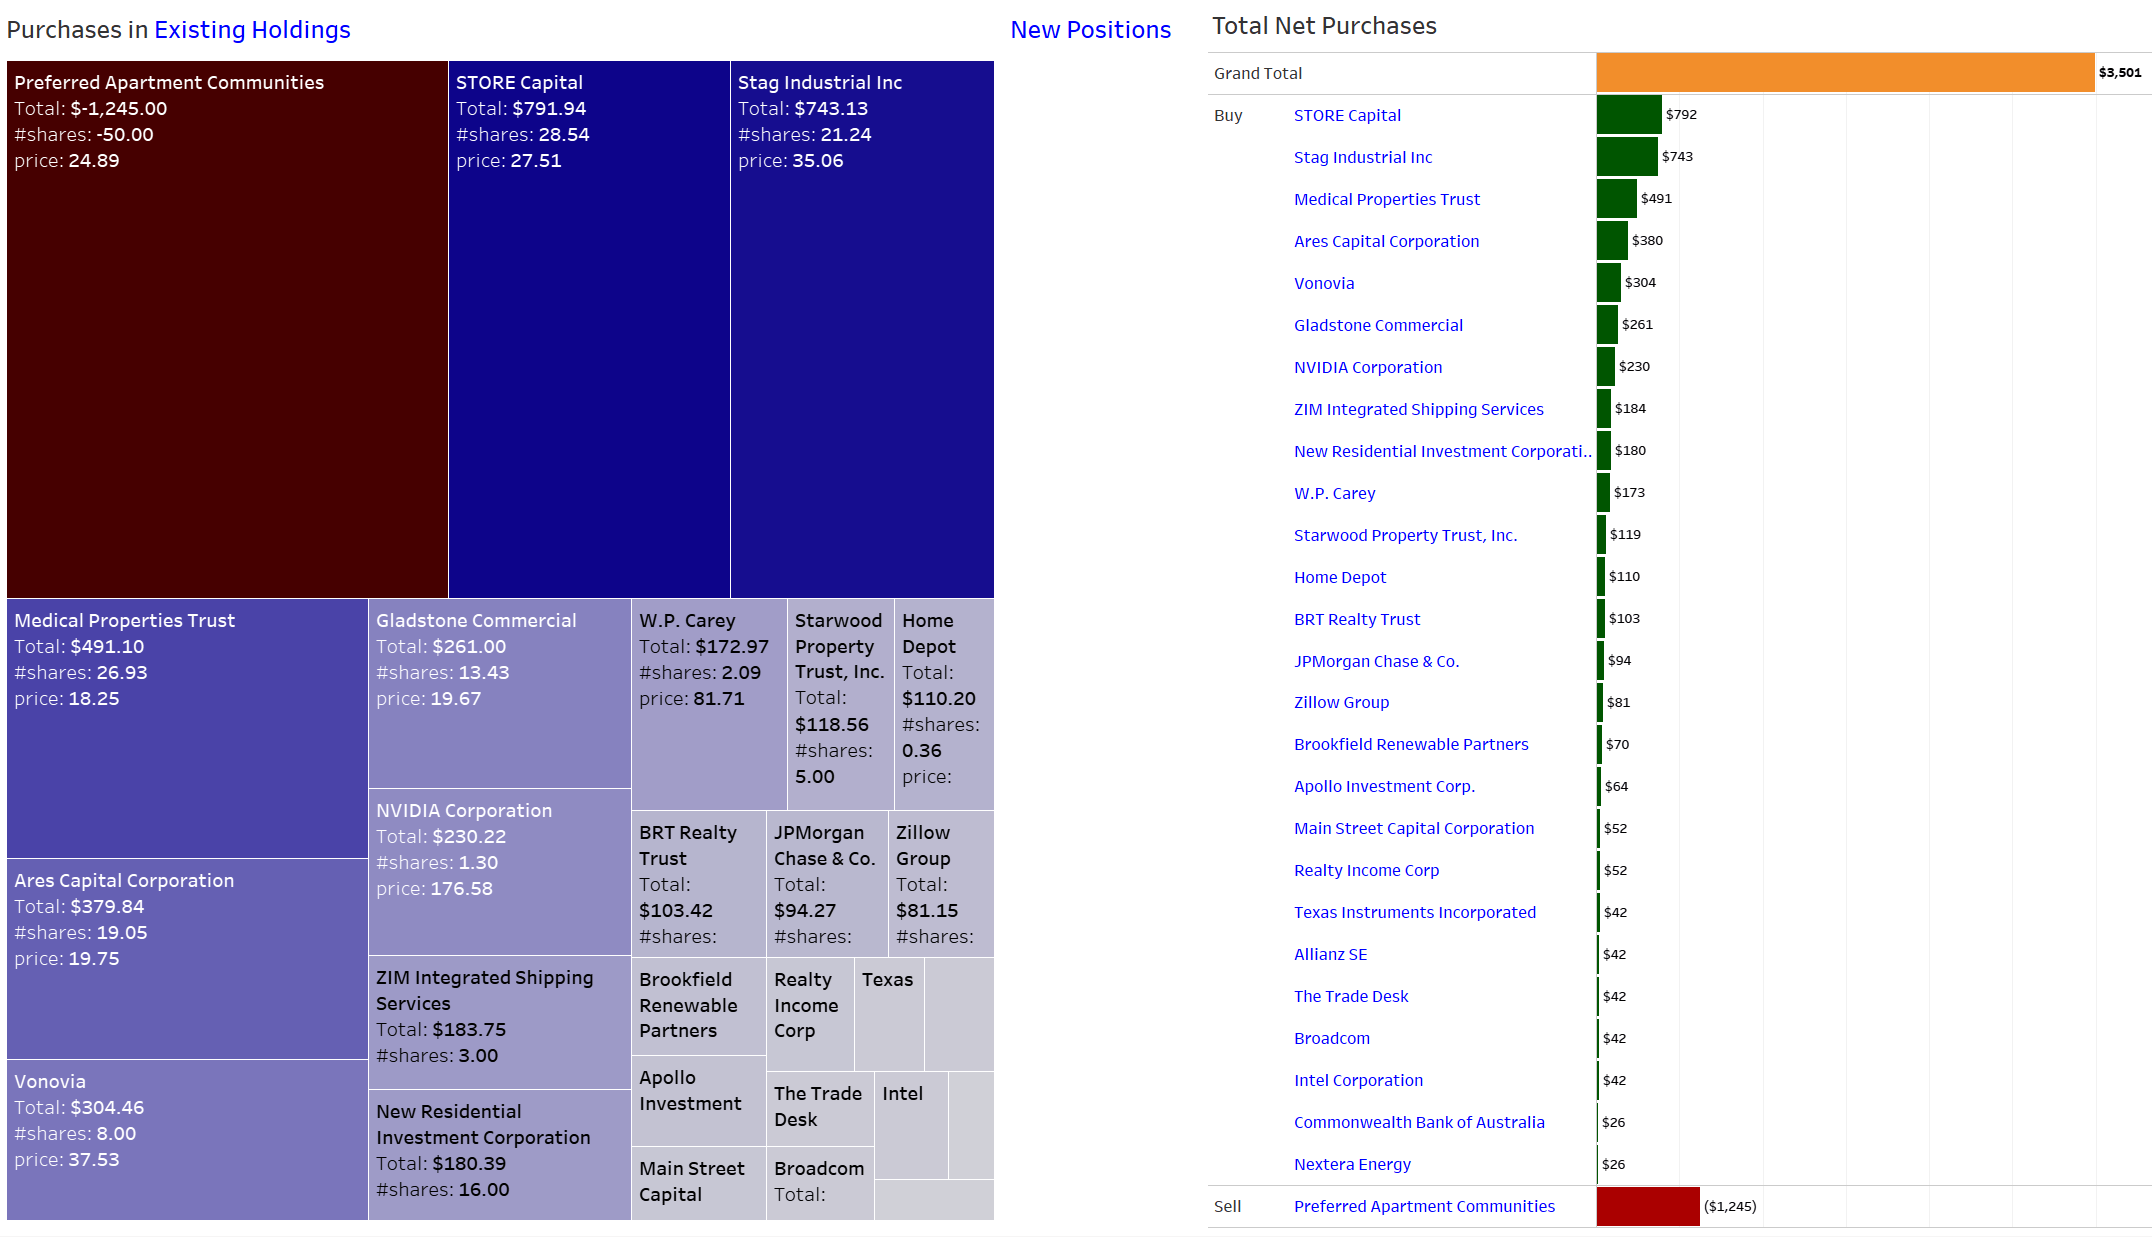
Dividend Income: What Happened on The Dividend Side?
Dividend income hit a new May record of $729 and is up an explosive 75% annually and 84% sequentially. Adjusting for annual dividend payments of the previous year the real Y/Y growth rate retreats to a still surprisingly strong 36% Y/Y and 5% sequentially.
May features the majority of my annual dividend payers and with both Mercedes Benz and BMW paying record dividends this time in the same month it was always clear that May will set a new dividend record. On top of that my monthly purchases into Allianz over the past year have helped almost double that dividend income.
Next to the annual dividend payers others notable dividend growth stems from AbbVie, Blackstone and Morgan Stanley which helped partially offset the massive decline in dividend income from AT&T following the WarnerMedia spin-off and the accompanying big dividend cut.
I hope I will be able and patient enough to add more German dividend payers over the course of the year so that next May has a chance to cross the 4-digit mark for the very first time. In particular I am eying to add to Allianz as well as open positions in Deutsche Post, Münchener Rück, Covestro and Heidelberger Druck and given the bear market we have just entered for the second time this year I may get my chance.
Dividend Income (Designed by Author)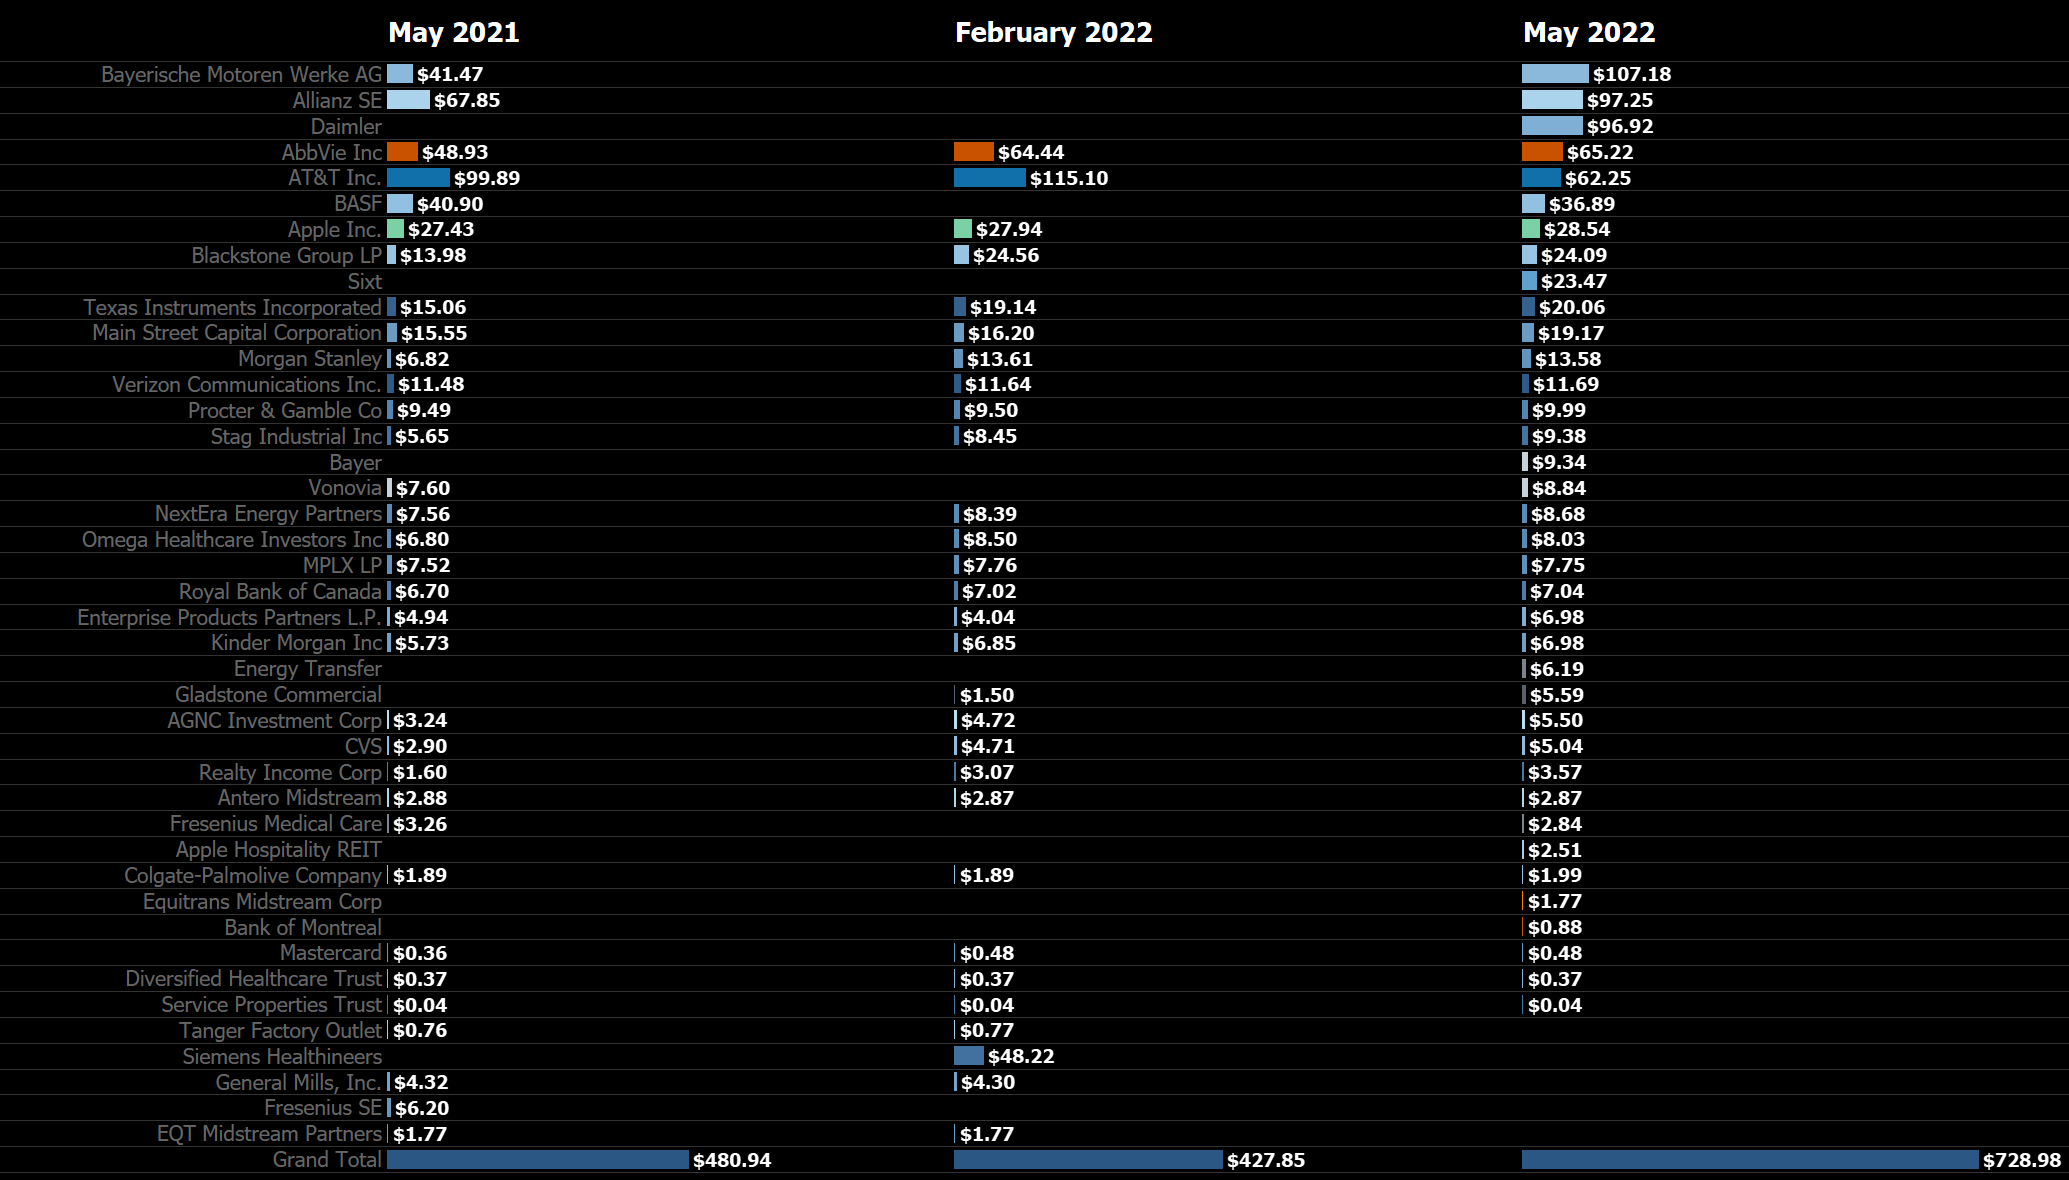
Looking at the top three dividend payers in May (excluding the annual dividend payers), dividend income developed as follows:
Top 3 Regular Dividend Payers (Designed by Author)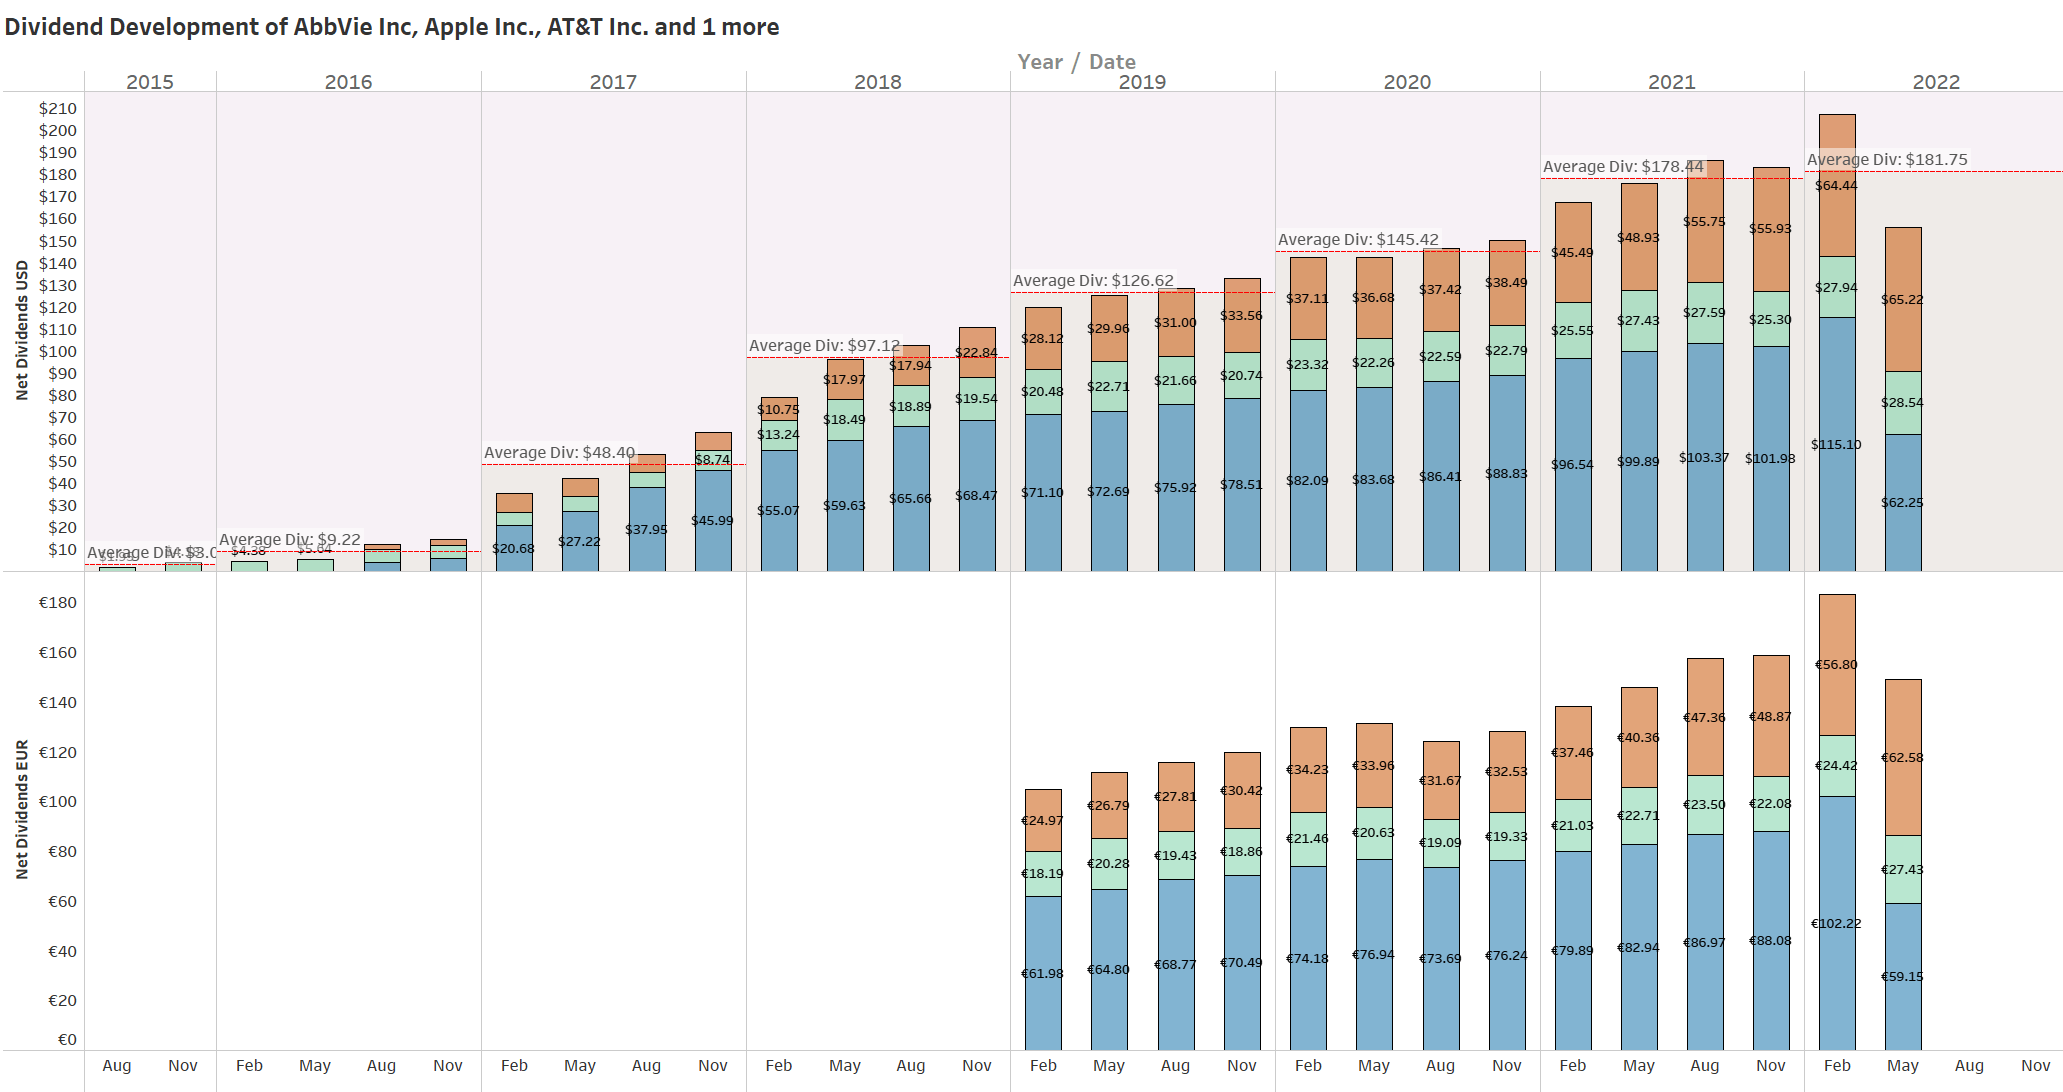
Here is a look at my favorite chart: the net dividend income development by month over time between 2015 and 2022, where you can easily see the development of my dividend income as well as the average annual dividend in a given year:
All-time Dividend Development (Designed by Author)
Next, I have scattered all the individual dividend payments I have ever received and colored them by year, rearranging the years side by side rather than horizontally as in previous updates:
Dividend Payment Bubbles (Designed by Author)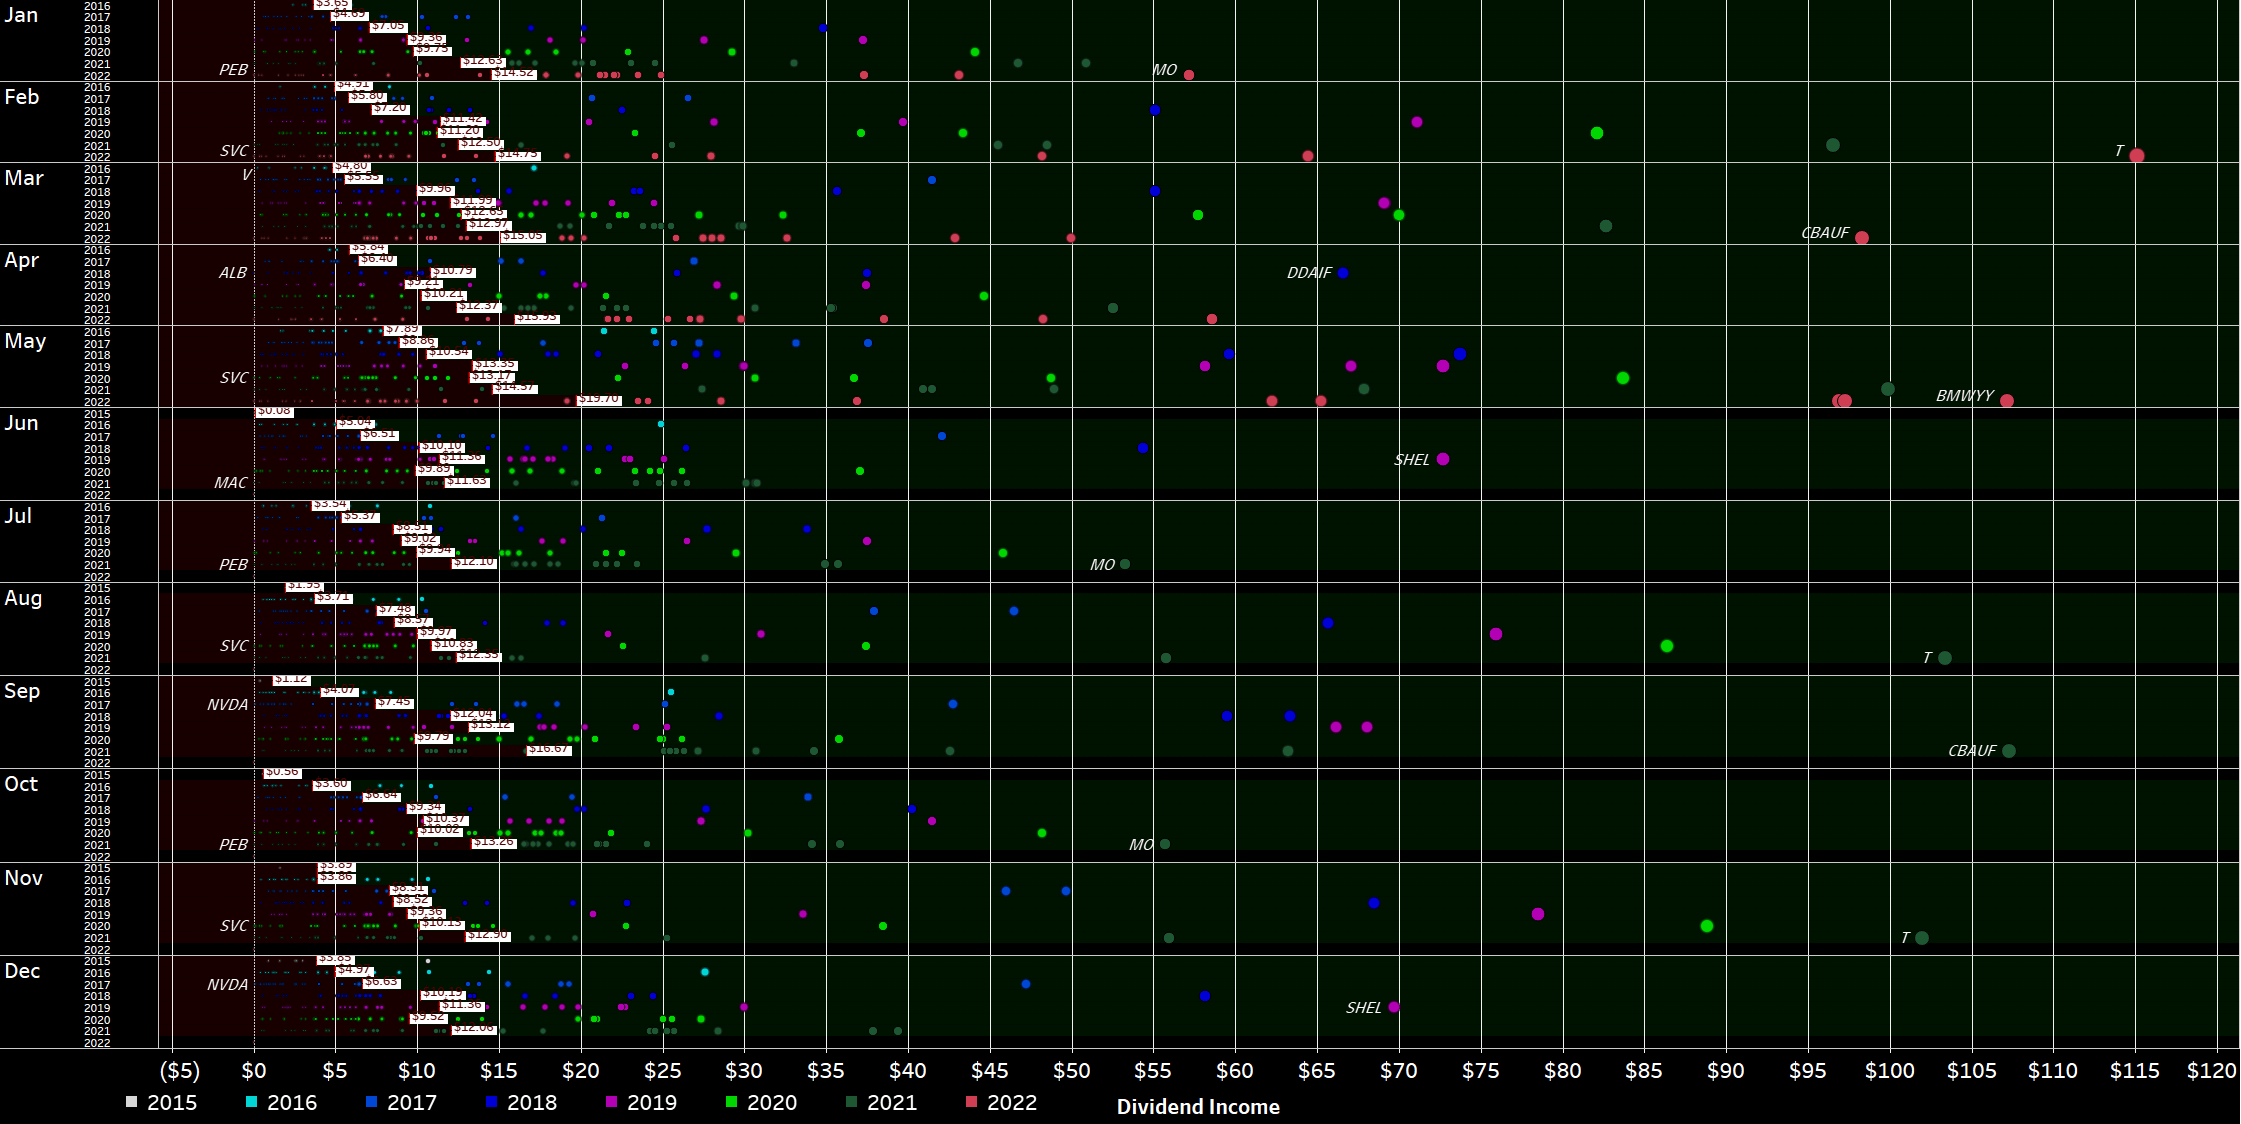
This view looks very cluttered at first, but it is very rich in information. It shows every single dividend payment I have received since I started my journey in 2015 in the shape of a circle colored differently by year and size, based upon their contribution. The view is broken down by month and by year (not by year and by month), and thus allows to better see the development over time. For every year of a certain month, a white rectangle indicates the average monthly dividend. The area where dividends fall below that average is filled dark red, whereas the area above is colored dark green. Personally, I absolutely love this redesigned view of my old “bubbles chart,” as it is much clearer to identify developments and trends in my dividend income.
May 2022 Dividends (Designed by Author)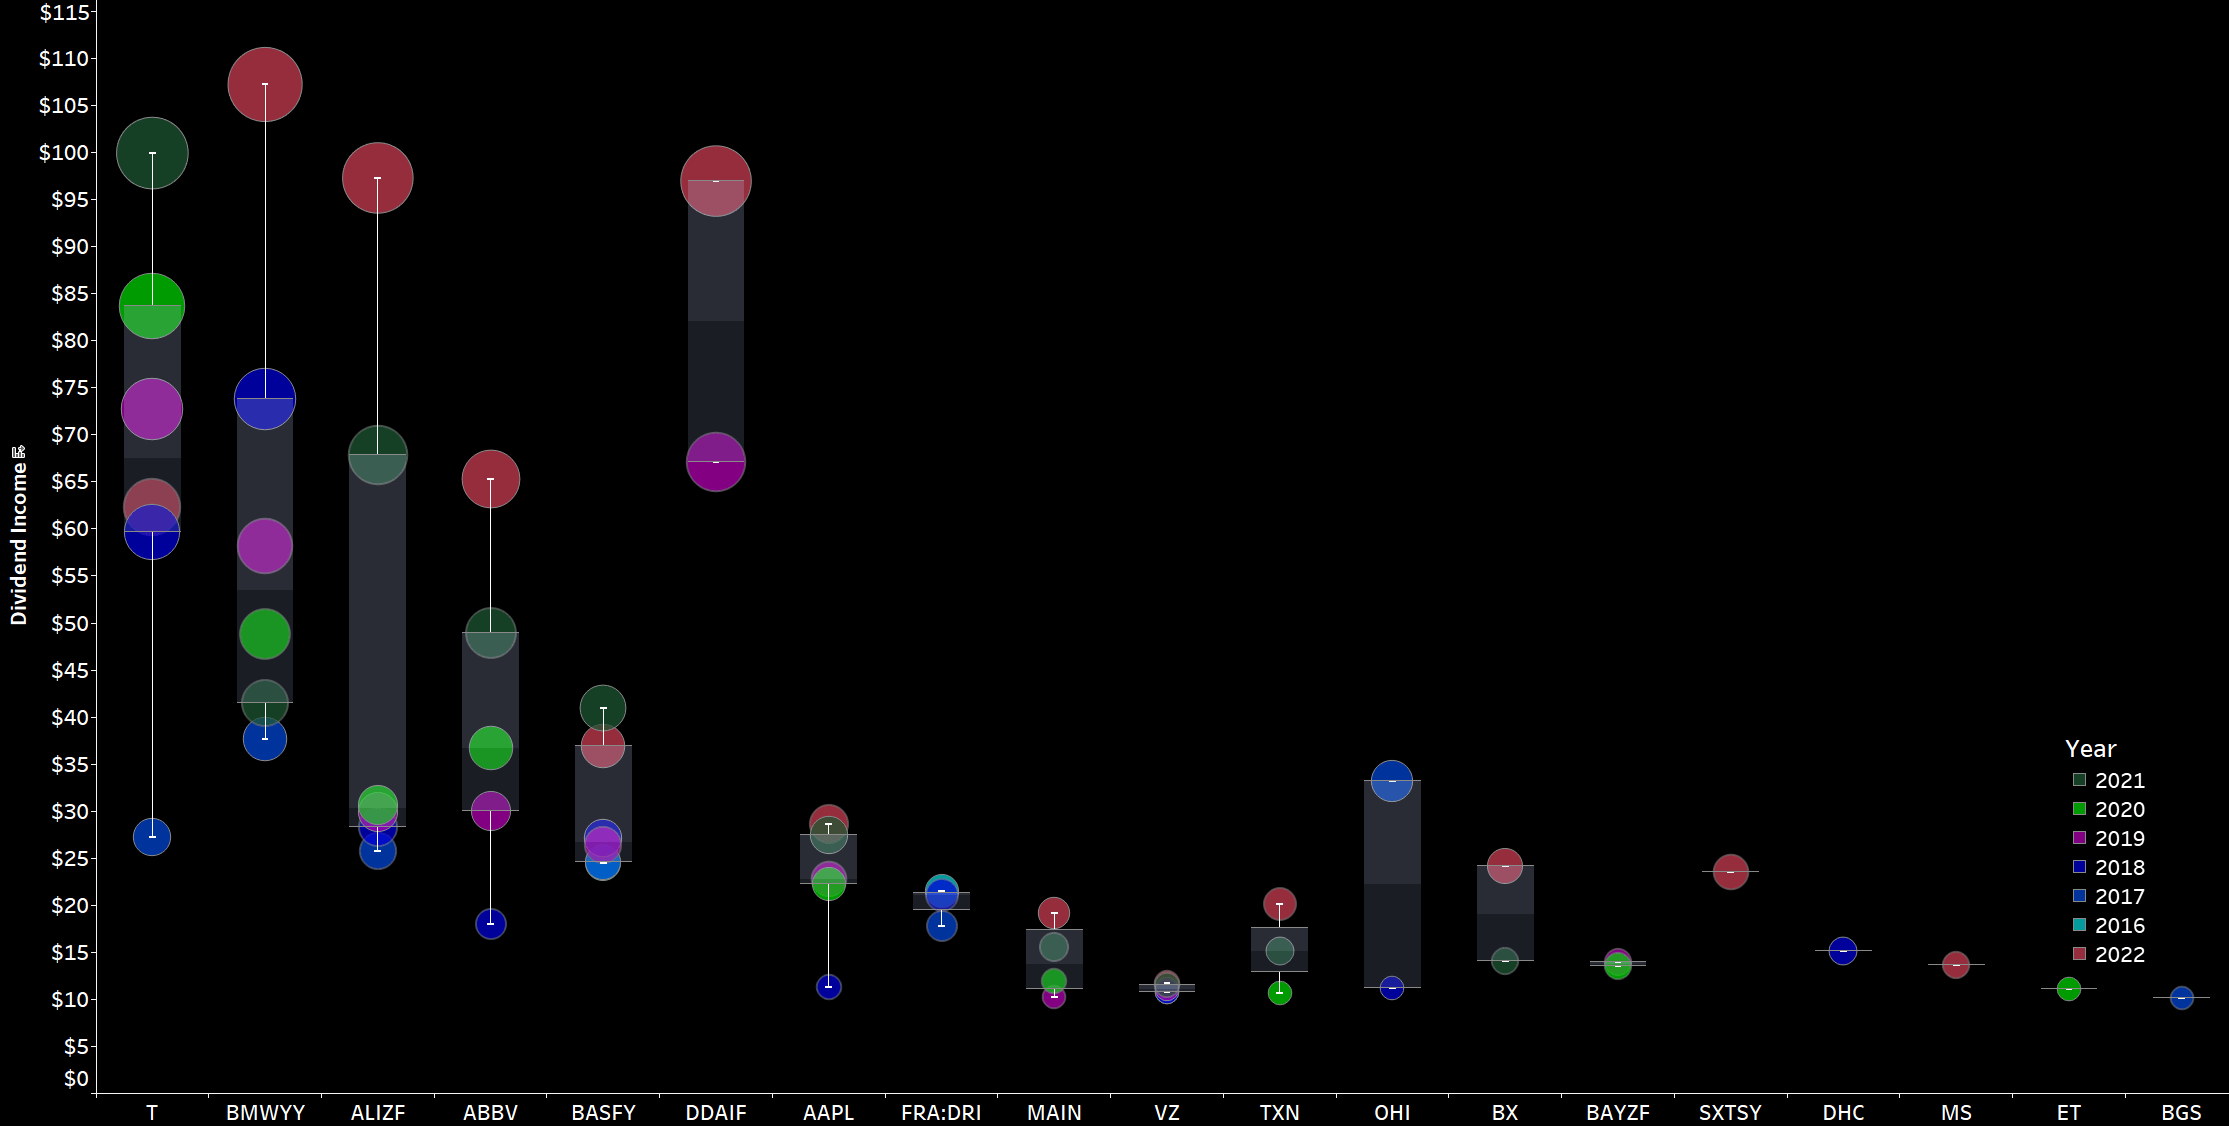
Now, zooming in on May, we can immediately see a number of big green circles in a sea of black. The bigger the circle and the bigger the distance to the previous circle for the same stock, the bigger is the change in dividend income compared to the prior years.
The most striking observation are obviously the three big red circles from my German annual dividend payers and the visually easily decipherable massive dividend cut from AT&T on the far left.
Overall, what I am looking for long-term is to see the dividend income from the most recent year to be at the top of the respective bar and obviously continue growing over time.
Another way to express the monthly dividend income is in terms of Gifted Working Time (GWT).
I am assuming an average hourly rate of $30.8 for 2022 here:
- In 2018, I generated 121 hours in GWT, equaling slightly more than $3,000 in annual net dividends.
- In 2019, I generated 142 hours in GWT, equaling almost $3,600 in annual net dividends.
- In 2020, I generated 152 hours in GWT, equaling roughly $3,800 in annual net dividends.
- In 2021, I generated 180 hours in GWT, equaling roughly $5,050 in annual net dividends.
- In 2022, I am targeting to reach at least $5,500 in annual net dividends, which equals roughly 179 hours in GWT. Despite the projected increase in annual net dividends I expect overall GWT to decrease following higher calculated hourly rates, a figure I project to rise by 10% given soaring inflation. The annual target of $5,500 is on the very cautious side as I need more visibility into how the year is progressing, particularly as I expect ongoing monthly investments to decline given elevated stock levels and rising inflationary and geopolitical pressures.
Across the years, the YTD Dividend Race as I like to call it looks as follows. While 2020 was fairly disappointing, 2021 was phenomenal as it benefited from a rather low baseline from the prior year. For 2022, I am targeting a conservative high single-digit growth rate for now, which is a very cautious estimate to begin with. YTD growth based on the first five months is shattering my expectations coming in at 27% Y/Y, and while I expect some moderation over the course of the year, solid double-digit growth in annual dividend income is almost guaranteed already for this year. If things go really well and I am able to snatch up more dividend stocks on the cheap I might even be able to exceed $6,000 which would be a major milestone as it equates to at least $500 in net dividends per month.
YTD Dividend Growth (Designed by Author)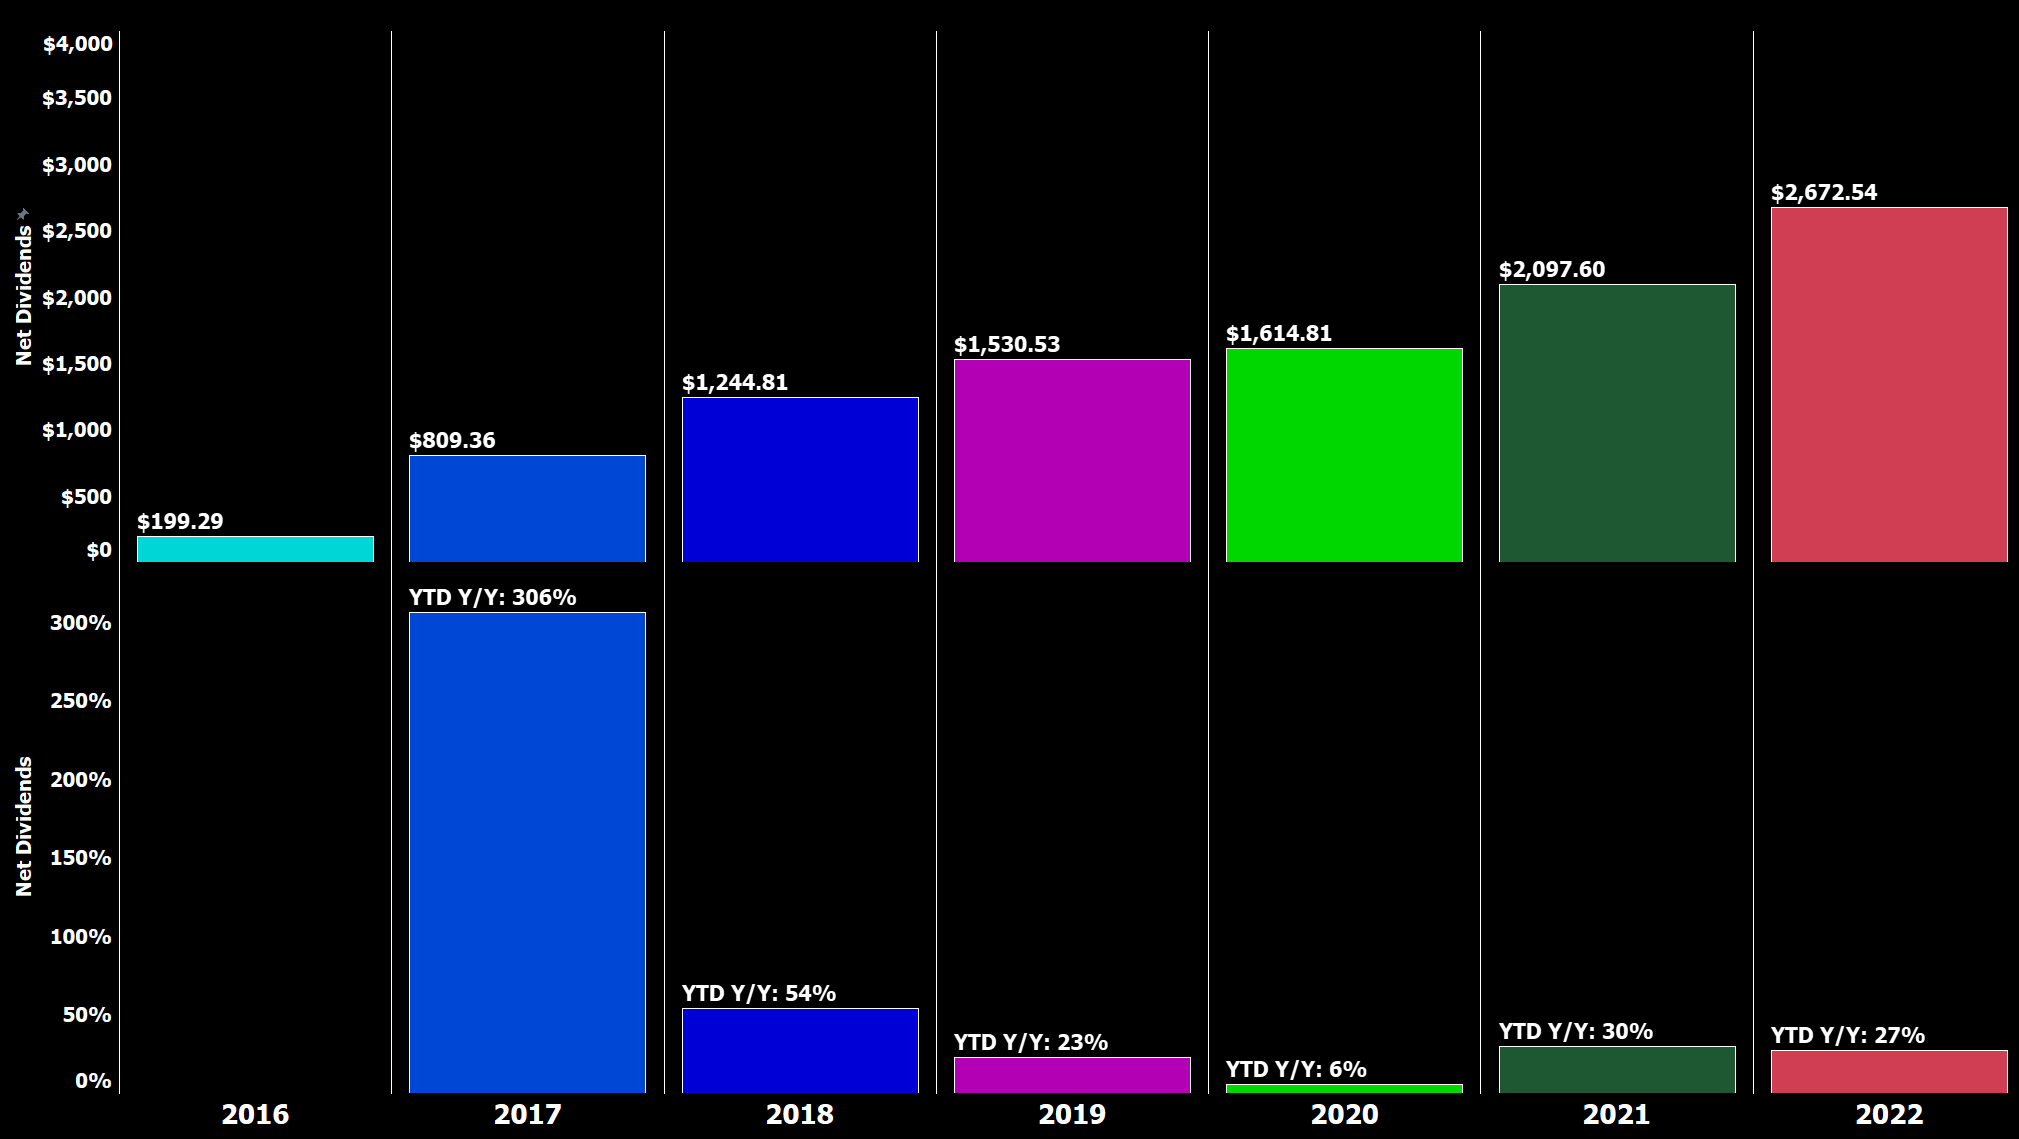
I have modified the YTD Dividend Race chart. Top left shows the YTD Dividend Race in the old format. At the top right, we can see how YTD dividend income developed on a daily basis and whereby we can easily identify that most of my dividend income is generated mid-month and towards the end of the month. At the bottom, that development is broken down by every individual month for the current quarter which makes big jumps clearly identifiable.
YTD Dividend Race (Designed by Author)
Expressed in GWT, it presents itself as follows:
Gifted Working Time (Designed by Author)
What this shows is as follows:
- All time (blue area) – Around 777 hours, or 100 days, of active work have been replaced with passive income since the start of my dividend journey. Assuming a five-day workweek this translates into 20 weeks of vacation funded via dividends.
- YTD (green bars) – Around 95 hours, or 11.9 days, of active work have been replaced with passive income in 2022 already, which equals more than 2 weeks worth of active work funded via dividends.
- Highlighted in pink is the accumulated YTD total at the end of the current reporting month (MAY).
Upcoming June Dividends
With March marking the end of the quarter, this will traditionally be a strong month in terms of dividend income. Among others, further big dividend payers from my portfolio in March are Royal Dutch Shell (SHEL), BP (BP), McDonald’s (NYSE:MCD), Johnson & Johnson (NYSE:JNJ), Southern Company (NYSE:SO) and Ares Capital Corporation (ARCC) of which 4 companies are part of my regular monthly savings plans.
Many of those are part of my monthly savings plans and thus there should be some solid growth in dividend income despite the heavy dividend cuts from Shell, BP and Wells Fargo although all three of them have already reverted back to growing their dividend, especially Wells Fargo which simply doubled its dividend.
The snapshot below is taken from my newly and free-for-all released Dividend Calendar (make sure to follow instructions in the video) and shows my expected dividend payments in May.
My Dividend Calendar (Designed by Author)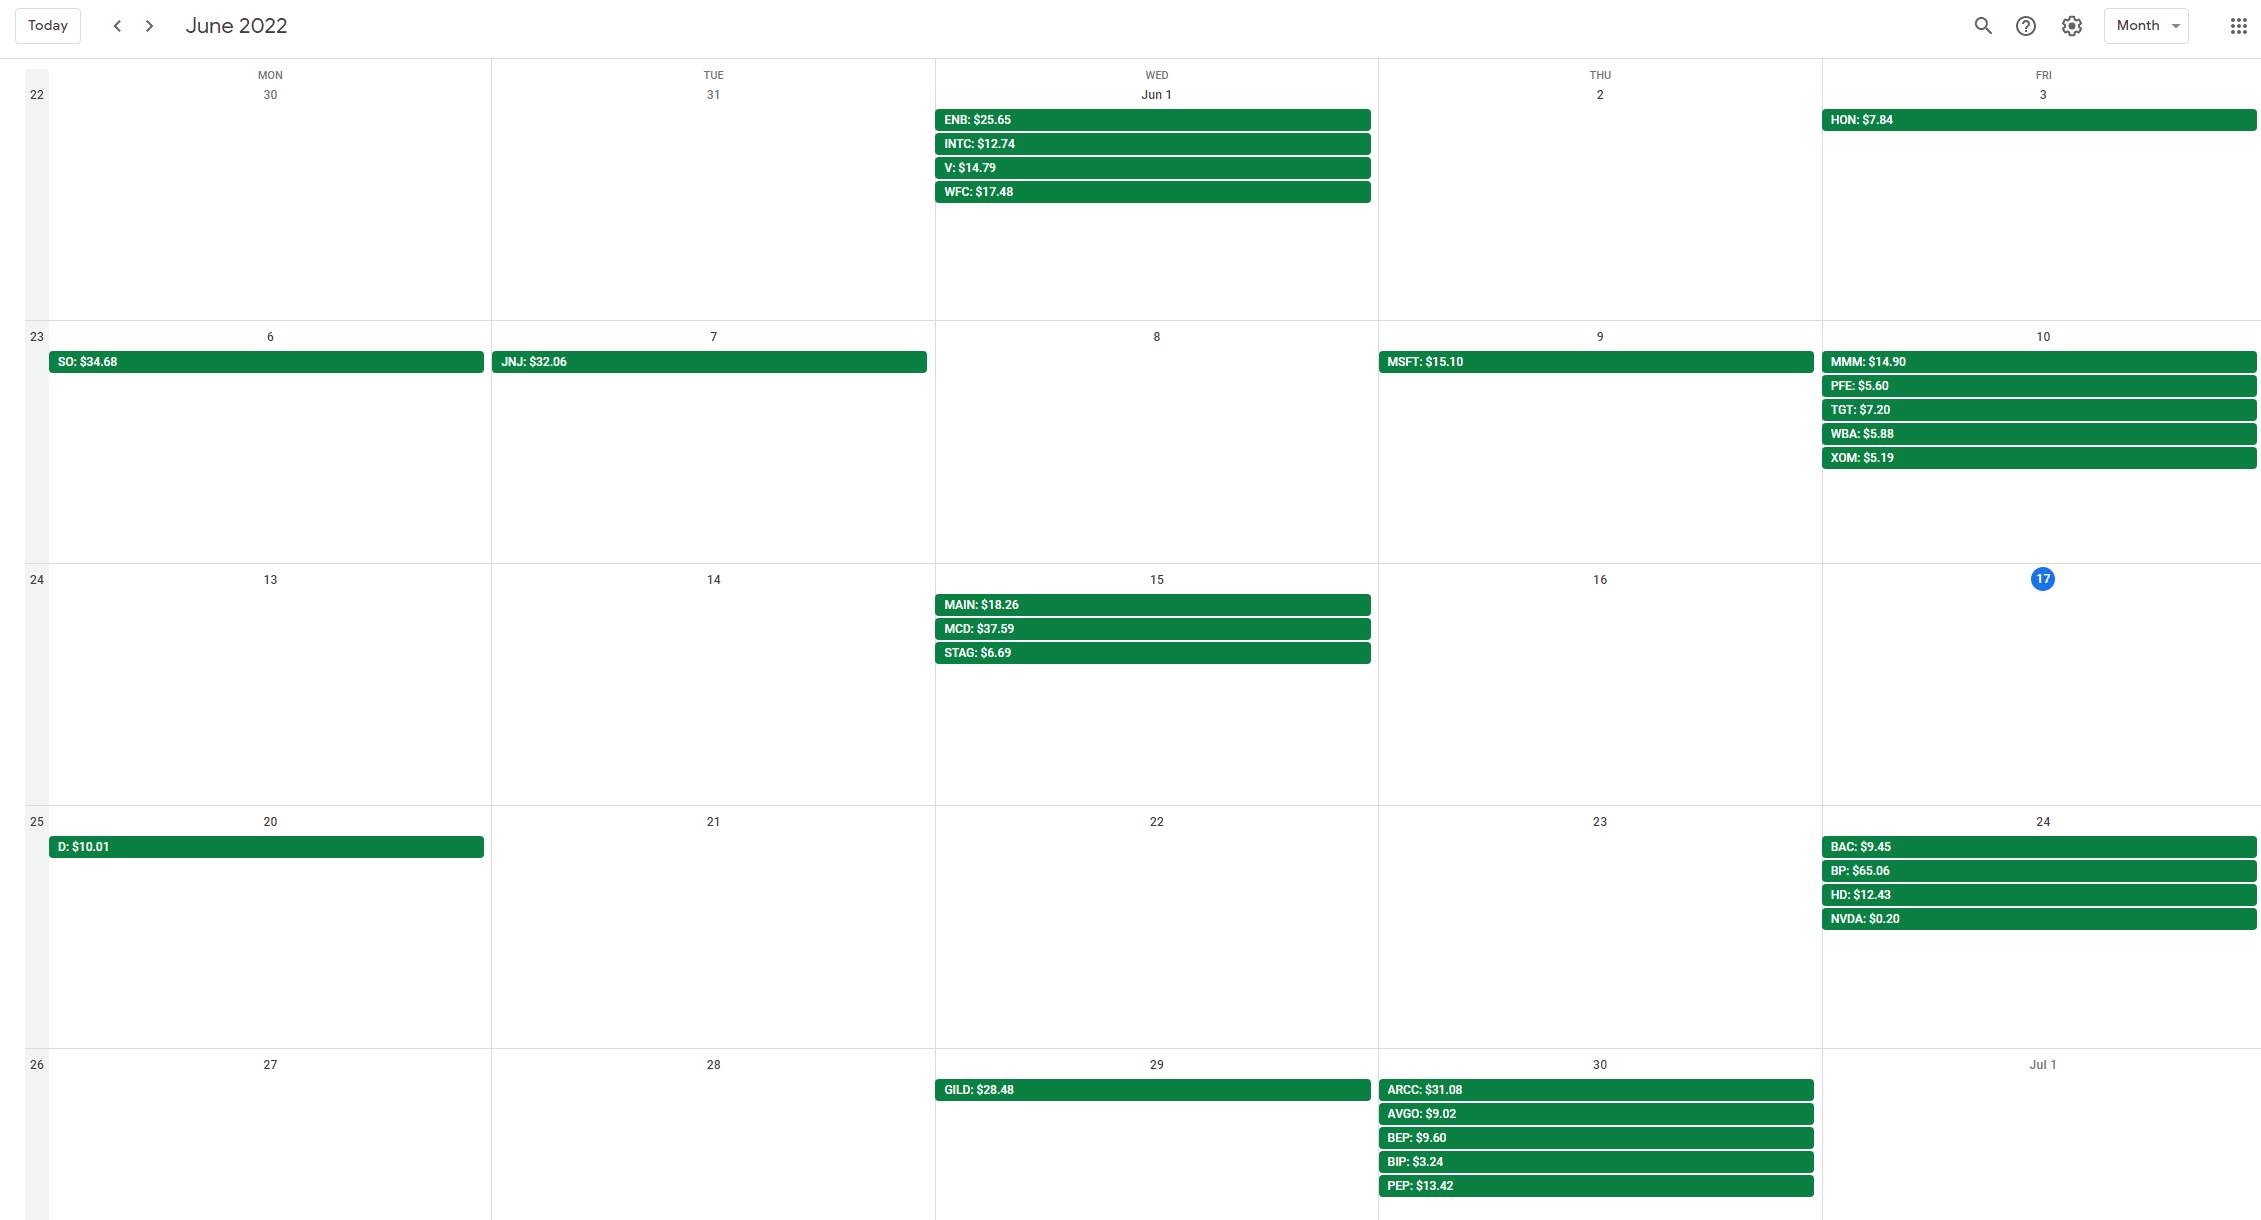
At the end of May, my dividend portfolio is composed as follows:
| Company Name | Ticker | % Market Value | Market Value (€) |
| Apple Inc. | (AAPL) | 10.87% | 18,550 |
| Visa Inc. | (V) | 4.31% | 7,354 |
| AbbVie Inc. | (ABBV) | 4.11% | 7,021 |
| McDonald’s Corp. | (MCD) | 3.62% | 6,181 |
| Microsoft Corporation | (MSFT) | 3.57% | 6,085 |
| Johnson & Johnson | (JNJ) | 2.92% | 4,976 |
| Cisco Systems, Inc. | (CSCO) | 2.87% | 4,892 |
| AT&T Inc. | (T) | 2.81% | 4,799 |
| W. P. Carey | (WPC) | 2.52% | 4,301 |
| Commonwealth Bank of Australia | (OTCPK:CBAUF) | 2.50% | 4,269 |
| Shell | (SHEL) | 2.12% | 3,615 |
| Main Street Capital Corporation | (MAIN) | 2.05% | 3,498 |
| Altria Group Inc. | (MO) | 1.90% | 3,237 |
| Southern Co. | (SO) | 1.86% | 3,177 |
| STAG Industrial Inc. | (STAG) | 1.85% | 3,161 |
| Toronto-Dominion Bank | (TD) | 1.78% | 3,045 |
| Texas Instruments Incorporated | (TXN) | 1.71% | 2,916 |
| Wells Fargo & Co. | (WFC) | 1.66% | 2,837 |
| JPMorgan Chase & Co. | (JPM) | 1.63% | 2,785 |
| Bank of Nova Scotia | (BNS) | 1.60% | 2,734 |
| Home Depot | (HD) | 1.56% | 2,663 |
| NVIDIA Corporation | (NVDA) | 1.44% | 2,466 |
| Gilead Sciences, Inc. | (GILD) | 1.44% | 2,462 |
| Ares Capital Corporation | (ARCC) | 1.43% | 2,443 |
| STORE Capital | (STOR) | 1.40% | 2,388 |
| Siemens Healthineers | (OTCPK:SEMHF) | 1.32% | 2,250 |
| Allianz SE | (OTCPK:ALIZF) | 1.21% | 2,058 |
| Medical Properties Trust | (MPW) | 1.20% | 2,040 |
| Sino AG | (XTP.F) | 1.14% | 1,947 |
| Intel Corporation | (INTC) | 1.06% | 1,814 |
| BMW | (OTCPK:BMWYY) | 1.03% | 1,757 |
| PepsiCo, Inc. | (PEP) | 1.02% | 1,746 |
| Blackstone | (BX) | 1.01% | 1,720 |
| Procter & Gamble Co. | (PG) | 0.96% | 1,631 |
| Philip Morris International Inc. | (PM) | 0.95% | 1,626 |
| Morgan Stanley | (MS) | 0.94% | 1,597 |
| Enbridge | (ENB) | 0.90% | 1,539 |
| Broadcom Inc. | (AVGO) | 0.86% | 1,470 |
| Brookfield Renewable Partners | (BEP) | 0.84% | 1,432 |
| Honeywell International Inc. | (HON) | 0.80% | 1,370 |
| Bank of America Corp. | (BAC) | 0.80% | 1,369 |
| Daimler | (OTCPK:DDAIF) | 0.73% | 1,240 |
| 3M Co. | (MMM) | 0.72% | 1,237 |
| BP 1 | (BP) | 0.71% | 1,214 |
| New Residential Investment Corporation | (NRZ) | 0.69% | 1,178 |
| BP 2 | (BP) | 0.66% | 1,126 |
| The Coca-Cola Co. | (KO) | 0.66% | 1,122 |
| B&G Foods, Inc. | (BGS) | 0.63% | 1,079 |
| Target Corporation | (TGT) | 0.62% | 1,062 |
| Dominion Energy Inc. | (D) | 0.61% | 1,049 |
| Verizon Communications Inc. | (VZ) | 0.59% | 1,008 |
| Realty Income Corp. | (O) | 0.56% | 949 |
| NextEra Energy Partners LP | (NEP) | 0.54% | 926 |
| Gladstone Commercial Corporation | (GOOD) | 0.54% | 920 |
| Unilever plc ADR | (UL) | 0.54% | 916 |
| Starwood Property Trust, Inc. | (STWD) | 0.54% | 914 |
| Royal Bank of Canada | (RY) | 0.53% | 911 |
| Apple Hospitality REIT | (APLE) | 0.49% | 841 |
| CVS Health Corp. | (CVS) | 0.48% | 827 |
| Canadian Imperial Bank of Commerce | (CM) | 0.44% | 750 |
| Stryker | (SYK) | 0.42% | 722 |
| Walgreens Boots Alliance Inc | (WBA) | 0.41% | 700 |
| BASF | (OTCQX:BASFY) | 0.37% | 639 |
| Pfizer Inc. | (PFE) | 0.36% | 621 |
| Medtronic | (MDT) | 0.35% | 599 |
| AGNC Investment Corporation | (AGNC) | 0.32% | 552 |
| NextEra Energy | (NEE) | 0.31% | 534 |
| Alibaba Group Holding Ltd. | (BABA) | 0.29% | 487 |
| Exxon Mobil Corporation | (XOM) | 0.28% | 484 |
| Antero Midstream Corporation | (AM) | 0.28% | 477 |
| Kinder Morgan Inc. | (KMI) | 0.27% | 459 |
| Walt Disney Co. | (DIS) | 0.26% | 449 |
| General Electric Company | (GE) | 0.26% | 440 |
| Sixt | (OTC:SXTSY) | 0.24% | 402 |
| Annaly Capital Management | (NLY) | 0.22% | 375 |
| Bayer AG | (OTCPK:BAYZF) | 0.22% | 374 |
| Colgate-Palmolive Company | (CL) | 0.21% | 353 |
| BRT Realty Trust | (BRT) | 0.20% | 350 |
| Enterprise Products Partners L.P. | (EPD) | 0.20% | 335 |
| Omega Healthcare Investors Inc. | (OHI) | 0.19% | 317 |
| Mastercard | (MA) | 0.18% | 313 |
| MPLX LP | (MPLX) | 0.17% | 296 |
| Energy Transfer | (ET) | 0.17% | 290 |
| Brookfield Infrastructure Partners L.P. | (BIP) | 0.13% | 215 |
| Vonovia | (OTCPK:VONOY) | 0.12% | 203 |
| Apollo Commercial Real Est. Finance Inc. | (ARI) | 0.11% | 195 |
| Uniti Group Inc. | (UNIT) | 0.11% | 191 |
| Apollo Investment | (AINV) | 0.11% | 187 |
| Prudential Financial | (PRU) | 0.10% | 174 |
| Fresenius SE | (OTCPK:FSNUF) | 0.10% | 168 |
| Lumen Technologies | (LUMN) | 0.09% | 148 |
| Fresenius Medical Care | (FMS) | 0.06% | 99 |
| Boeing | (BA) | 0.06% | 96 |
| Bank of Montreal | (BMO) | 0.05% | 92 |
| Newtek Business Services | (NEWT) | 0.05% | 91 |
| Equitrans Midstream Corporation | (ETRN) | 0.05% | 86 |
| Diversified Healthcare Trust | (DHC) | 0.04% | 76 |
| The GEO Group Inc. | (GEO) | 0.02% | 42 |
| Service Properties Trust | (SVC) | 0.01% | 24 |
| Macquarie Infrastructure | (MIC) | 0.01% | 18 |
Be the first to comment