

da-kuk/E+ via Getty Images
Portfolio Changes in March
Starting in May 2021, I have been reducing the volume of my monthly investment activity given elevated valuations and my desire to save cash either for investment or some other endeavors. The stock markets have been very kind to me over the last couple of years as I did manage to build some decent positions at a good cost basis. Nowadays, however, while the markets are continuing to move up with every dip getting bought ferociously, I hardly see any attractive prices.
That’s why my investment activity has come down and is almost exclusively geared towards dividend stocks. Now that a war has broken out between Russia and Ukraine, market movements are more or less solely impacted by geopolitical developments in Ukraine and Russia as well as the response from the West in terms of sanctions and support. It is tough commenting on stock market developments when you know that the reasons for these moves are a senseless war with massive and tragic humanitarian impacts, senseless loss of life on both sides, the dawn of a new world order, and financial and economic implications around the world.
The war in Ukraine, the humanitarian toll, the economic toll amid surging inflation and interest rates and the gradual development of a seemingly new world order continue to dominate market movements. Tech stocks remain very volatile but solid dividend stocks in combination with a strong dollar continue to outperform.
Against the backdrop of these events, I have decided to limit my monthly purchases in early March while waiting for more attractive buying opportunities. I have been more active in March by predominantly buying dividend stocks and largely avoiding any tech stocks. Therefore, I have paused my savings plans on Apple (AAPL) and Microsoft (NASDAQ:MSFT) and instead added heavily to Gladstone Commercial Corporation (GOOD) and W. P. Carey (NYSE:WPC). Both are still yielding above 5% and as long as they are sporting that kind of yield I am planning to increase my monthly contributions wherever possible.
Unfortunately, I can’t invest thousands of dollars every month but with total net investments of $2,260 in March, I am feeling very confident. These purchases are spread across 29 stocks and while many will probably question the usefulness of such tiny monthly contributions on an individual stock basis, I have no plans to change any of that. My dividend income continues to grow and my portfolio is at an all-time high.
Due to the nature of how the monthly investment plan process works, I am investing relatively equally into these stocks at two points of time during the month – at the beginning of the month and mid-month – which breaks down as shown below. Figures are in Euro and show that, for instance, at the beginning of the month, I am investing between 50 and 75 EUR each into Microsoft, The Home Depot (NYSE:HD), Visa (NYSE:V), W. P. Carey, and BP (NYSE:BP). Mid-month, I am adding between 33 and 40 EUR each into STAG Industrial (NYSE:STAG), AT&T (T), NextEra Energy (NYSE:NEE), Toronto-Dominion Bank (NYSE:TD), Main Street Capital (NYSE:MAIN) and JPMorgan (NYSE:JPM).
I have added several investment plans starting mid-September 2020 which include AGNC Investment Corp. (NASDAQ:AGNC), Ares Capital (NASDAQ:ARCC), Medical Properties Trust (NYSE:MPW), The Bank of Nova Scotia (NYSE:BNS) and The Trade Desk (NASDAQ:TTD). Investments here will be focused on high-yield as well as high-growth stocks in the technology, therapeutic and renewables sectors.
All those purchases substantially raised forward annual dividend income, breaking down as follows:
Added Dividend Income (Designed by author)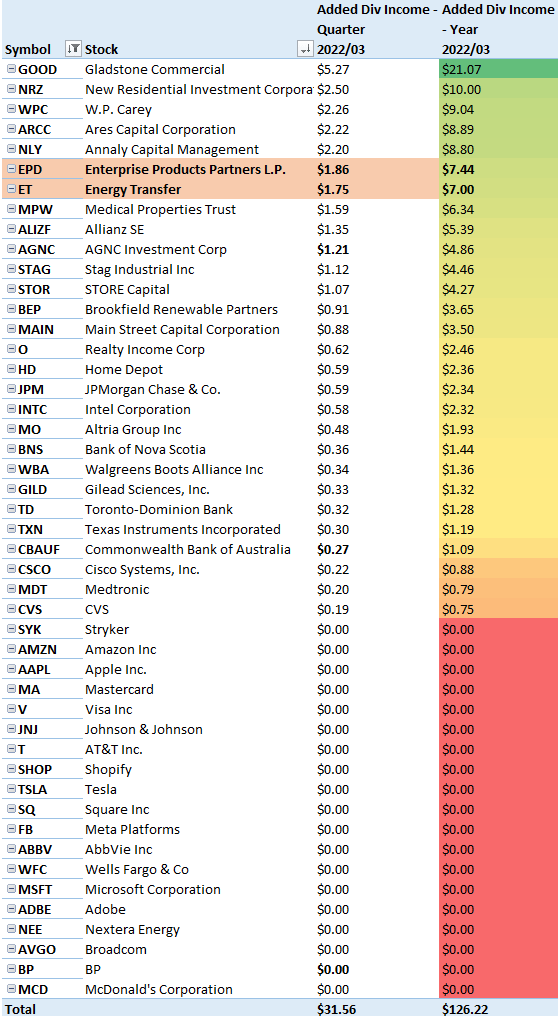
All net purchases in March can be found below:
Net Purchases in March (Designed by author)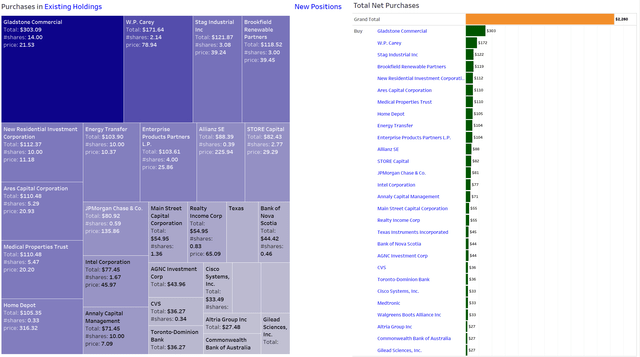
Dividend Income: What Happened on The Dividend Side?
Dividend income hit a new March record of $602 and is up an explosive 38% both annual and sequentially. sequentially. On a sequential basis, the main driver for that strong growth is the big semi-annual dividend payment from one of my best-performing financial stocks, the Commonwealth Bank of Australia (OTCPK:CBAUF). Disregarding that dividend payment, sequential growth narrows down to a still very solid 15%.
On an annual basis, the biggest driver is the Ares Capital Corporation, a stock I am running on a bi-weekly savings plan and where my contributions quickly translated into meaningful dividend income. The goal is to accumulate that position until it generates at least $100 in quarterly dividends which is a psychologically important level for me that no single stock has reached so far on a quarterly basis.
Dividend Income (Designed by author) The growing share of ARCC dividends can also be seen when just looking at the top three dividend payers in March and other quarter-ending months. After two years where the average dividend from the top three 3 stocks didn’t reach past heights, March 2022 set a new record with an average dividend from those three stocks together worth $125 as seen below: Top 3 Dividend Payers (Designed by author)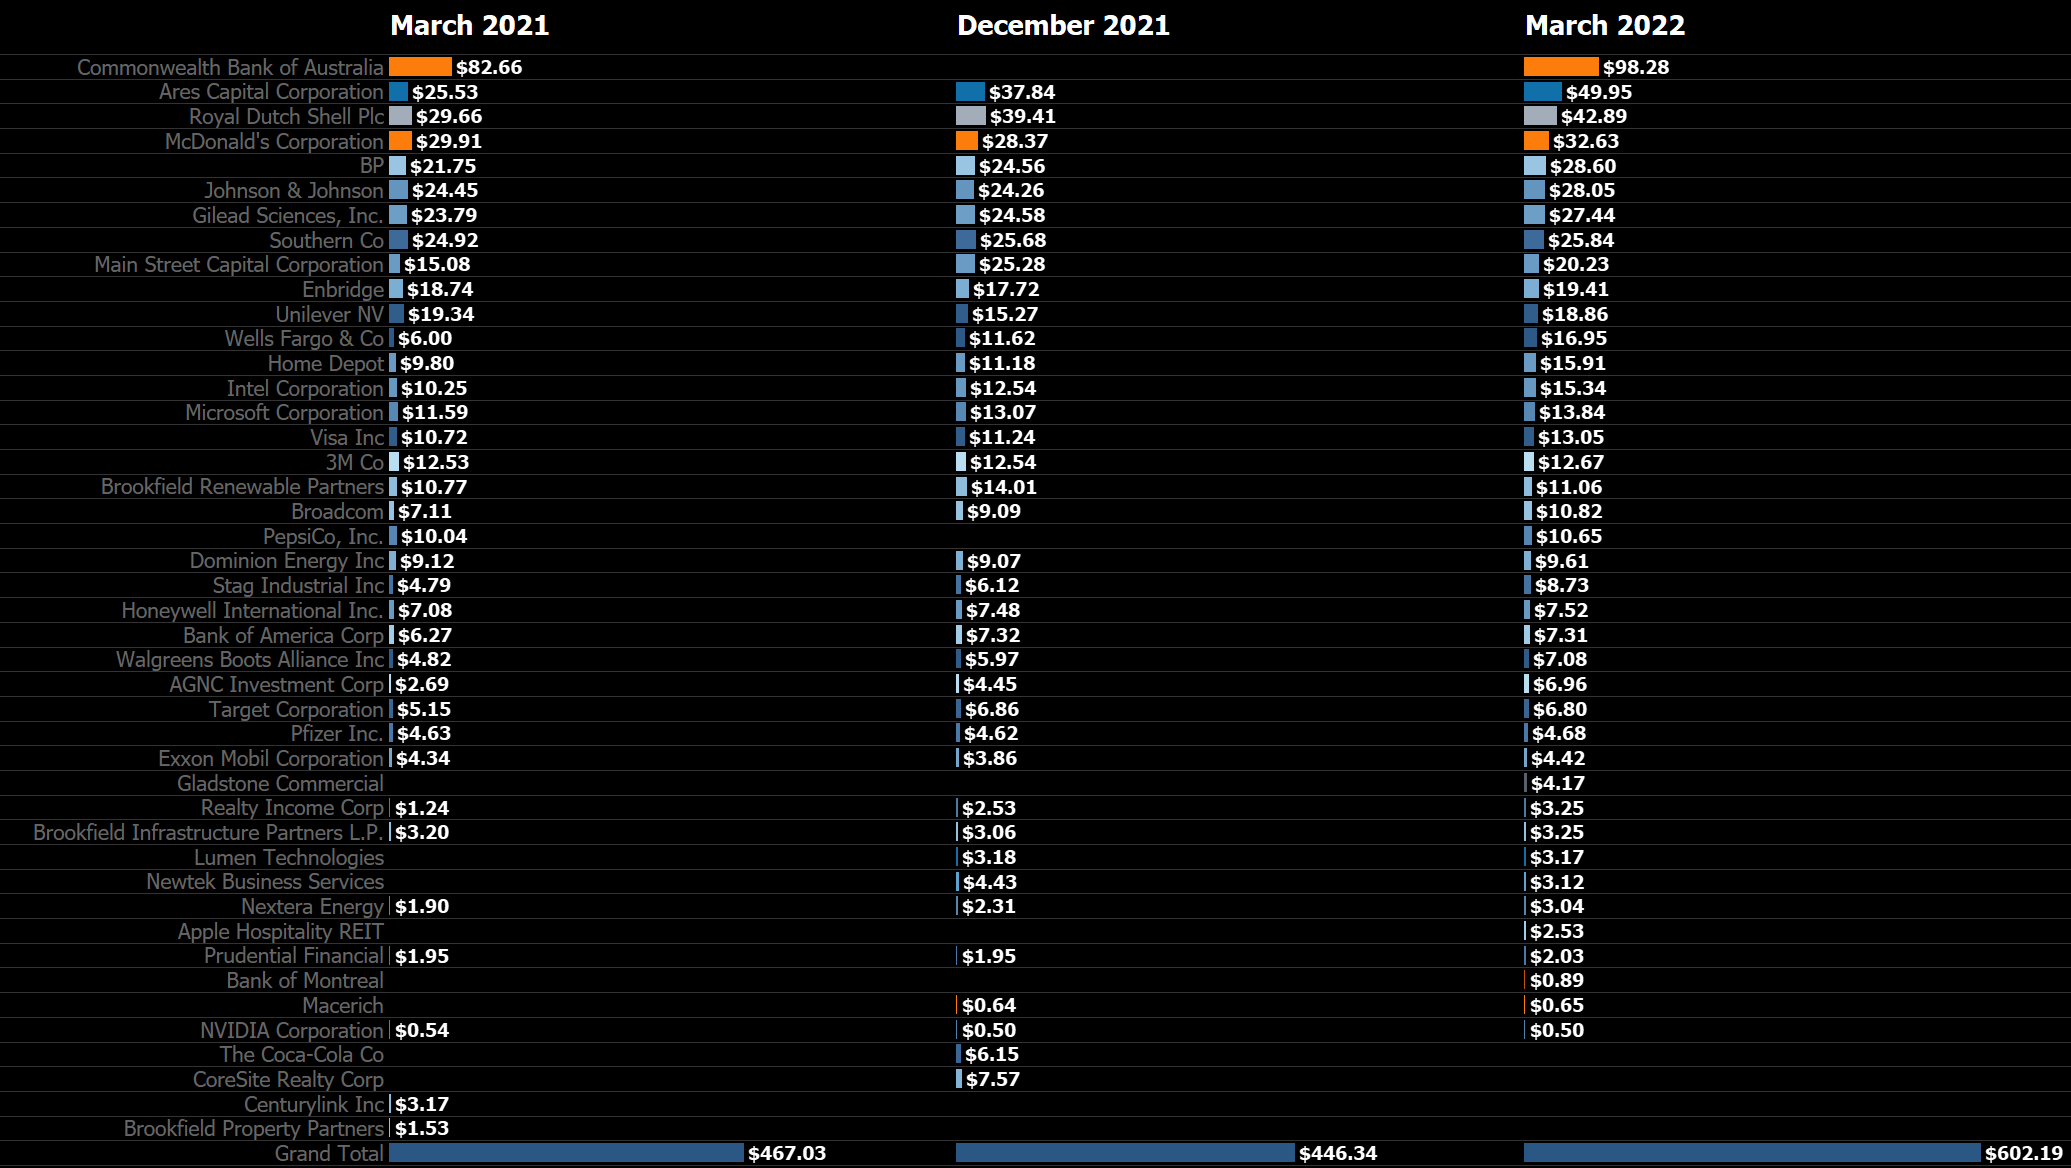

Here is a look at my favorite chart: the net dividend income development by month over time between 2015 and 2022, where you can easily see the development of my dividend income as well as the average annual dividend in a given year:
Dividend Development (Designed by author) Next, I have scattered all the individual dividend payments I have ever received and colored them by year, rearranging the years side by side rather than horizontally as in previous updates: Dividend Payment Bubbles (Designed by author) This view looks very cluttered at first, but it is very rich in information. It shows every single dividend payment I have received since I started my journey in 2015 in the shape of a circle colored differently by year and size, based upon their contribution. The view is broken down by month and by year (not by year and by month), and thus allows to better see the development over time. For every year of a certain month, a white rectangle indicates the average monthly dividend. The area where dividends fall below that average is filled dark red, whereas the area above is colored dark green. Personally, I absolutely love this redesigned view of my old “bubbles chart,” as it is much clearer to identify developments and trends in my dividend income. March Dividends (Designed by author) Now, zooming in on March, we can immediately see a number of big green circles in a sea of black. The bigger the circle and the bigger the distance to the previous circle for the same stock, the bigger is the change in dividend income compared to the prior years.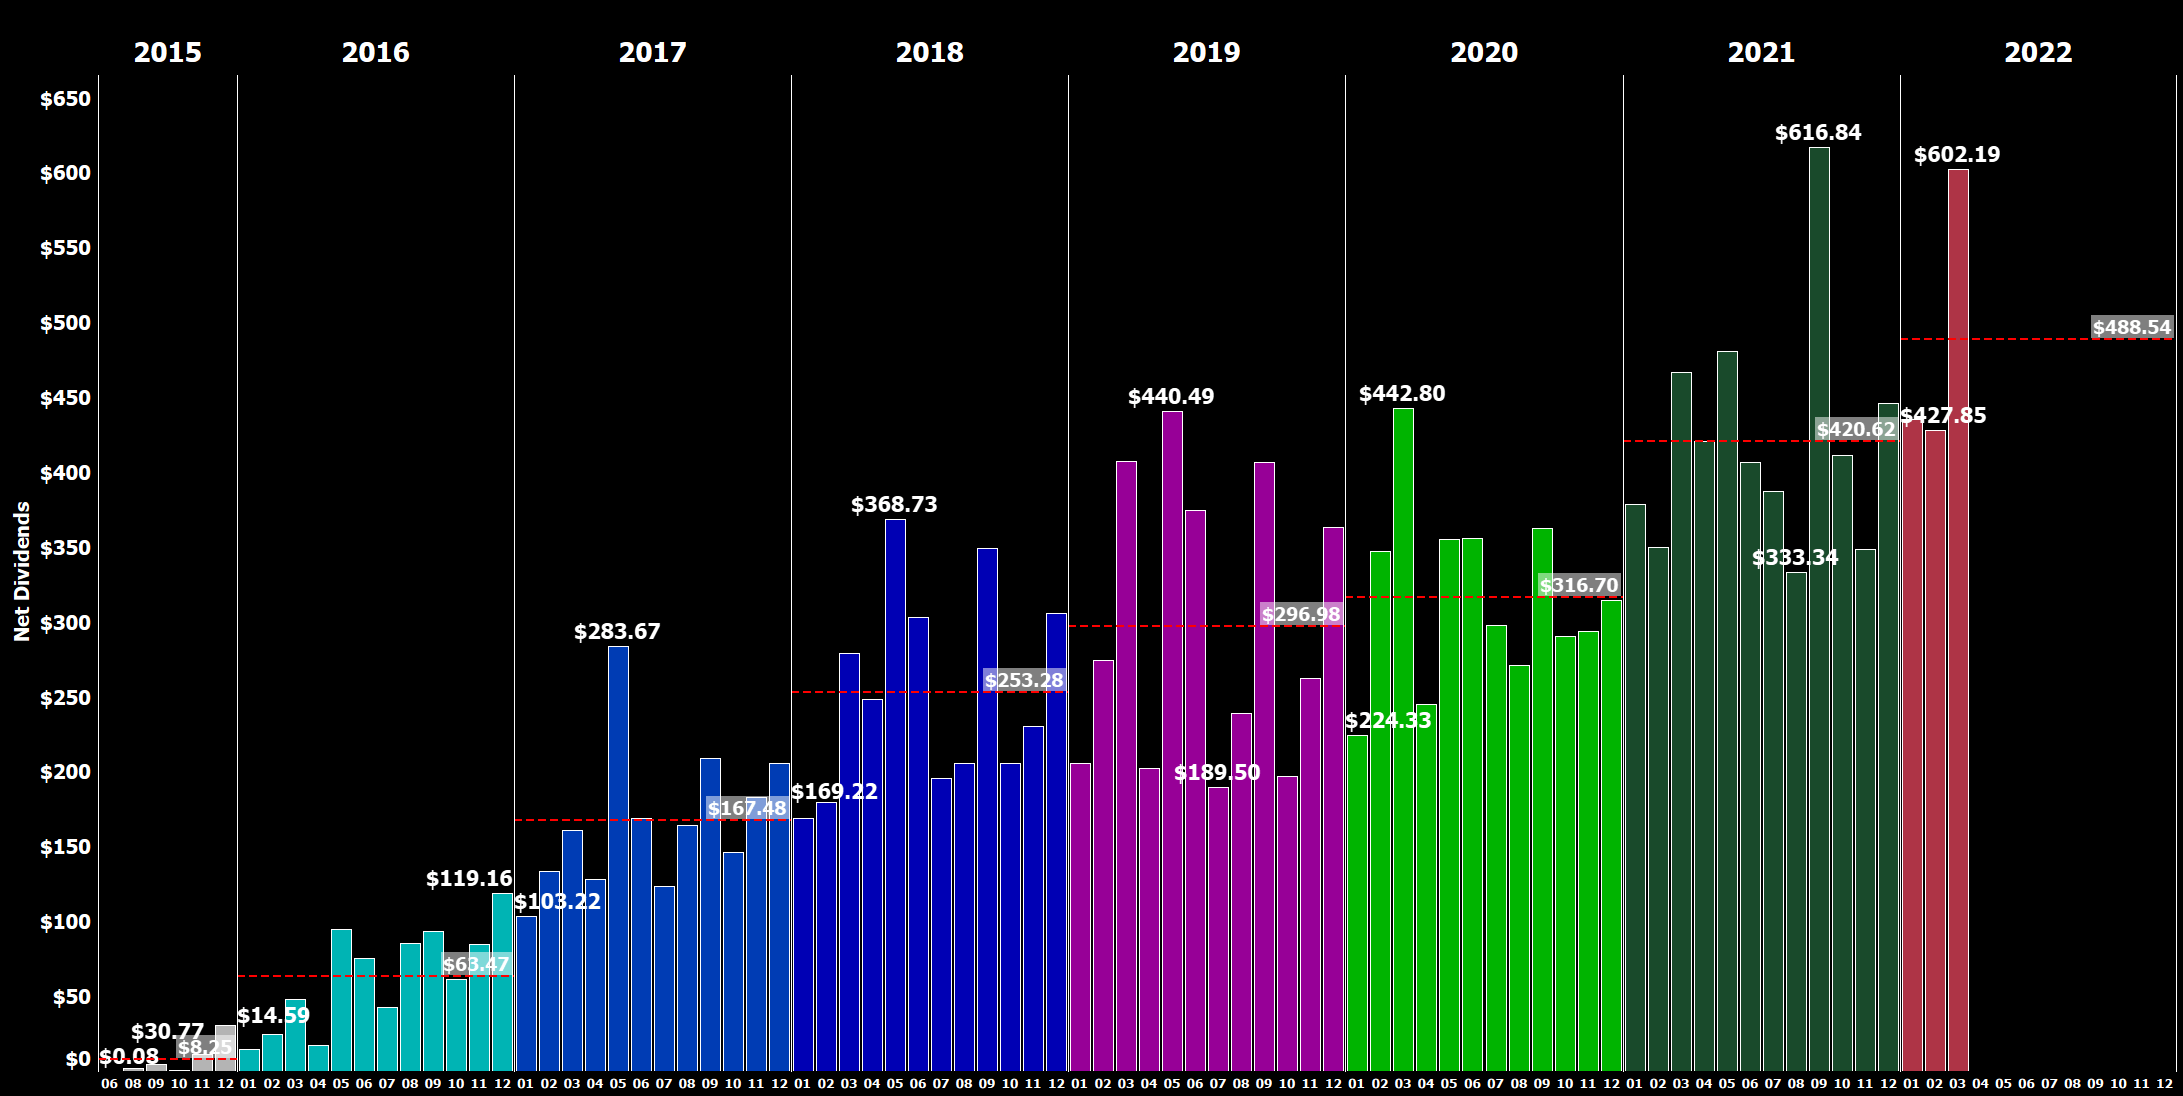

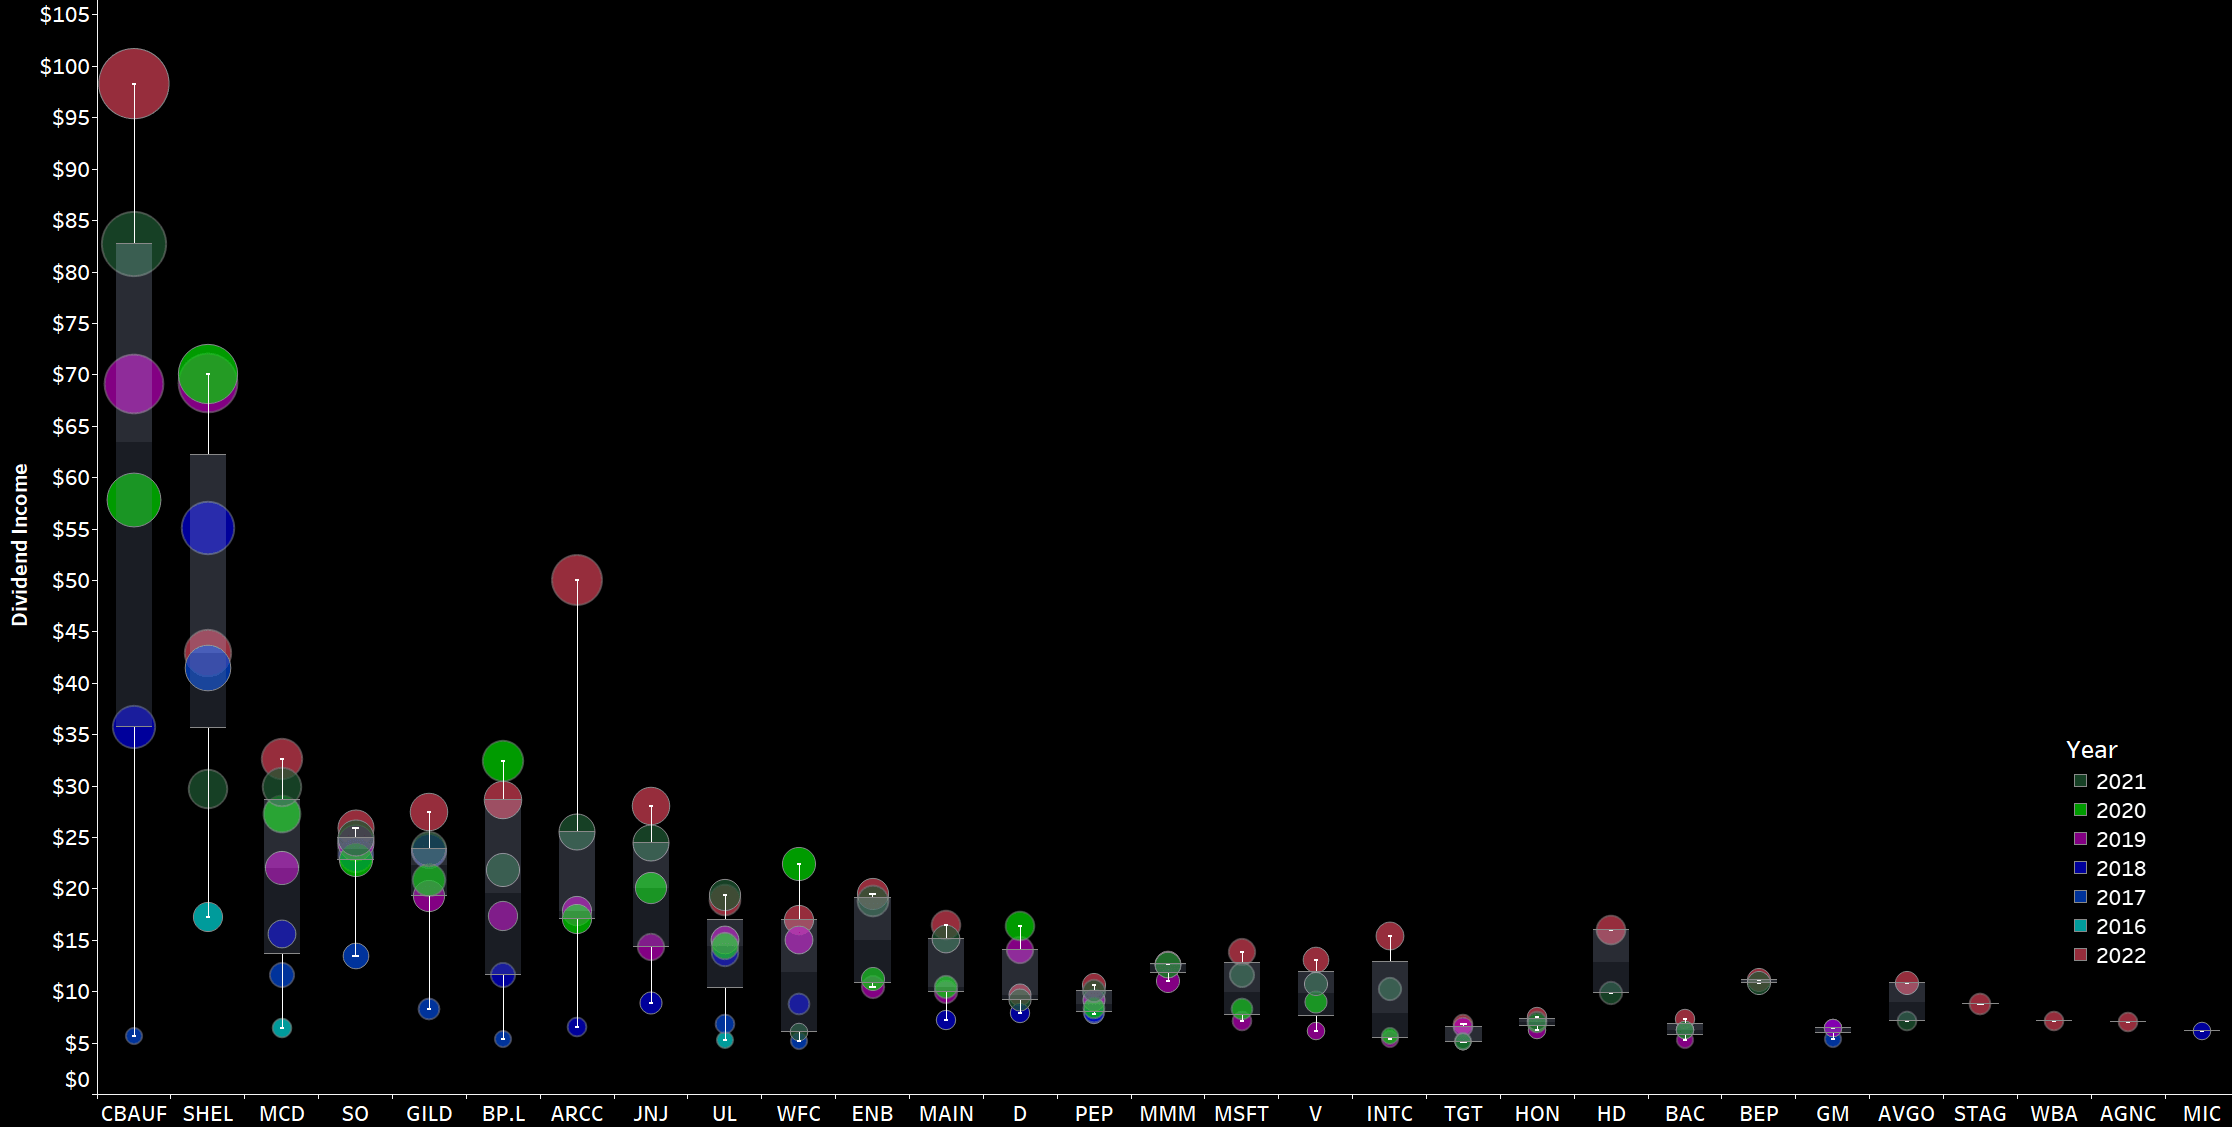
The biggest jump in annual dividend income is attributable to the Ares Capital Corporation which is driven exclusively by ongoing investments over the last 12 months. Regarding Shell (SHEL), we can easily see that despite the big dividend hike last year, dividend income still significantly trails the records set between 2017 and 2019 despite not having sold any shares. What’s more, we can also easily identify the big jump vs. 2020 as Shell is back on the track of growing its dividend and, given very favorable macroeconomic conditions throughout the year, I do expect another significant bump in dividend income this year.
Another way to express the monthly dividend income is in terms of Gifted Working Time (GWT).
I am assuming an average hourly rate of $30.8 for 2022 here:
- In 2018, I generated 121 hours in GWT, equaling slightly more than $3,000 in annual net dividends.
- In 2019, I generated 142 hours in GWT, equaling almost $3,600 in annual net dividends.
- In 2020, I generated 152 hours in GWT, equaling roughly $3,800 in annual net dividends.
- In 2021, I generated 180 hours in GWT, equaling roughly $5,050 in annual net dividends.
- In 2022, I am targeting to reach at least $5,500 in annual net dividends, which equals roughly 179 hours in GWT. Despite the projected increase in annual net dividends I expect overall GWT to decrease following higher calculated hourly rates, a figure I project to rise by 10% given soaring inflation. The annual target of $5,500 is on the cautious side as I need more visibility into how the year is progressing, particularly as I expect ongoing monthly investments to decline given elevated stock levels and rising inflationary and geopolitical pressures.
Across the years, the YTD Dividend Race as I like to call it looks as follows. While 2020 was fairly disappointing, 2021 was phenomenal as it benefited from a rather low baseline from the prior year. For 2022, I am targeting a conservative high single-digit growth rate for now, which is a very cautious estimate to begin with. YTD growth based on the first quarter is significantly above my expectations coming in at 23% Y/Y, and while I expect some moderation over the course of the year, solid double-digit growth in annual dividend income is almost guaranteed already for this year.
YTD Dividend Gains (Designed by author)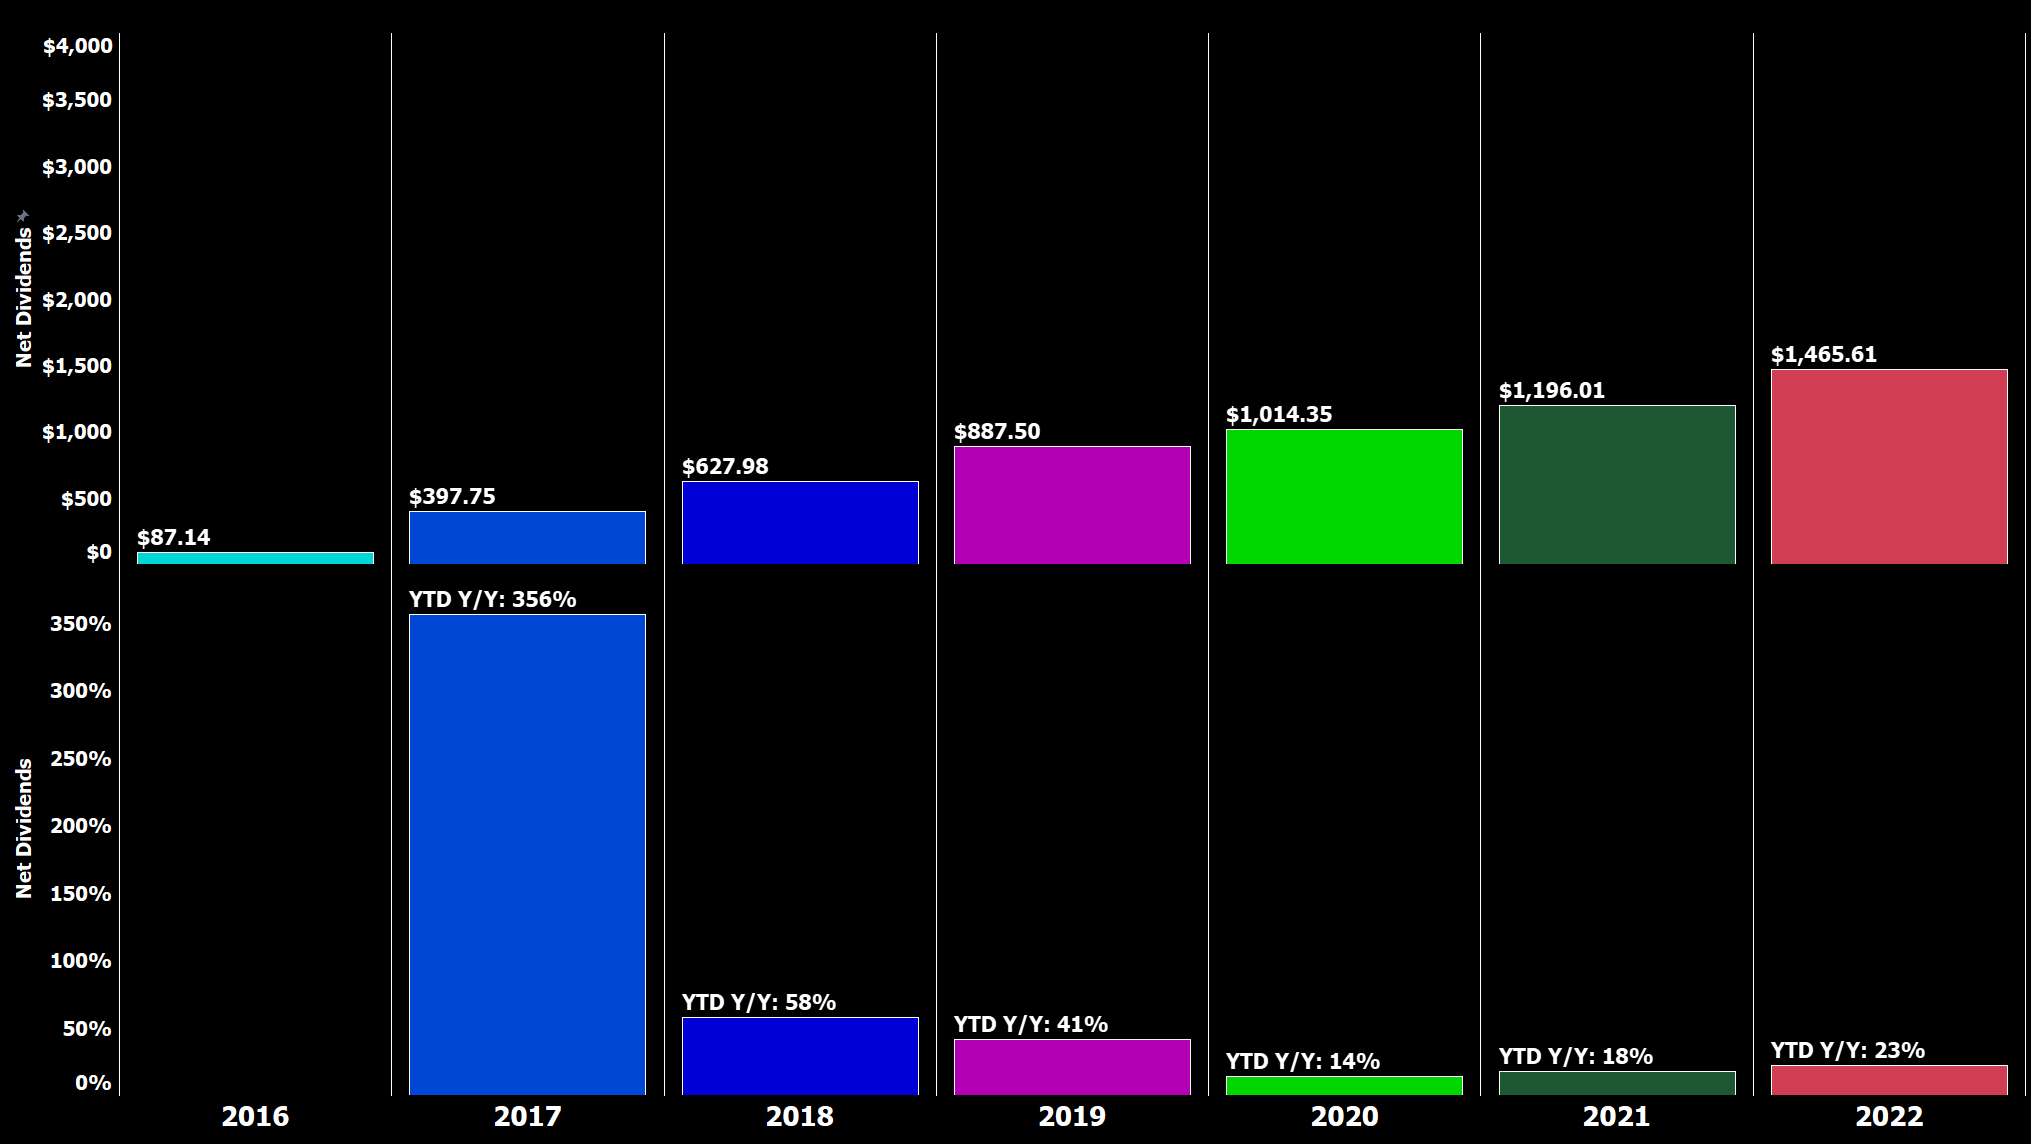
I have modified the YTD Dividend Race chart. Top left shows the YTD Dividend Race in the old format. At the top right, we can see how YTD dividend income developed on a daily basis and whereby we can easily identify that most of my dividend income is generated mid-month and towards the end of the month. At the bottom, that development is broken down by every individual month which makes big jumps clearly identifiable. What do you think about that type of visualization?
YTD Dividend Race (Designed by author) Expressed in GWT, it presents itself as follows: Gifted Working Time (Designed by author)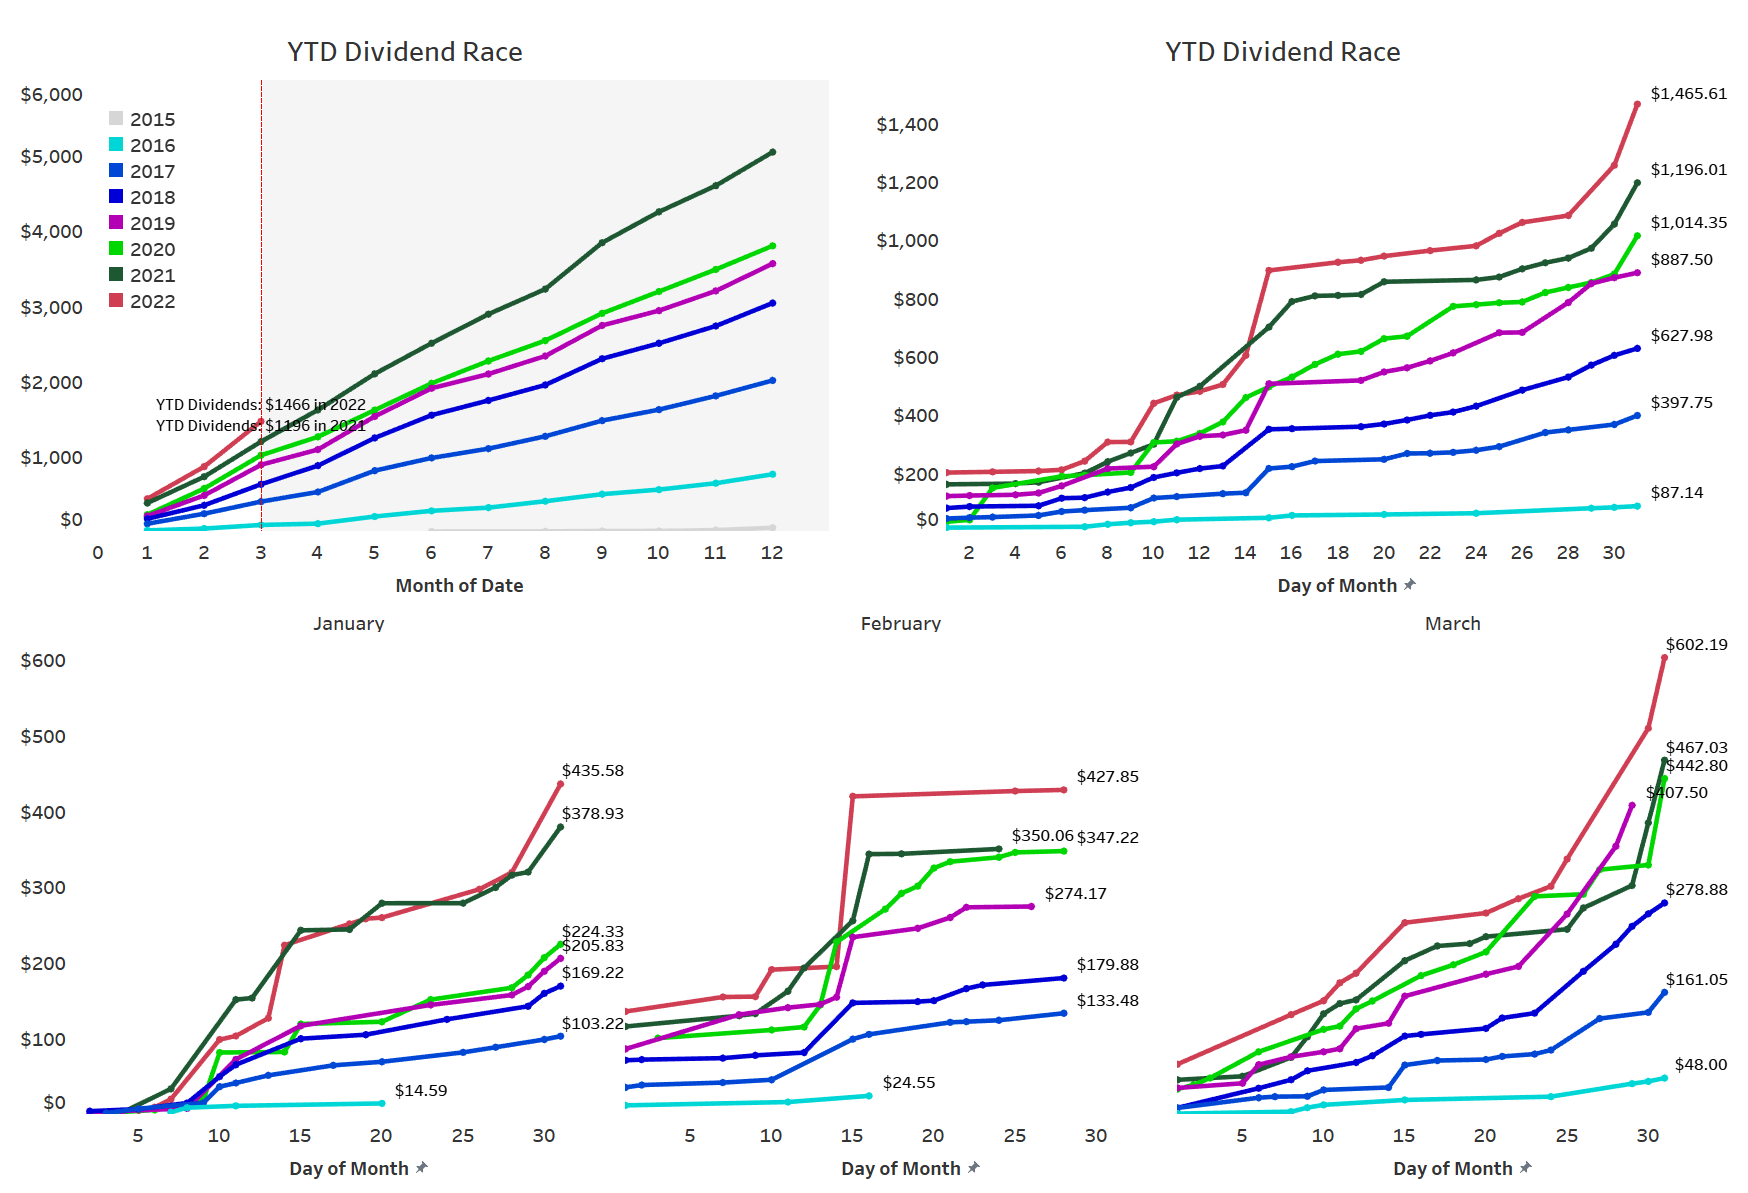
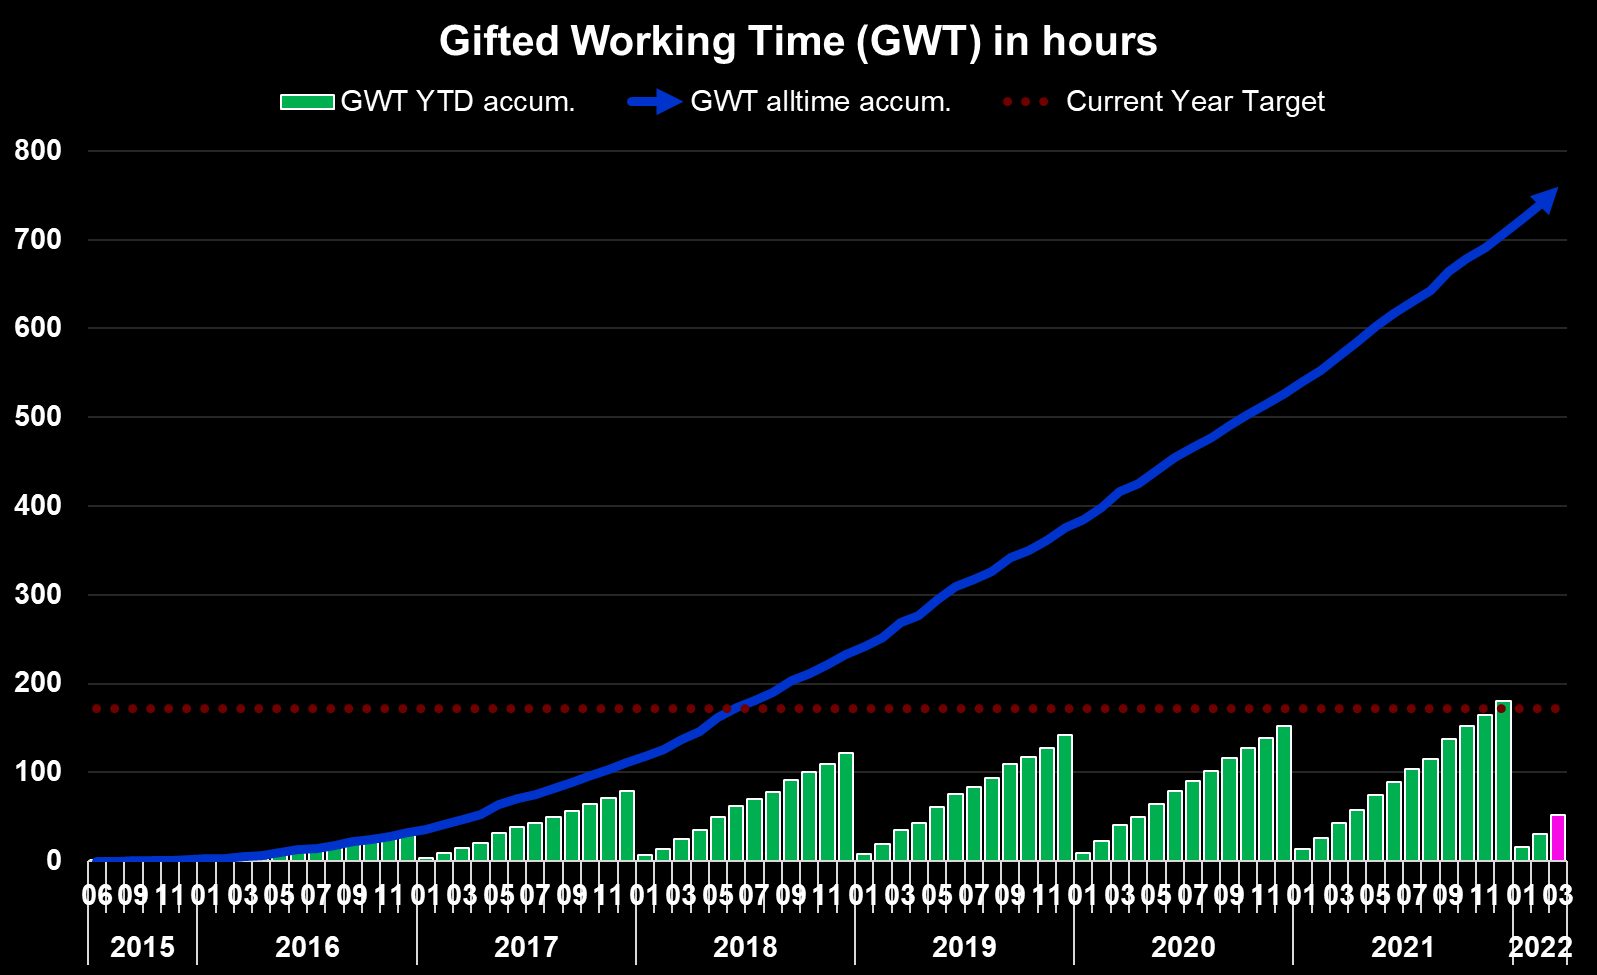
What this shows is as follows:
- All time (blue area) – Around 760 hours, or 95 days, of active work have been replaced with passive income since the start of my dividend journey. Assuming a five-day workweek this translates into 19 weeks of vacation funded via dividends.
- YTD (green bars) – Around 52 hours, or 6.5 days, of active work have been replaced with passive income in 2022 already, which equals more than 1 week worth of active work funded via dividends.
- Highlighted in pink is the accumulated YTD total at the end of the current reporting month (March).
Upcoming April Dividends
As every month, April is packed with dividend payments heavily concentrated around the 15th and at month-end when the dividend checks from Canada’s big banks as well as JPMorgan will be arriving over a period of just 3-4 days.
Given the majority of my savings plans feature companies that pay dividends in January such as W. P. Carey, Altria (MO), Cisco Systems (CSCO), JPMorgan, Toronto-Dominion Bank, Bank of Nova Scotia, Stryker (SYK), Medtronic (MDT) as well as ongoing investments into stocks like New Residential Investment Corp. (NRZ), Annaly Capital (NLY) and Preferred Apartment Communities (APTS), it surely is going to be a big month that should easily set a new all-time dividend record for the month of April.
The snapshot below is taken from my newly and free-for-all released Dividend Calendar (make sure to follow instructions in the video) and shows my expected dividend payments in April.
My Dividend Calendar (Designed by author)
At the end of March, my dividend portfolio is composed as follows:
| Company Name | Ticker | % Market Value | Market Value (€) |
| Apple Inc. | (AAPL) | 12.15% | 23,535 |
| Visa Inc | (V) | 4.30% | 8,333 |
| AbbVie Inc | (ABBV) | 4.05% | 7,856 |
| Microsoft Corporation | (MSFT) | 3.73% | 7,231 |
| McDonald’s Corp | (MCD) | 3.23% | 6,252 |
| Cisco Systems, Inc. | (CSCO) | 3.08% | 5,968 |
| AT&T Inc. | (T) | 2.91% | 5,648 |
| Commonwealth Bank of Australia | (OTCPK:CBAUF) | 2.73% | 5,288 |
| Johnson & Johnson | (JNJ) | 2.57% | 4,976 |
| Main Street Capital Corporation | (MAIN) | 2.00% | 3,877 |
| Shell | (SHEL) | 1.98% | 3,837 |
| W. P. Carey | (WPC) | 1.92% | 3,727 |
| NVIDIA Corporation | (NVDA) | 1.87% | 3,631 |
| Altria Group Inc | (MO) | 1.85% | 3,582 |
| Wells Fargo & Co | (WFC) | 1.79% | 3,460 |
| Toronto-Dominion Bank | (TD) | 1.77% | 3,437 |
| Southern Co | (SO) | 1.77% | 3,425 |
| Texas Instruments Incorporated | (TXN) | 1.69% | 3,283 |
| STAG Industrial Inc | (STAG) | 1.60% | 3,106 |
| JPMorgan Chase & Co. | (JPM) | 1.55% | 3,005 |
| Bank of Nova Scotia | (BNS) | 1.55% | 3,001 |
| Siemens Healthineers | (OTCPK:SEMHF) | 1.45% | 2,800 |
| Home Depot | (HD) | 1.35% | 2,623 |
| Allianz SE | (OTCPK:ALIZF) | 1.24% | 2,395 |
| Gilead Sciences, Inc. | (GILD) | 1.22% | 2,363 |
| Blackstone Group LP | (BX) | 1.20% | 2,322 |
| Ares Capital Corporation | (ARCC) | 1.18% | 2,285 |
| Preferred Apartment Communities | (APTS) | 1.12% | 2,169 |
| Sino AG | (XTP.F) | 1.11% | 2,145 |
| Intel Corporation | (INTC) | 1.10% | 2,136 |
| Medical Properties Trust | (MPW) | 1.08% | 2,095 |
| Procter & Gamble Co | (PG) | 0.94% | 1,817 |
| Morgan Stanley | (MS) | 0.94% | 1,813 |
| PepsiCo, Inc. | (PEP) | 0.93% | 1,795 |
| Enbridge | (ENB) | 0.91% | 1,763 |
| Canadian Imperial Bank of Commerce | (CM) | 0.90% | 1,753 |
| BMW | (OTCPK:BMWYY) | 0.87% | 1,693 |
| Broadcom Inc | (AVGO) | 0.87% | 1,677 |
| Bank of America Corp | (BAC) | 0.86% | 1,668 |
| STORE Capital | (STOR) | 0.84% | 1,623 |
| Philip Morris International Inc. | (PM) | 0.79% | 1,528 |
| Target Corporation | (TGT) | 0.79% | 1,526 |
| Brookfield Renewable Partners | (BEP) | 0.77% | 1,485 |
| Honeywell International Inc. | (HON) | 0.73% | 1,421 |
| 3M Co | (MMM) | 0.70% | 1,356 |
| Daimler | (OTC:DTRUY) | 0.66% | 1,280 |
| BP1 | (BP) | 0.64% | 1,242 |
| New Residential Corporation | (NRZ) | 0.62% | 1,198 |
| Dominion Energy Inc | (D) | 0.61% | 1,173 |
| B&G Foods, Inc. | (BGS) | 0.60% | 1,167 |
| The Coca-Cola Co | (KO) | 0.58% | 1,129 |
| BP2 | (BP) | 0.57% | 1,108 |
| NextEra Energy Partners LP | (NEP) | 0.55% | 1,065 |
| Verizon Communications Inc. | (VZ) | 0.53% | 1,019 |
| Royal Bank of Canada | (RY) | 0.51% | 994 |
| Apple Hospitality REIT | (APLE) | 0.51% | 983 |
| Stryker | (SYK) | 0.49% | 952 |
| Starwood Property Trust, Inc. | (STWD) | 0.48% | 935 |
| Unilever NV ADR | (UL) | 0.48% | 929 |
| Realty Income Corp | (O) | 0.46% | 891 |
| CVS Health Corp | (CVS) | 0.45% | 865 |
| Gladstone Commercial Corporation | (GOOD) | 0.41% | 790 |
| BASF | (OTCQX:BASFY) | 0.38% | 732 |
| Medtronic | (MDT) | 0.37% | 727 |
| Walgreens Boots Alliance Inc | (WBA) | 0.36% | 704 |
| Pfizer Inc. | (PFE) | 0.34% | 654 |
| AGNC Investment Corporation | (AGNC) | 0.32% | 622 |
| Walt Disney Co | (DIS) | 0.32% | 621 |
| General Electric Company | (GE) | 0.30% | 587 |
| NextEra Energy | (NEE) | 0.30% | 586 |
| Antero Midstream Corporation | (AM) | 0.28% | 543 |
| Kinder Morgan Inc | (KMI) | 0.27% | 523 |
| Alibaba Group Holding Ltd | (BABA) | 0.26% | 499 |
| Exxon Mobil Corporation | (XOM) | 0.23% | 444 |
| Annaly Capital Management | (NLY) | 0.23% | 441 |
| SIXT | (OTC:SXTSY) | 0.21% | 414 |
| Bayer AG | (OTCPK:BAYZF) | 0.20% | 378 |
| Brookfield Infrastructure Partners L.P. | (BIP) | 0.19% | 366 |
| Enterprise Products Partners L.P. | (EPD) | 0.18% | 352 |
| Mastercard | (MA) | 0.18% | 348 |
| Colgate-Palmolive Company | (CL) | 0.18% | 346 |
| Omega Healthcare Investors Inc | (OHI) | 0.18% | 345 |
| MPLX LP | (MPLX) | 0.17% | 333 |
| Energy Transfer Partners | (ET) | 0.17% | 324 |
| BRT Realty Trust | (BRT) | 0.14% | 272 |
| Apollo Commercial Real Est. Finance Inc | (ARI) | 0.14% | 269 |
| Uniti Group Inc | (UNIT) | 0.13% | 255 |
| Prudential Financial | (PRU) | 0.11% | 215 |
| Fresenius SE | (OTCPK:FSNUF) | 0.10% | 192 |
| Apollo Investment | (AINV) | 0.09% | 170 |
| Lumen Technologies | (LUMN) | 0.08% | 156 |
| Boeing | (BA) | 0.07% | 127 |
| Diversified Healthcare Trust | (DHC) | 0.06% | 125 |
| Newtek Business Services | (NEWT) | 0.06% | 122 |
| Fresenius Medical Care | (FMS) | 0.06% | 121 |
| Equitrans Midstream Corporation | (ETRN) | 0.06% | 110 |
| Vonovia | (OTCPK:VONOY) | 0.06% | 108 |
| Bank of Montreal | (BMO) | 0.05% | 106 |
| The GEO Group Inc | (GEO) | 0.02% | 42 |
| Service Properties Trust | (SVC) | 0.02% | 41 |
| Macquarie Infrastructure Holdings | (MIC) | 0.01% | 17 |
Be the first to comment