

da-kuk
Portfolio Changes in July
Investment activity picked up further in July with net investments increasing from $1,300 to around $1,600. The Euro remains exceptionally weak and inflation remains exceptionally high even though I expect some meaningful softening in Q3 as prices for oil and raw materials have come down rather significantly and should offset price increases for food, housing and utilities.
The earnings season which I feared could be a massive disappointment with misses across the board actually turned out very positive so far with especially tech stocks and the mega caps (except Meta (META)) rallying strongly. Dividend stocks, especially high-yielding REITs and BDCs, have been on a tear lately which boosts overall portfolio performance but is very negative to me at the end of the day as declining yields are something I really don’t like.
Apart from that July was rather quiet on the markets with stocks having one of their best month in recent years and rapidly catching up on their prior losing streaks. And while the war in Ukraine continues to go on with thousands of lives needlessly lost, a potentially far bigger crisis is emerging in the Strait of Taiwan as China is extremely agitated following the visit of a high-ranking US government official to Taiwan. Not only is this concerning for Taiwan which is currently essentially under a full-blown sea blockade – which is expected to dissipate after August 8 but who knows – but is seriously damaging US-China relations. Right now it is just saber-rattling with very fierce rhetoric but if this transitions into some type of real conflict (not necessarily militarily) this will certainly be detrimental to the world as a whole and shake markets.
I also added one additional holding to my growing portfolio, Hannon Armstrong Sustainable Infrastructure Capital (HASI), which got destroyed by a recent short report alleging HASI’s complex accounting hides its true financial health. Well, that might be true but I am also not an expert to assess this and instead entered a speculative bet and started buying the stock on the big dip. My top play in the renewables sector is Brookfield Renewable Partners (BEP) but HASI is operating in the same sector and I consider it to be a nice addition to my holdings in BEP though I don’t intend to overweight it like I do with BEP which remains one of my strongest conviction buys.
Apart from that all other purchases were triggered by the almost weekly savings plans.
Due to the nature of how the monthly investment plan process works, I am investing relatively equally into these stocks at two points of time during the month – at the beginning of the month and mid-month – which breaks down as shown below. Figures are in Euro and show that, for instance, at the beginning of the month, I am investing between 50 and 75 EUR each into Microsoft, The Home Depot (NYSE:HD), Visa (NYSE:V), W. P. Carey (WPC), and BP (NYSE:BP). Mid-month, I am adding between 33 and 40 EUR each into STAG Industrial (NYSE:STAG), AT&T (T), NextEra Energy (NYSE:NEE), Toronto-Dominion Bank (NYSE:TD), Main Street Capital (NYSE:MAIN) and JPMorgan (NYSE:JPM).
I have added several investment plans starting mid-September 2020 which include AGNC Investment Corp. (NASDAQ:AGNC), Ares Capital (NASDAQ:ARCC), Medical Properties Trust (NYSE:MPW), The Bank of Nova Scotia (NYSE:BNS) and The Trade Desk (NASDAQ:TTD). Investments here will be focused on high-yield as well as high-growth stocks in the technology, therapeutic and renewables sectors.
All those purchases substantially raised my forward annual dividend income, breaking down as follows:
Added Dividend Income (Designed by author)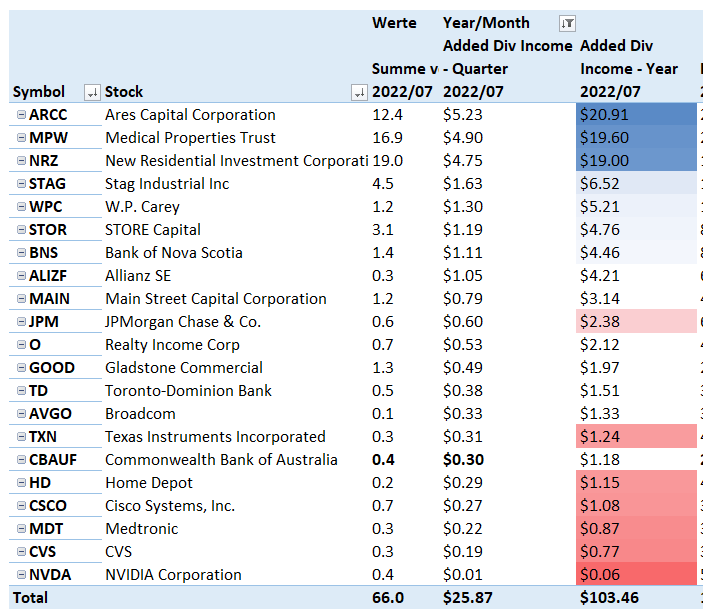
All net purchases in July can be found below:
July 2022 Net Purchases (Designed by author)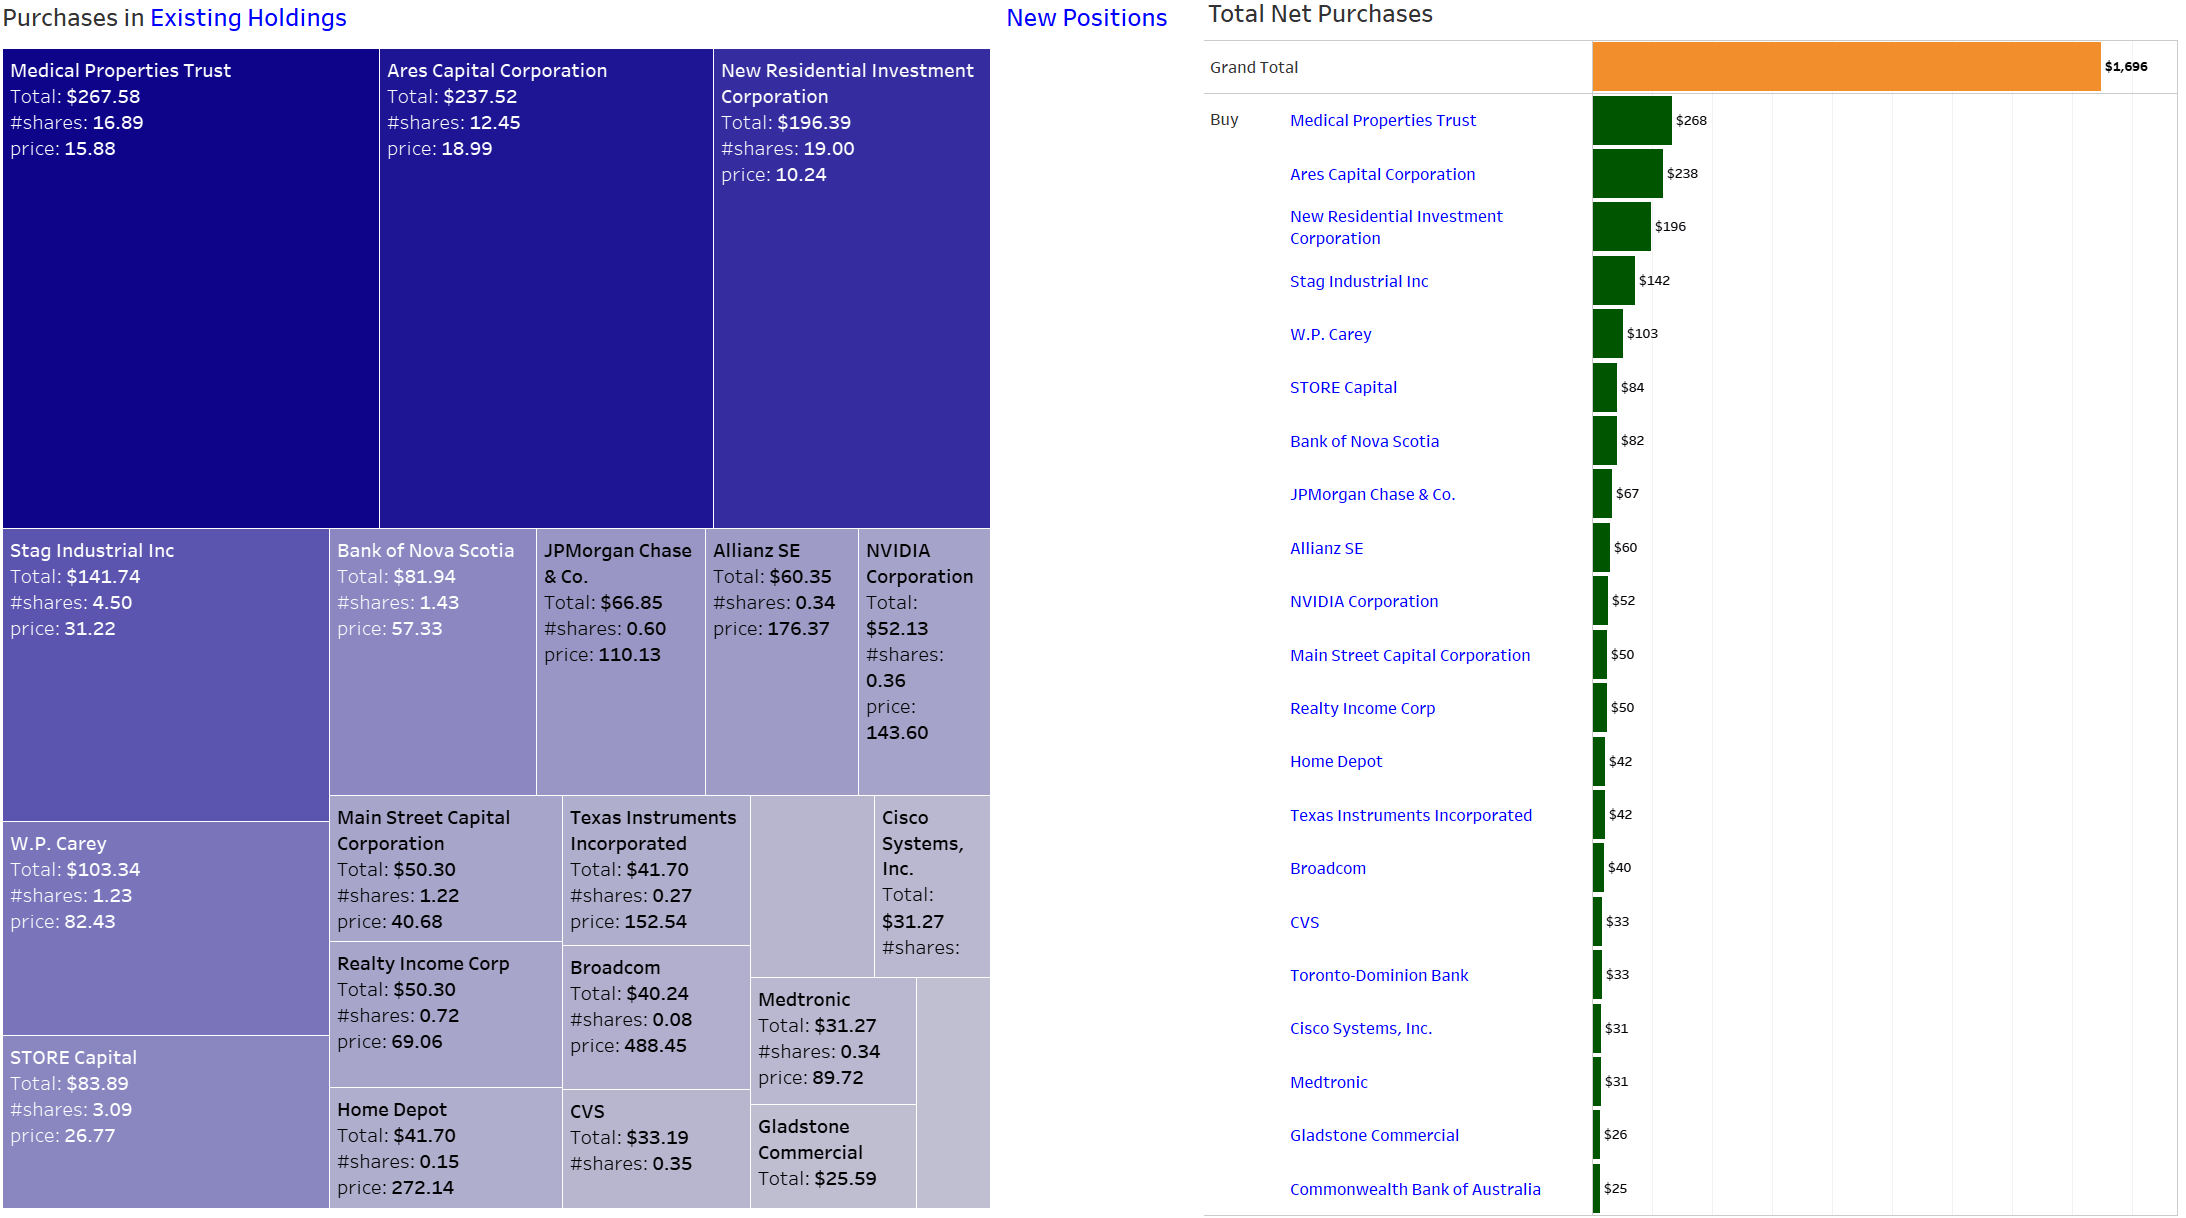
And there is more… Something I haven’t mentioned before is that I have started a new portfolio at the end of May with a broker where I previously only held a few shares of ET, EPD, MPLX and BEP as I wasn’t allowed to buy them at any of my other brokers. This new broker, Trading212 UK, offers a feature I was so excited to try out that I simply had to start. And that feature is “Auto Investing with Baskets and Dividend Reinvestment”. Well, that is not the official name but essentially what it allows me to do is to create as many basket with as much as 100 individual stocks as I like and then specify fixed periods for automatic investing. At first this sounds similar to my regular savings plans but it has a couple of advantages:
- lower fees
- a huge variety of available schedules (even daily is possible!)
- a better UI
- easy management as I don’t have to manage dozens of individual savings plan but just a few baskets
- and finally, automatic dividend reinvestment
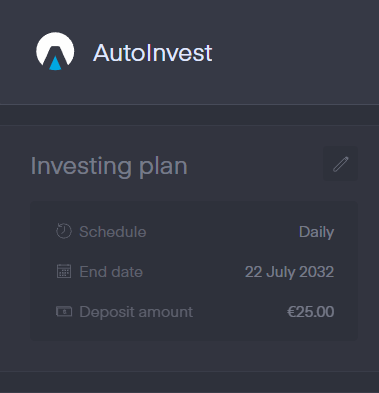
So I have been testing that for more than two months and it works effortlessly and is also a lot of fun to play around with. Here is a snapshot of one of my baskets for High Yield Dividends that I have created and where I invest 25€ daily.
Trading 212 (Trading 212) Holdings (Trading 212) AutoInvest (Trading 212)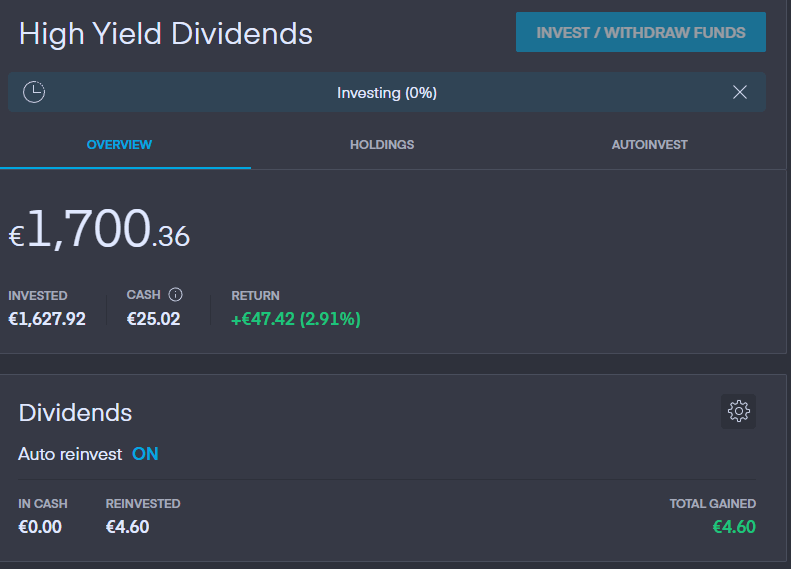
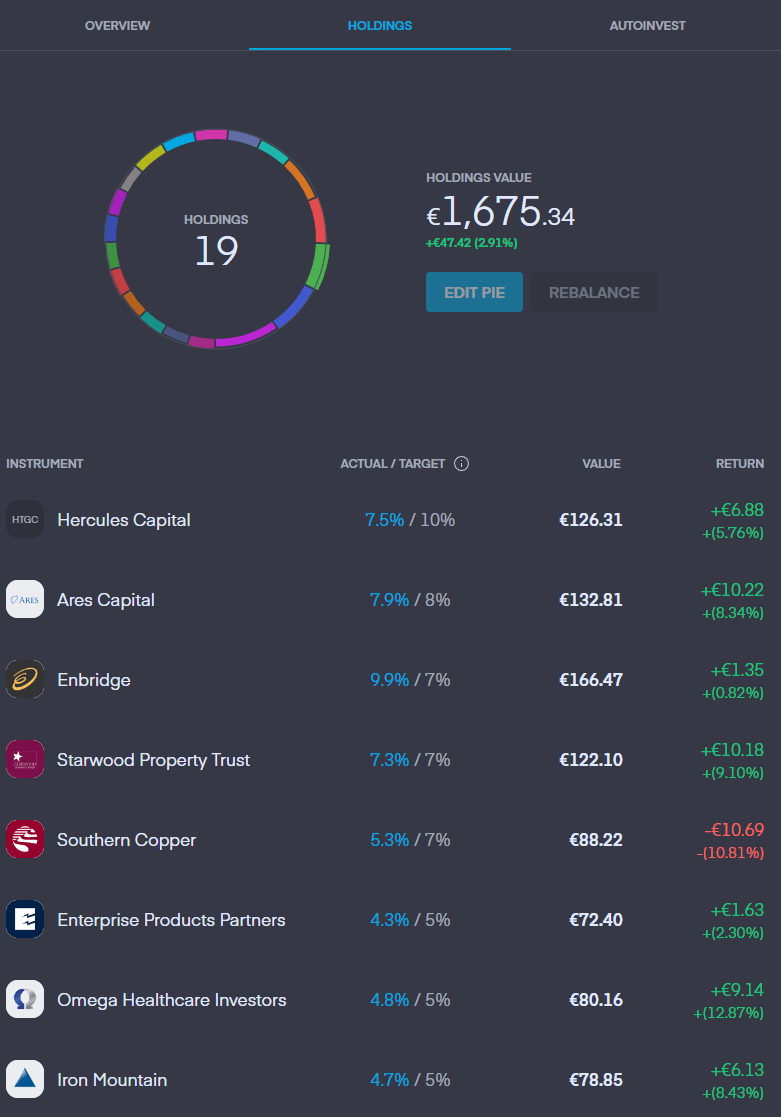
I have been channeling several thousand Euro into this since end of May but will have to slow down that rate now that markets are substantially higher and my cash position is substantially lower. I haven’t yet incorporated these purchases and dividends into my reporting but will do so in the course of this quarter. Does anybody else also have experiences with Trading212?
Dividend Income: What Happened on The Dividend Side?
Dividend income hit a new July record of $500 and is up an explosive 51% annually and up 11% sequentially.
The main income drivers are the 5 of the 6 dividend stocks (Ares Capital Corporation is the 6th one) that I am buying at least once every month: STAG Industrial (STAG), STORE Capital (STOR), Medical Properties Trust and New Residential Corporation now known as Rithm (RITM) and above all W. P. Carey.
The near-term goal for each of these positions is to reach at least $100 in quarterly dividend income with further big increases expected thereafter. I have no hesitation in buying them for the long-term even though I understand that rising rates and relatively high leverage for MPW and RITM and not everyone’s taste.
July 2022 Net dividends (Designed by author)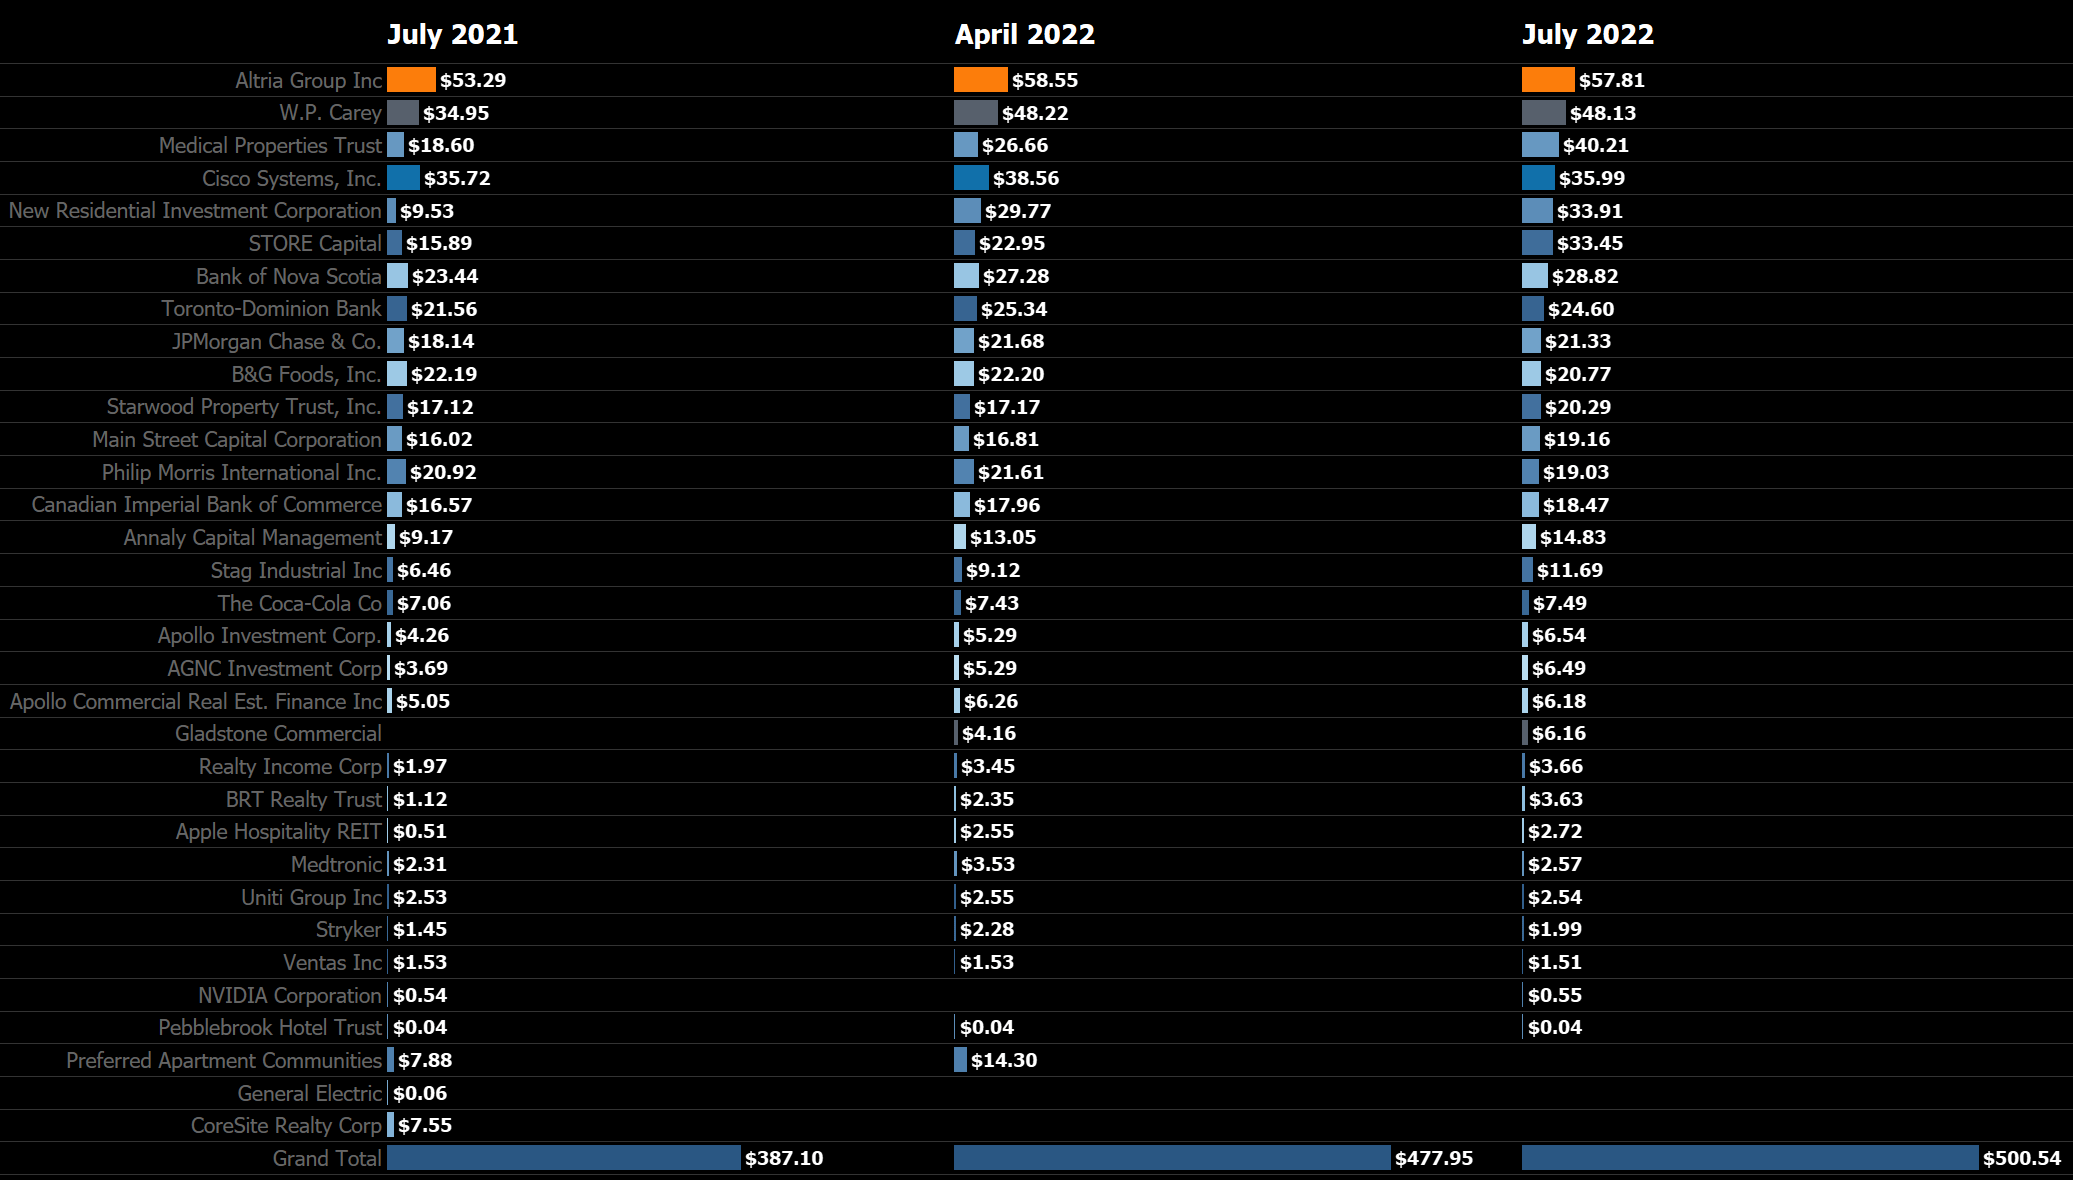
The focus on these stocks also shows when looking at the Top 3 Dividend Payers in July featuring both MPW and WPC and soon Altria’s spot will be taken over by STOR or RITM.
Top 3 Dividend Payers (Designed by author)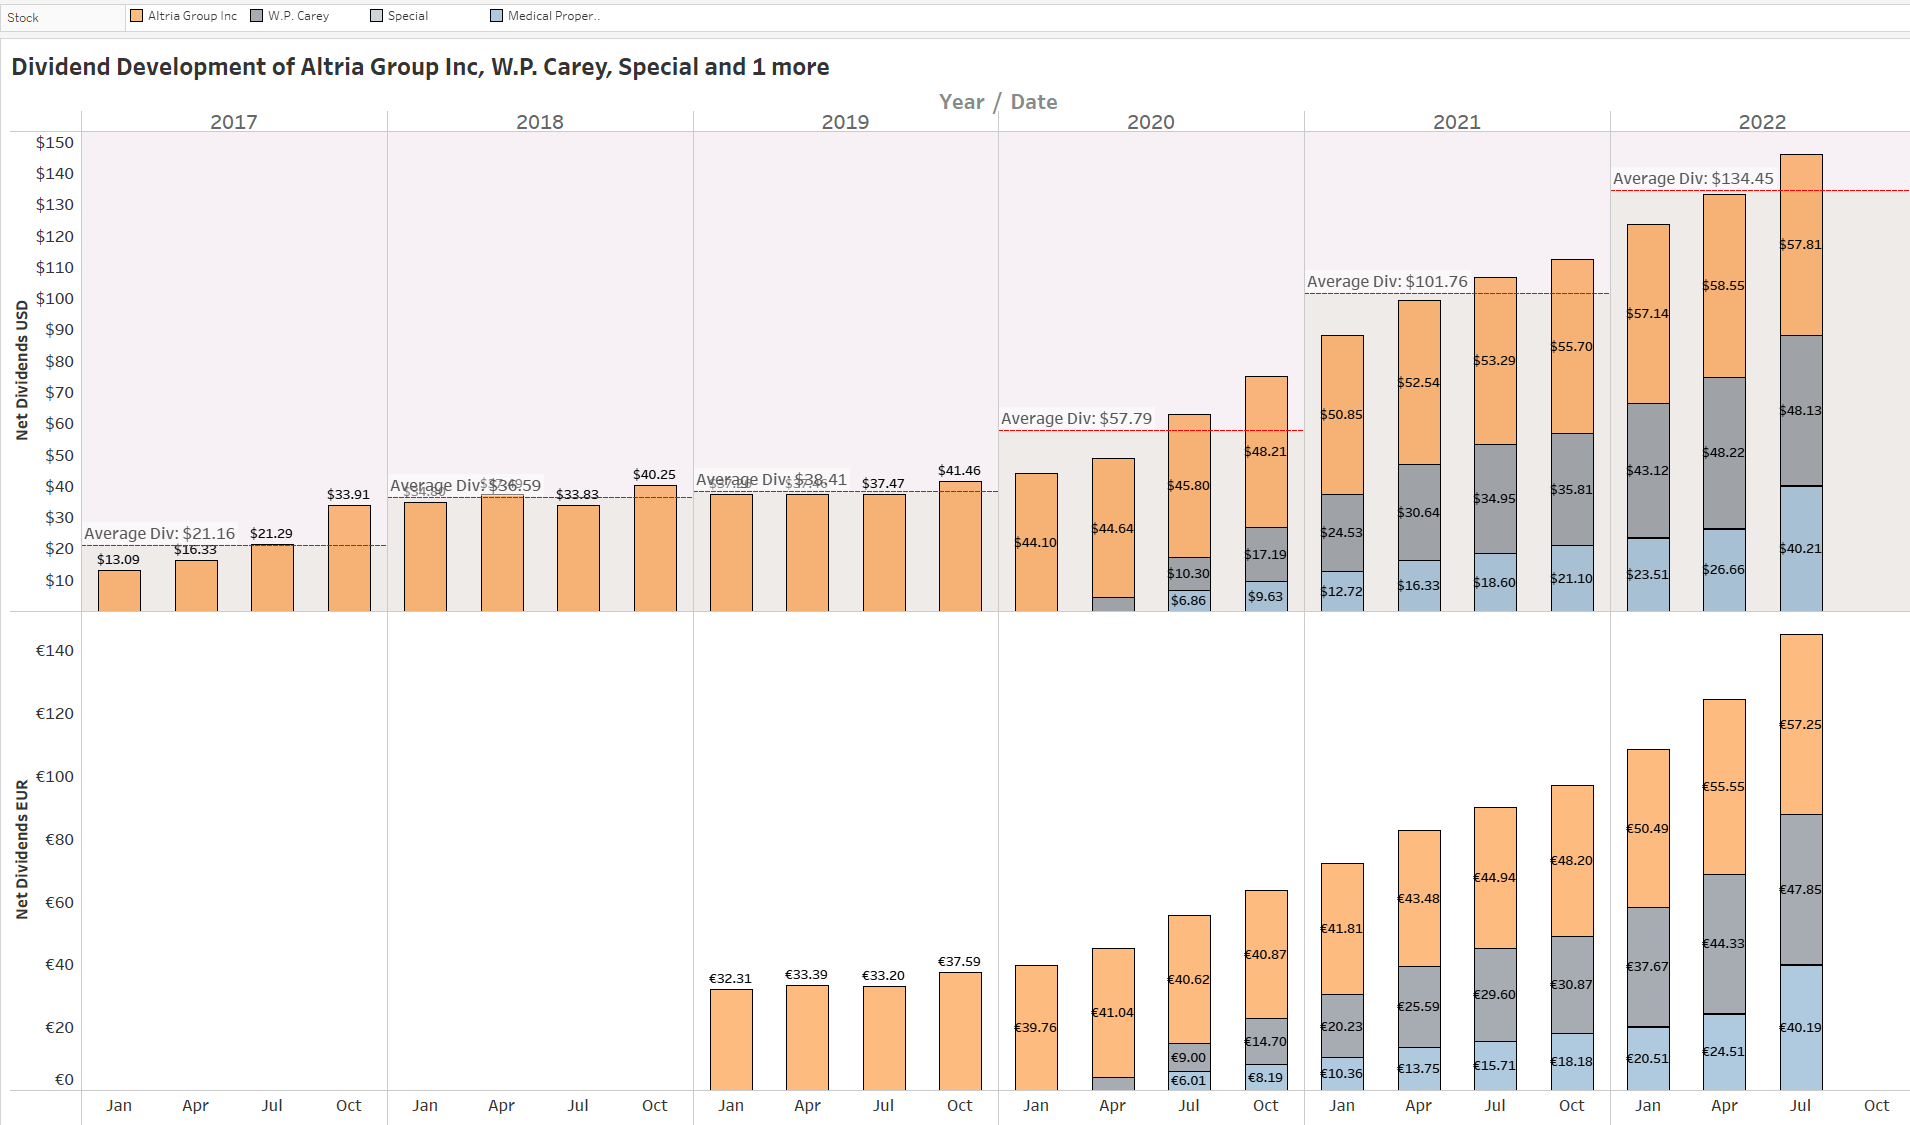
Here is a look at my favorite chart: the net dividend income development by month over time between 2015 and 2022, where you can easily see the development of my dividend income as well as the average annual dividend in a given year:
All-time Dividend Development (Designed by author)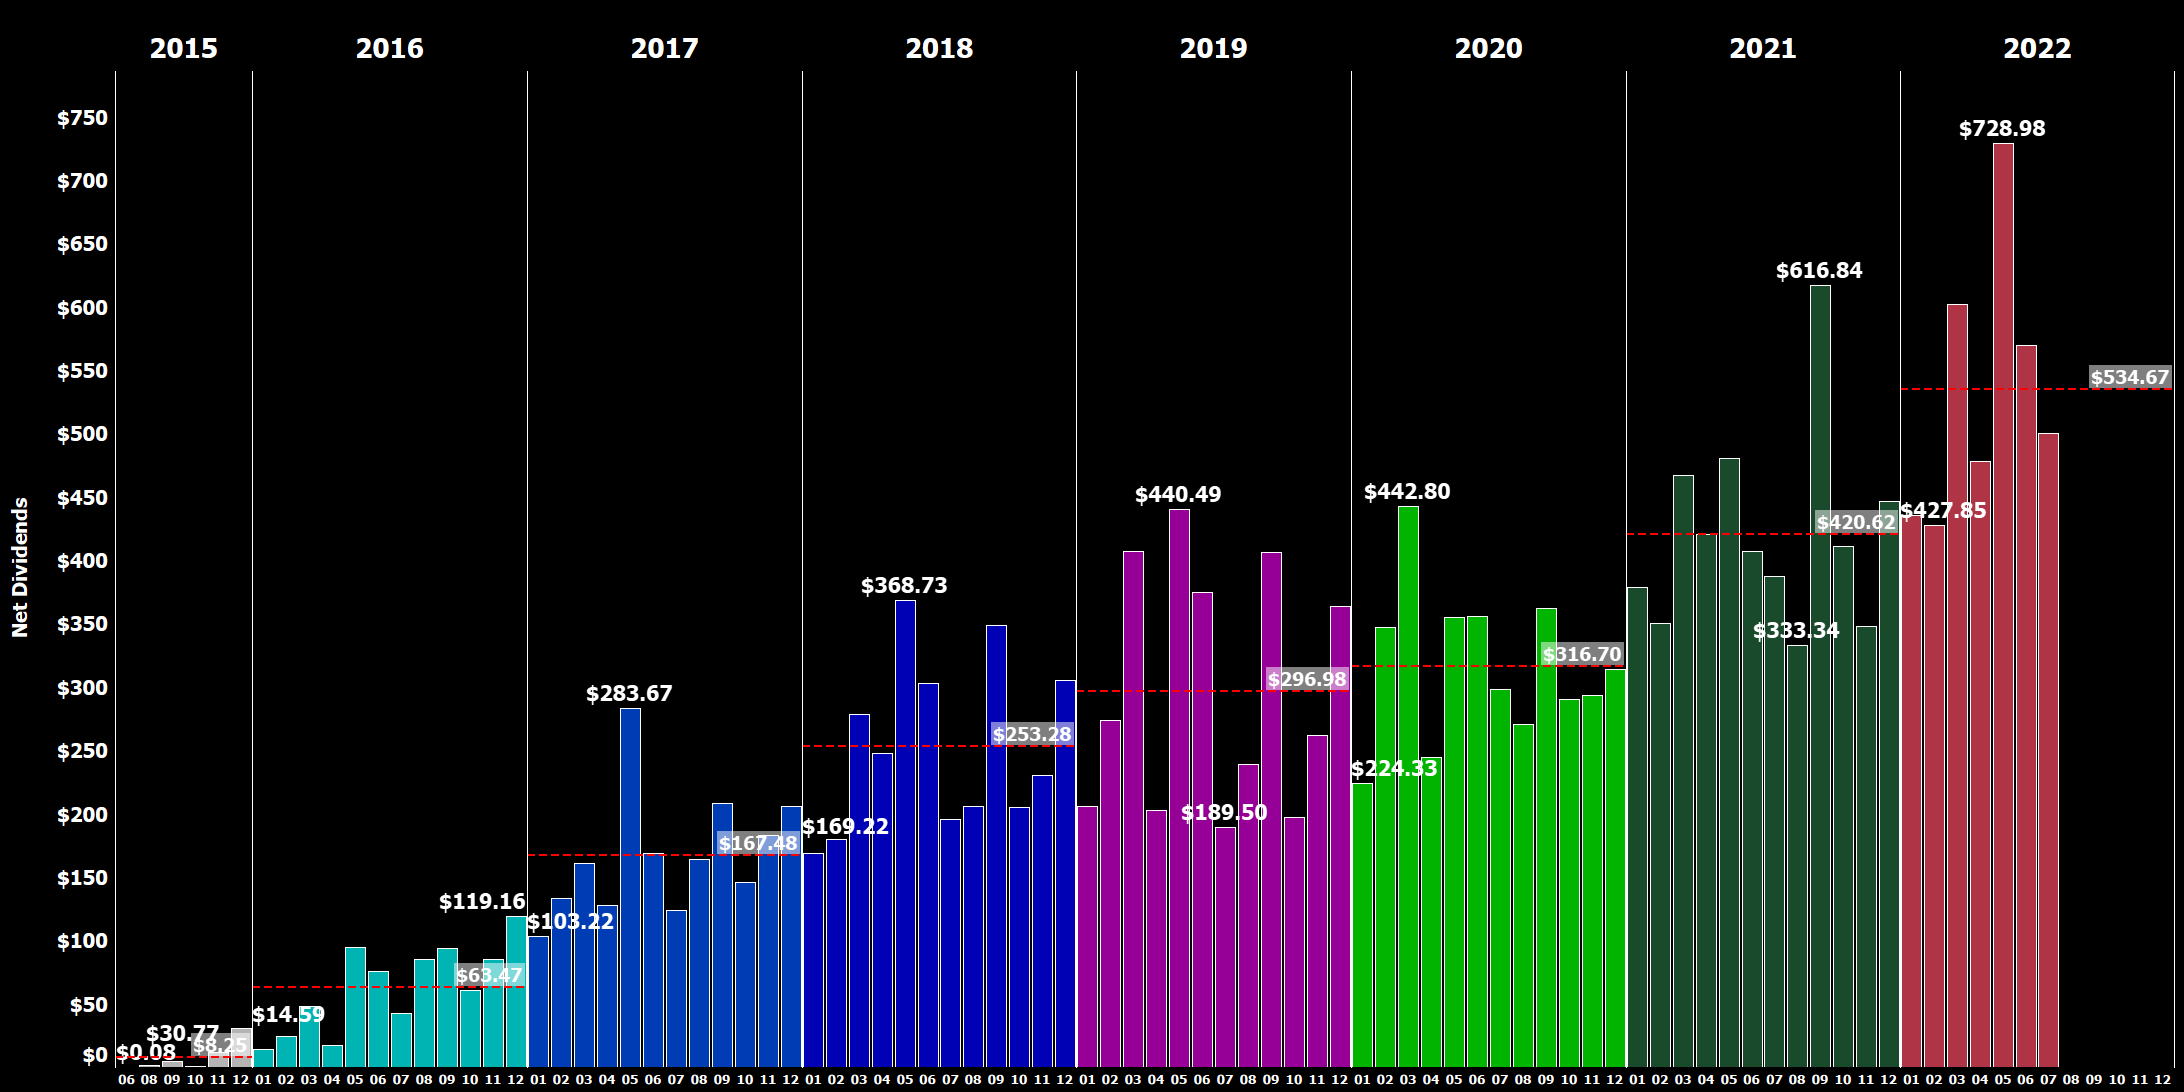
Next, I have scattered all the individual dividend payments I have ever received and colored them by year, rearranging the years side by side rather than horizontally as in previous updates:
Dividend Bubbles (Designed by author)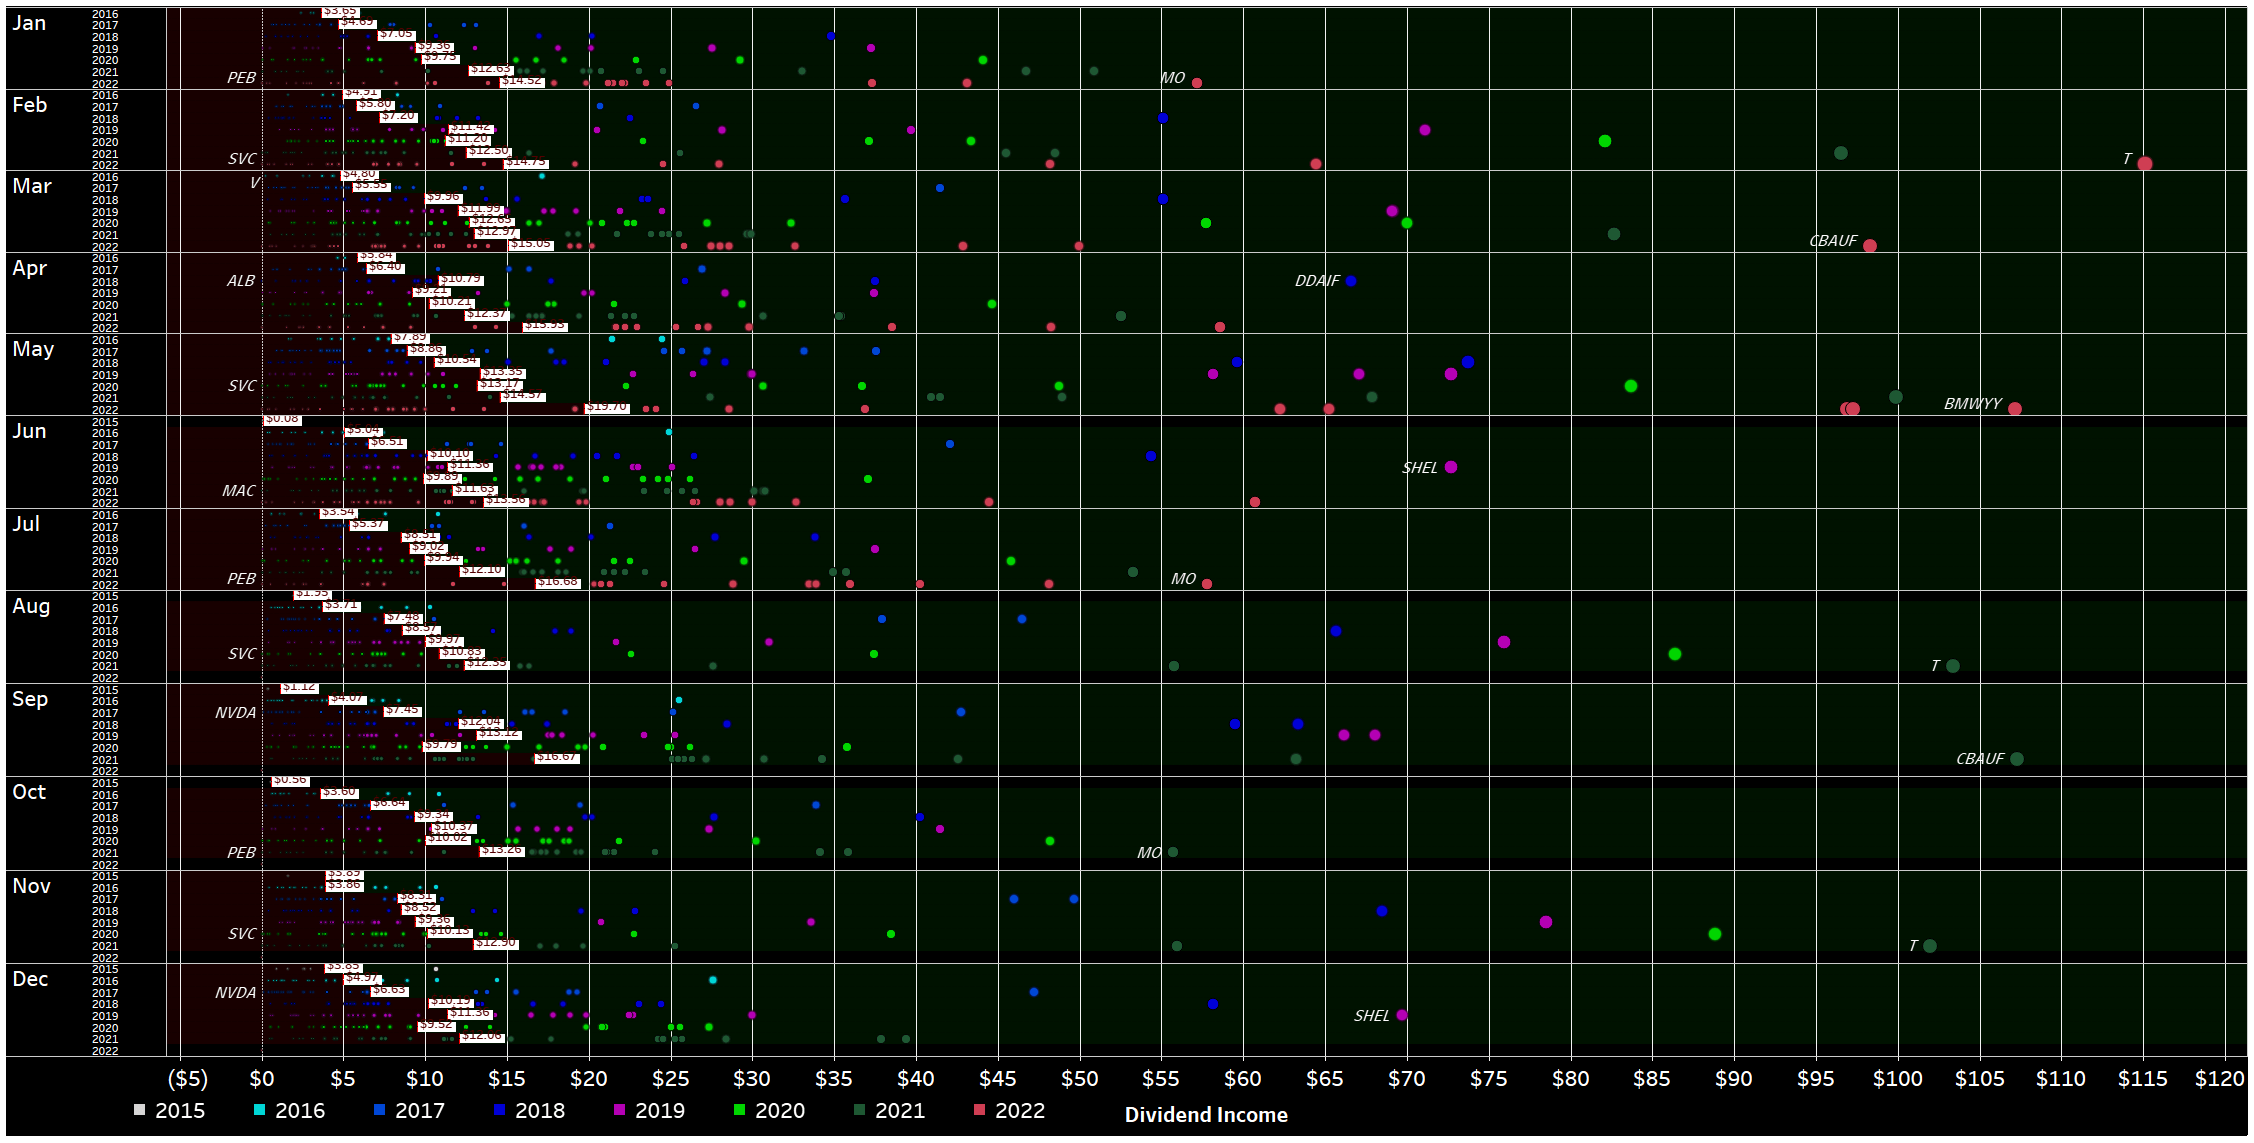
This view looks very cluttered at first, but it is very rich in information. It shows every single dividend payment I have received since I started my journey in 2015 in the shape of a circle colored differently by year and size, based upon their contribution. The view is broken down by month and by year (not by year and by month), and thus allows to better see the development over time. For every year of a certain month, a white rectangle indicates the average monthly dividend. The area where dividends fall below that average is filled dark red, whereas the area above is colored dark green. Personally, I absolutely love this redesigned view of my old “bubbles chart,” as it is much clearer to identify developments and trends in my dividend income.
July 2022 Dividends (Designed by author)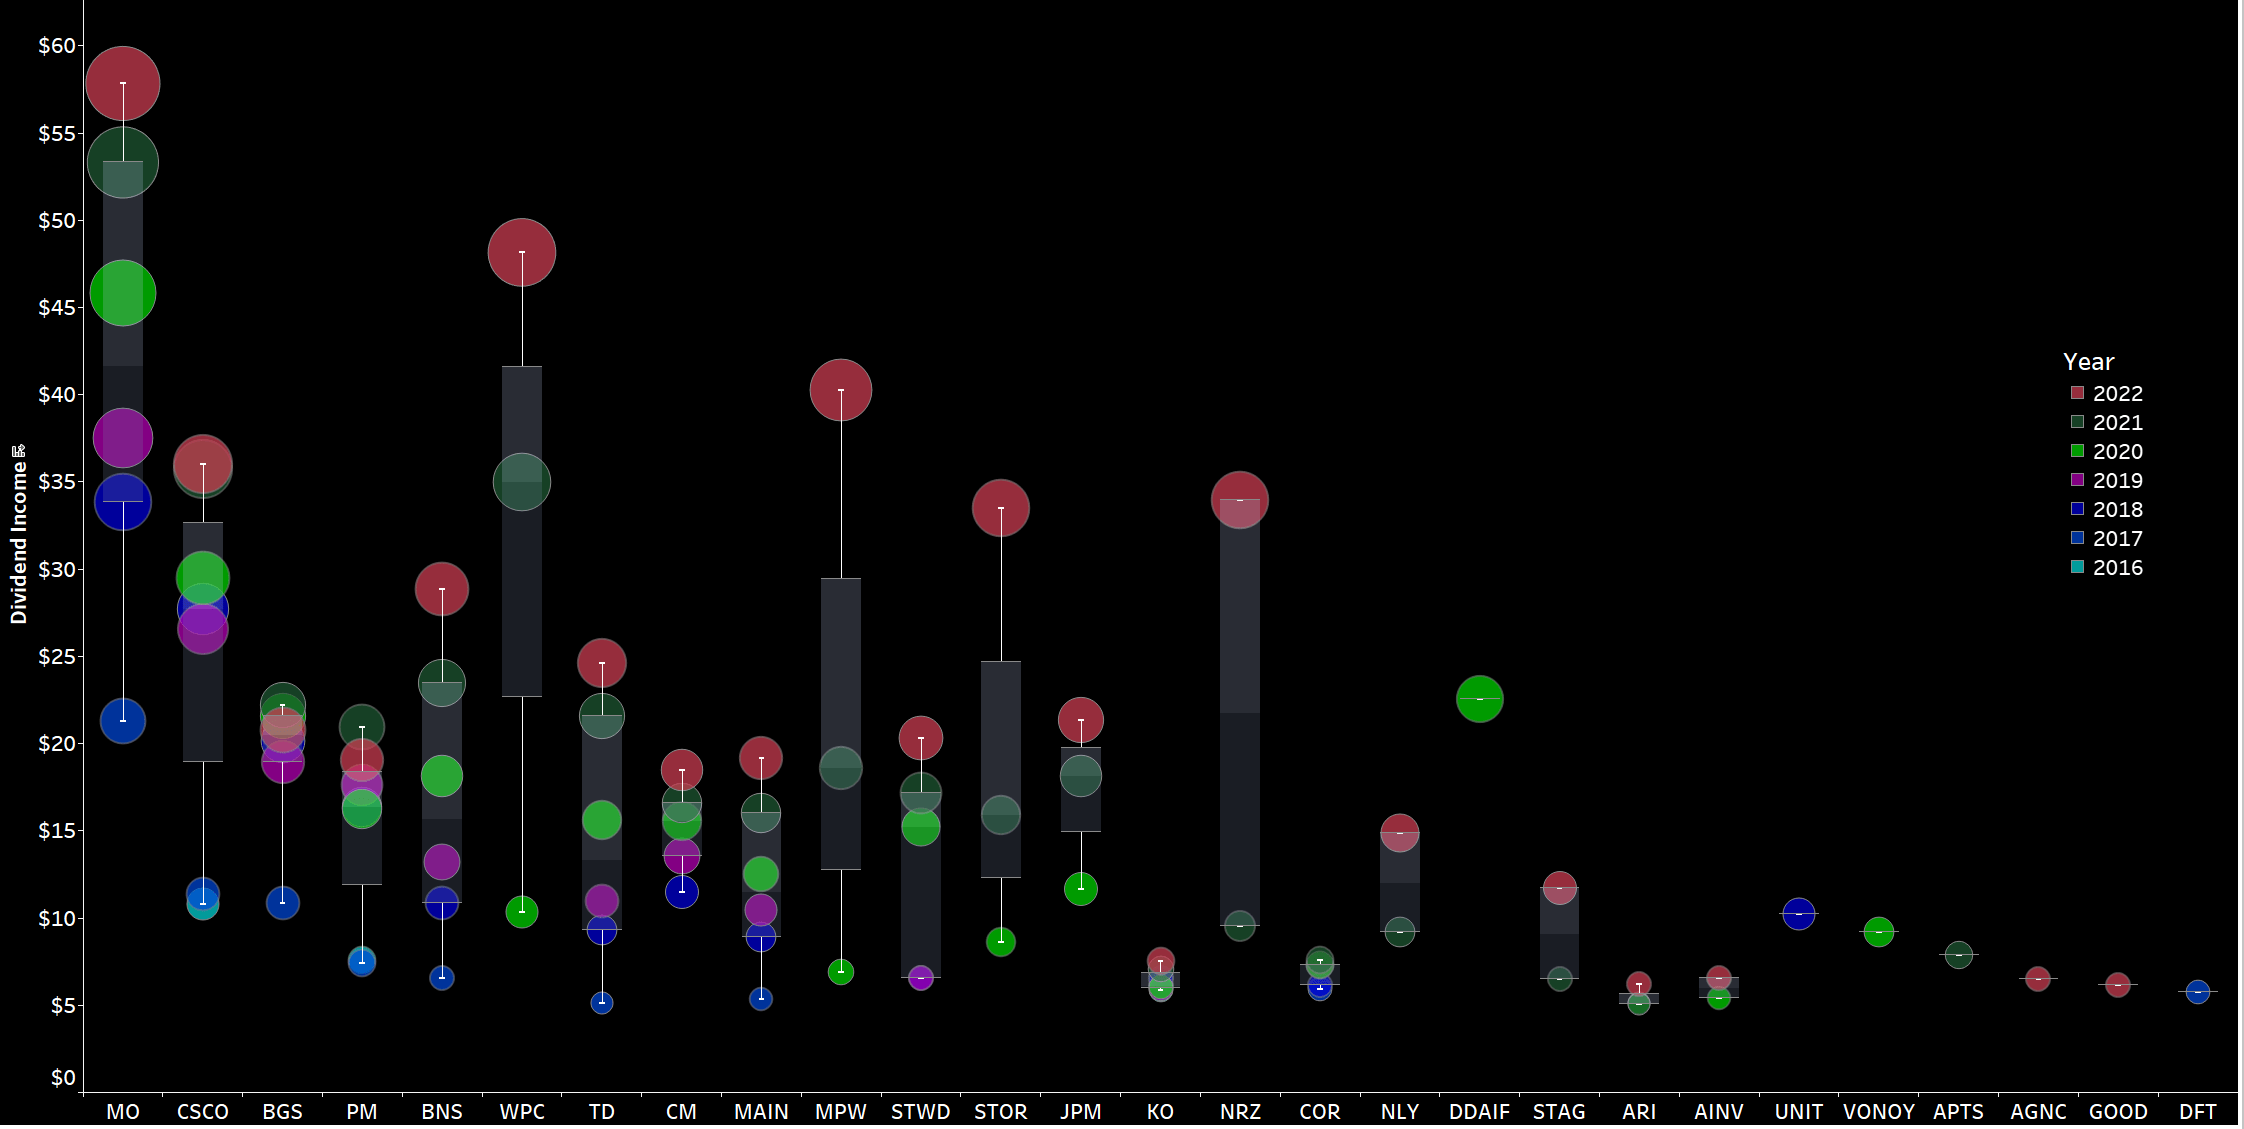
Now, zooming in on July, we can immediately see a number of big green circles in a sea of black. The bigger the circle and the bigger the distance to the previous circle for the same stock, the bigger is the change in dividend income compared to the prior years.
The biggest observations are the huge distances in between 3 respective data points for 2022, 2021 and 2020 for WPC, RITM, MPW and STOR which is a testament to the very aggressive and consistent monthly purchasing of these stocks ever since the outbreak of the pandemic. All four of them are slowly getting towards that illustrious $100 net dividend milestone. Overall, what I like to see in that chart is obviously big red circles at the top of the scale for as many stocks as possible as that means rising dividend income.
Another way to express the monthly dividend income is in terms of Gifted Working Time (GWT).
I am assuming an average hourly rate of $30.8 for 2022 here:
- In 2018, I generated 121 hours in GWT, equaling slightly more than $3,000 in annual net dividends.
- In 2019, I generated 142 hours in GWT, equaling almost $3,600 in annual net dividends.
- In 2020, I generated 152 hours in GWT, equaling roughly $3,800 in annual net dividends.
- In 2021, I generated 180 hours in GWT, equaling roughly $5,050 in annual net dividends.
- In 2022, I am targeting to reach at least $5,500 in annual net dividends, which equals roughly 179 hours in GWT. Despite the projected increase in annual net dividends I expect overall GWT to decrease following higher calculated hourly rates, a figure I project to rise by 10% given soaring inflation. The annual target of $5,500 is on the very cautious side as I need more visibility into how the year is progressing, particularly as I expect ongoing monthly investments to decline given elevated stock levels and rising inflationary and geopolitical pressures.
Across the years, the YTD Dividend Race as I like to call it looks as follows. While 2020 was fairly disappointing, 2021 was phenomenal as it benefited from a rather low baseline from the prior year. For 2022, I am targeting a conservative high single-digit growth rate for now, which is a very cautious estimate to begin with. YTD growth based on the first 7 months is still shattering my expectations coming in at 29% Y/Y, and while I expect some moderation over the course of the year, solid double-digit growth in annual dividend income is almost guaranteed already for this year. At this stage it becomes more and more likely that not only will I easily meet my initial goal of $5,500 in net dividend income but in fact exceed the $6,000 milestone comfortably. That would equate to at least $500 in net dividends per month which is a big number for me and more than enough to for instance pay all the utility bills which are soaring due to the war in Ukraine and its repercussions.
YTD Dividend Growth (Designed by author)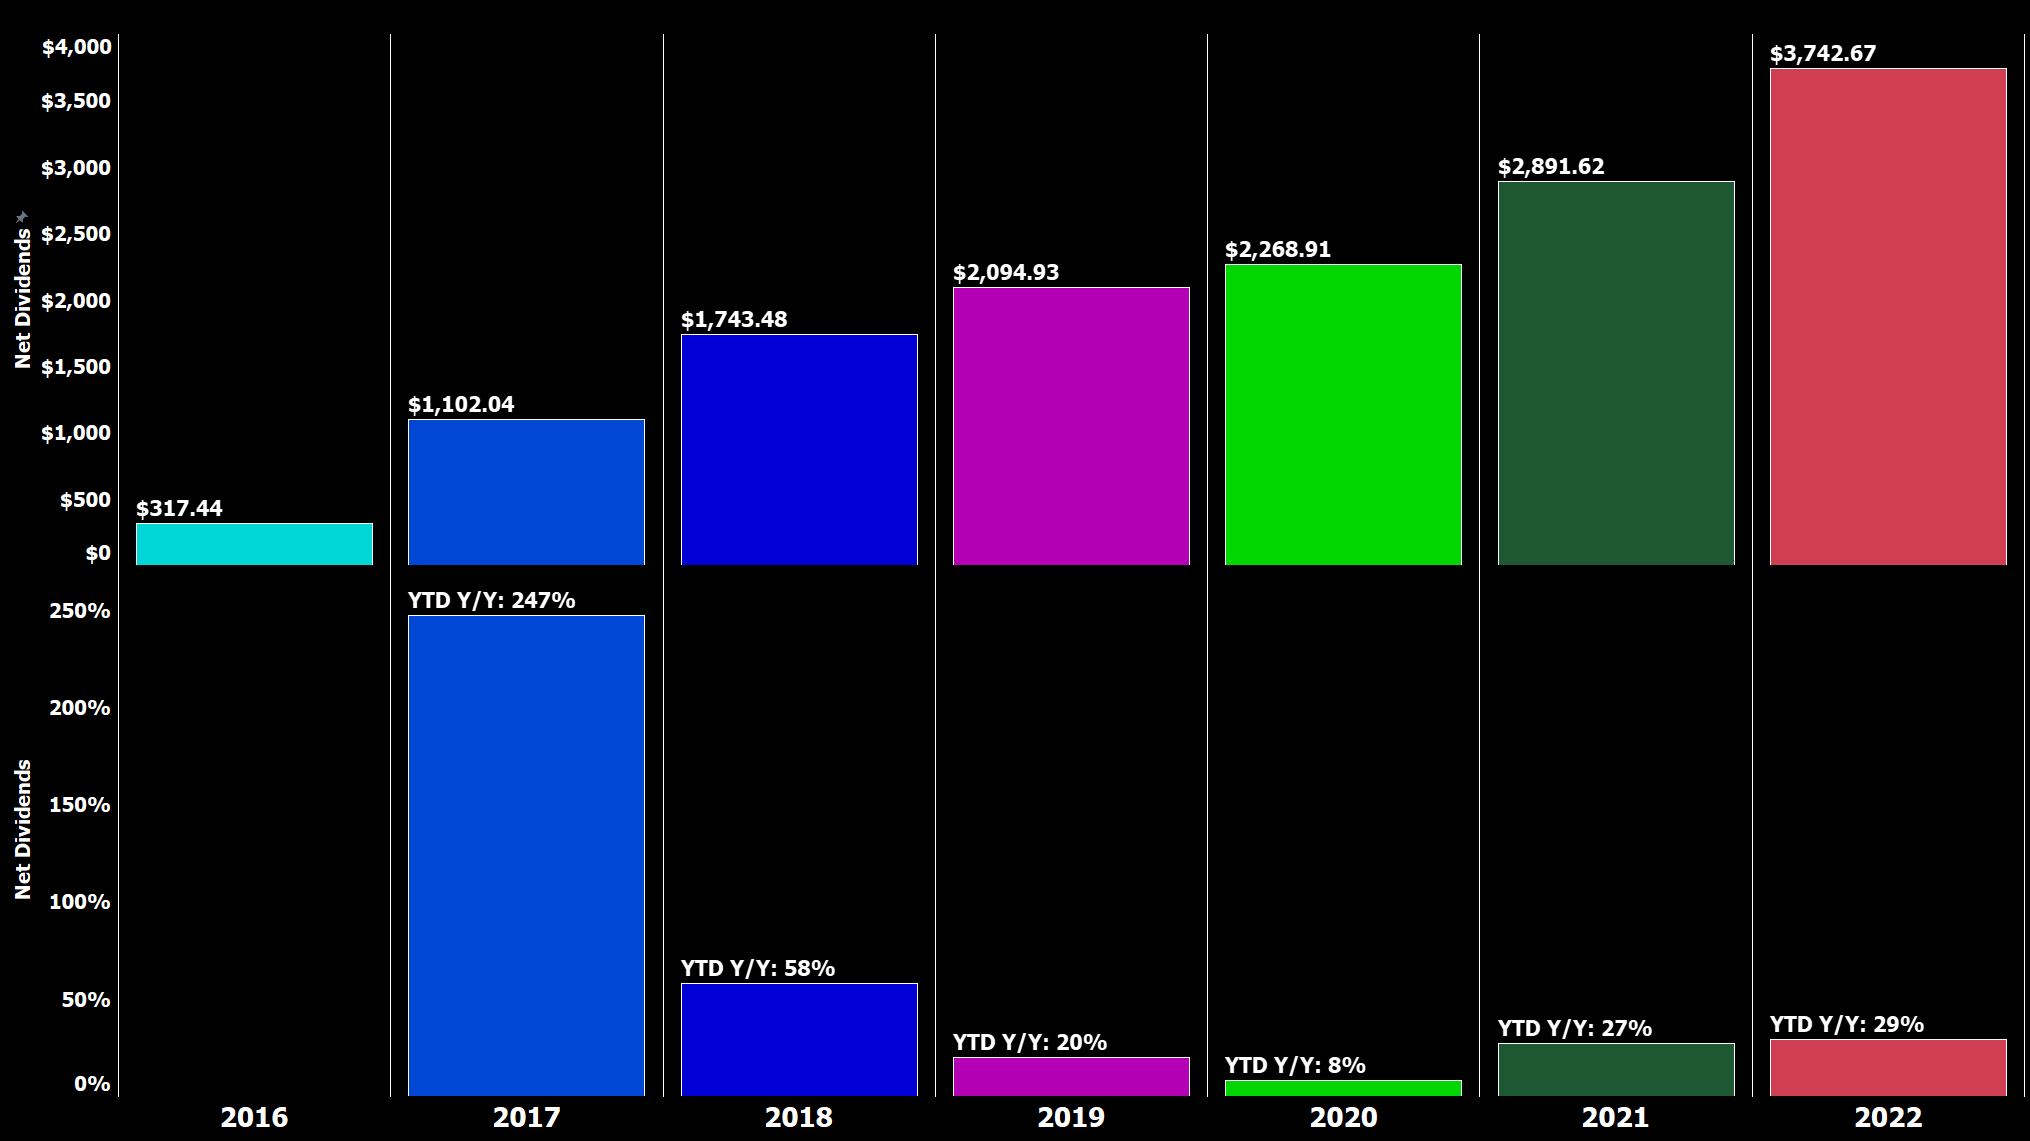
I have modified the YTD Dividend Race chart. Top left shows the YTD Dividend Race in the old format. At the top right, we can see how YTD dividend income developed on a daily basis and whereby we can easily identify that most of my dividend income is generated mid-month and towards the end of the month. At the bottom, that development is broken down by every individual month for the current year which makes big jumps clearly identifiable.
YTD Dividend Race (Designed by author)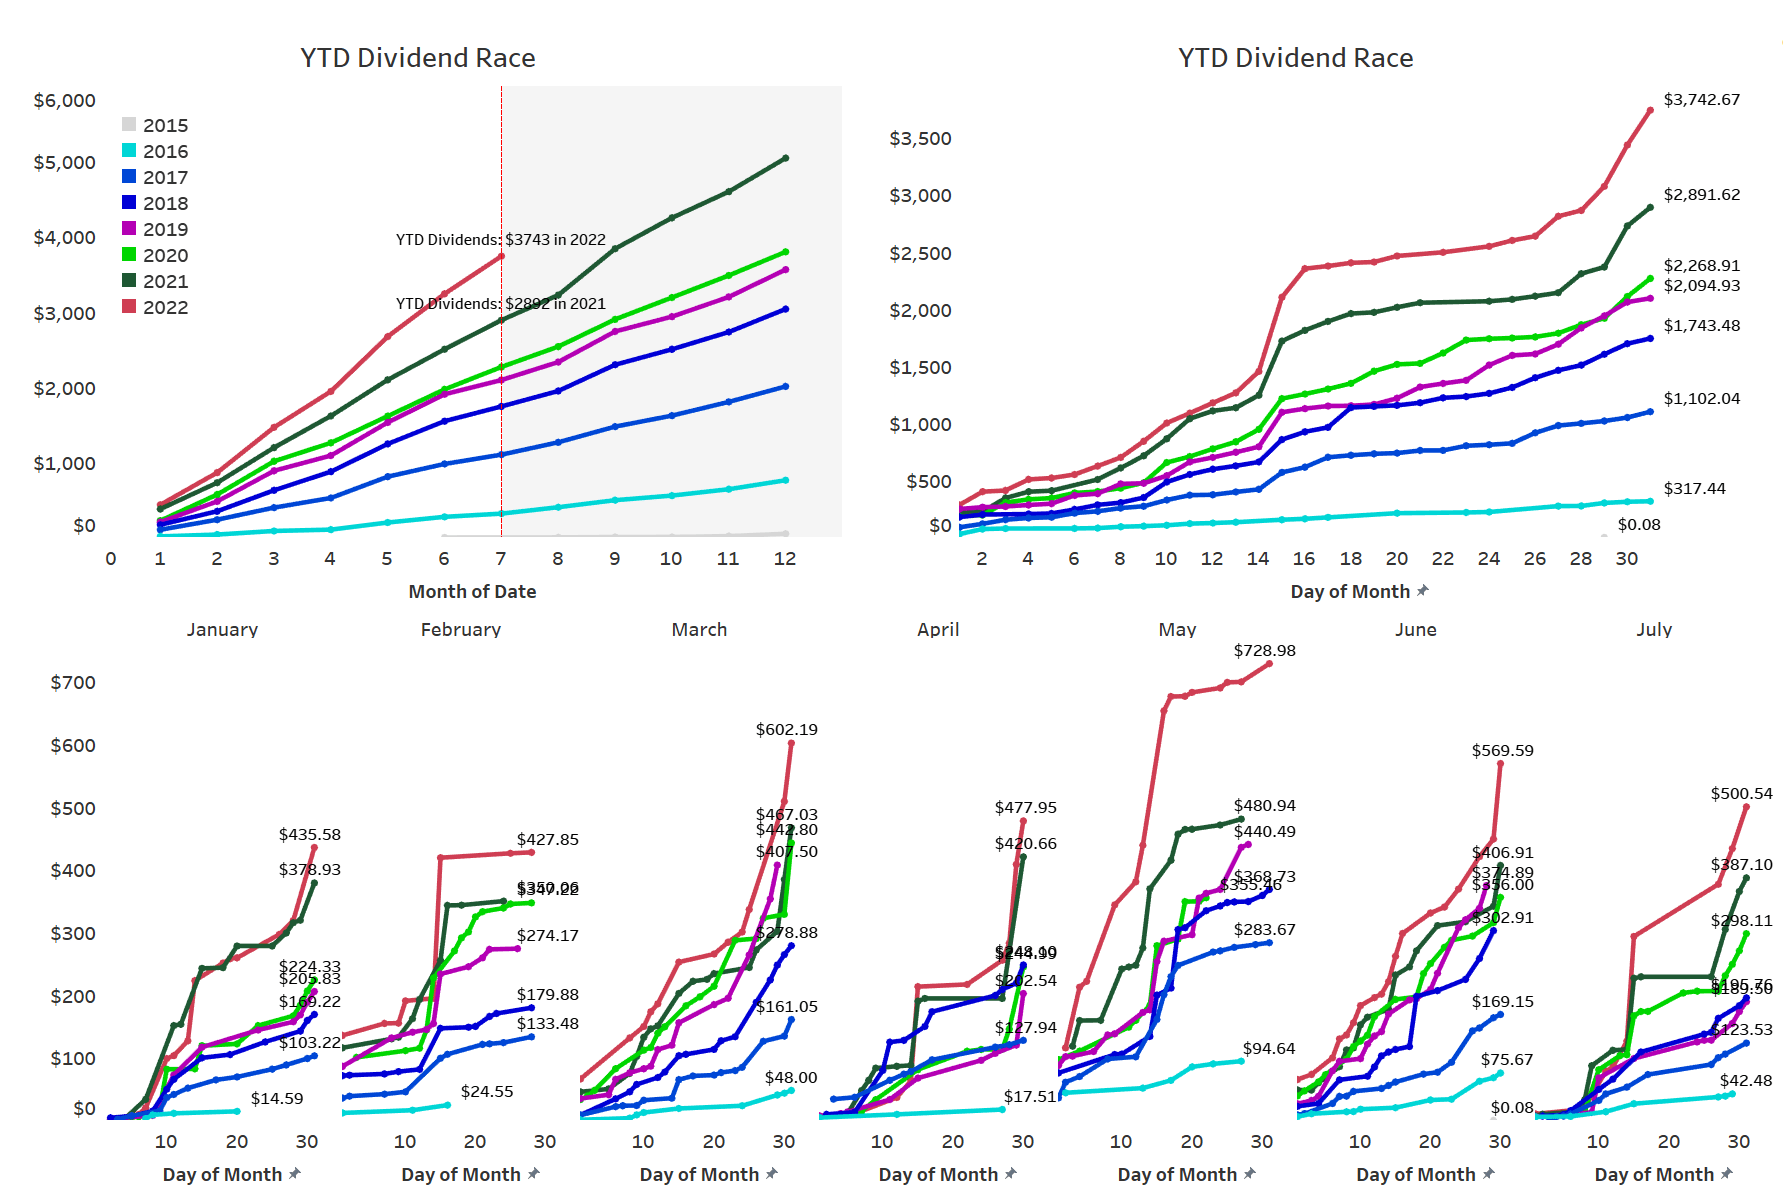
Expressed in GWT, it presents itself as follows:
Gifted Working Time (Designed by author)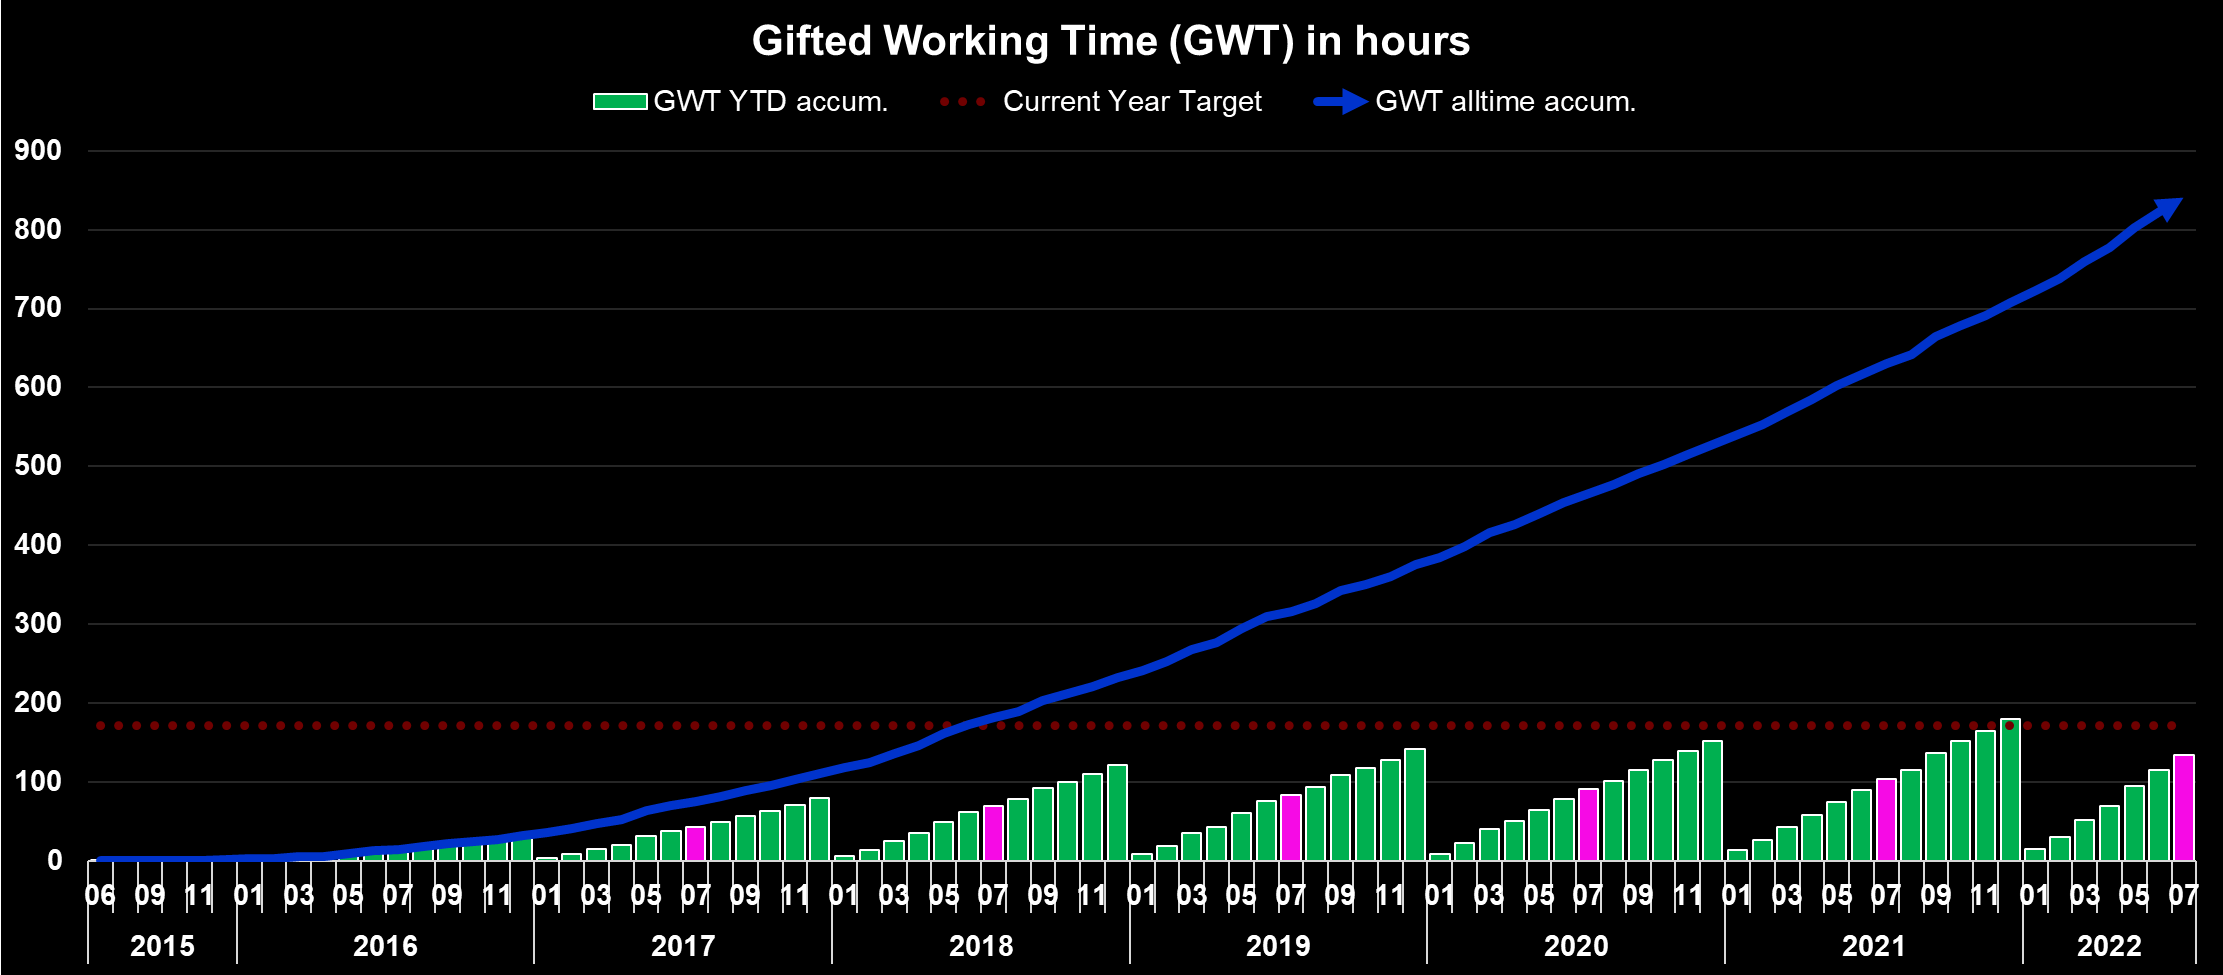
What this shows is as follows:
- All time (blue area) – Around 841 hours, or 105 days, of active work have been replaced with passive income since the start of my dividend journey. Assuming a five-day workweek this translates into 21 weeks of vacation funded via dividends.
- YTD (green bars) – Around 134 hours, or 16.7 days, of active work have been replaced with passive income in 2022 already, which equals more than 3 weeks’ worth of active work funded via dividends.
- Highlighted in pink is the accumulated YTD total at the end of the current reporting month (July).
Upcoming August Dividends
Contrary to July, August features significantly fewer dividend payers although I expect a massive special dividend over 1,000€ from little known Sino AG which by the time of writing this article had already been paid as we can see in the stock price development. Sino AG was one of the early investors in German neo-broker Trade Republic (TR) and as TR’s valuation grew with every seeding round Sino’s shares rose to extreme levels. Finally, the cashed out and sold a large stake to other investors and that excess cash has now been distributed to shareholders.
Sino AG Stock Price Development (Yahoo Finance)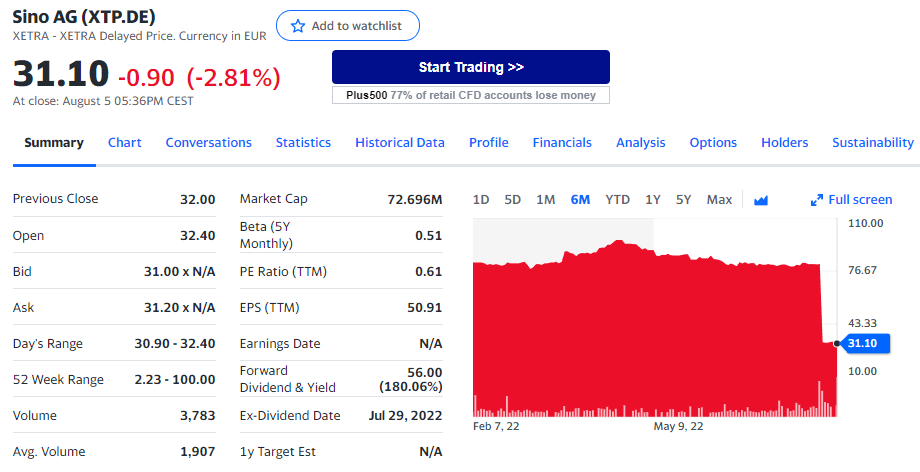
Beyond that dividend payments are overall concentrated in the first half of the month with only 1 meaningful dividend payment from the Royal Bank of Canada (RY) expected in the second half of August.
I still haven’t really replaced that lost dividend income from AT&T yet but I am working on it and expect a much better August compared to the regular dividend payments received a quarter ago. Beyond that I intend to add to my energy holdings in ET, EPD and MPLX and newly added HASI so that dividends in the Feb/May/Aug/Nov schedule will start growing again.
The snapshot below is taken from my latest and free-for-all released Dividend Calendar (make sure to follow instructions in the video) and shows my expected dividend payments in August.
My Dividend Calendar (Designed by author)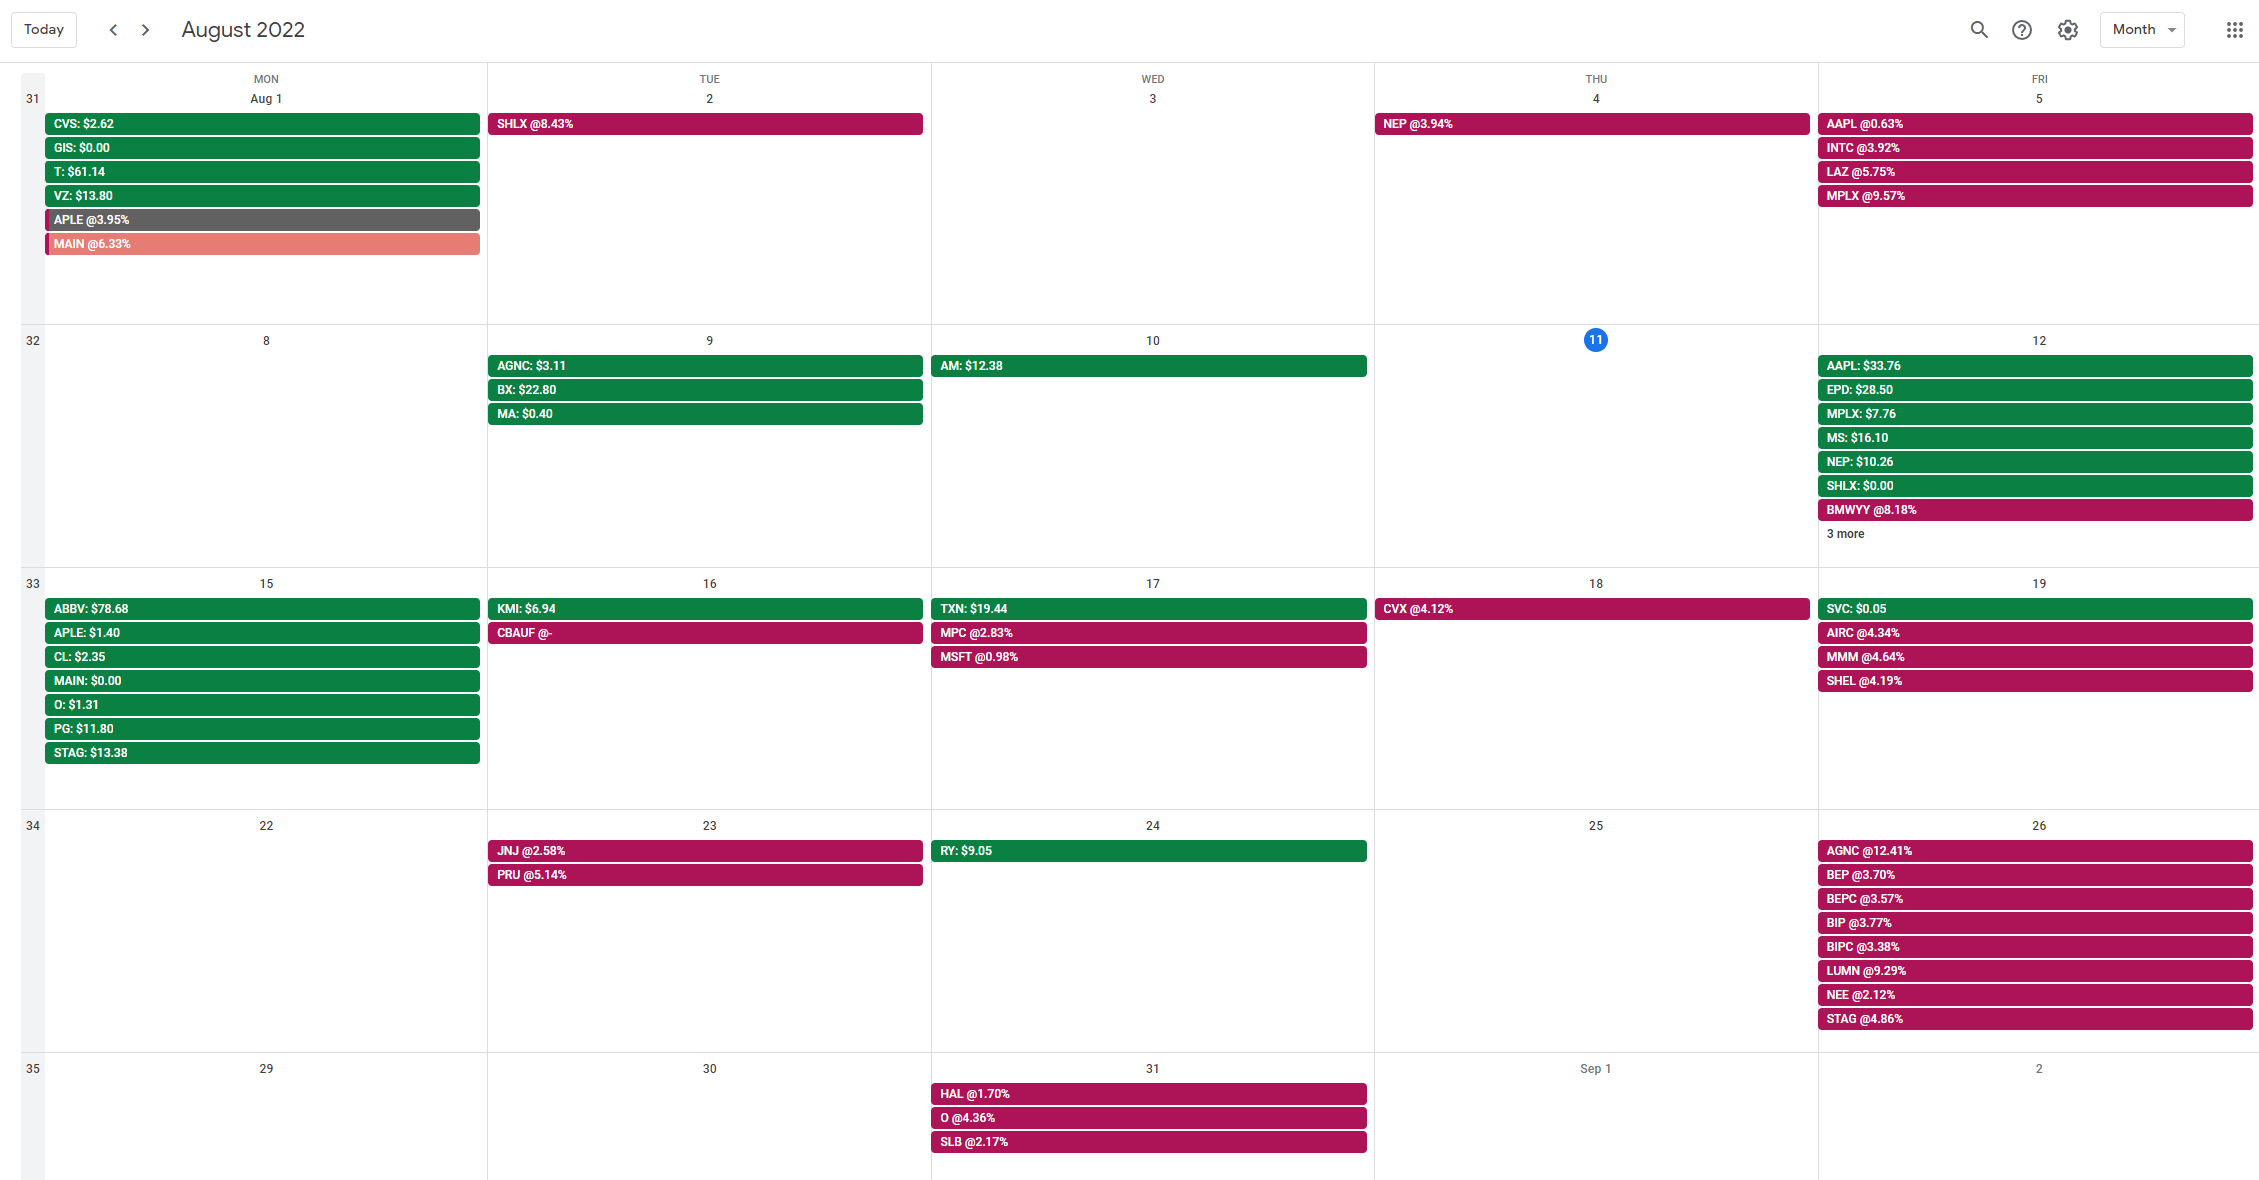
At the end of July, my dividend portfolio is composed as follows:
| Company Name | Ticker | % Market Value | Market Value (€) |
| Apple Inc. | (AAPL) | 12.42% | 24,322 |
| Visa Inc | (V) | 4.27% | 8,367 |
| AbbVie Inc | (ABBV) | 3.72% | 7,294 |
| Microsoft Corporation | (MSFT) | 3.70% | 7,242 |
| McDonald’s Corp | (MCD) | 3.59% | 7,025 |
| Cisco Systems, Inc. | (CSCO) | 2.73% | 5,352 |
| Commonwealth Bank of Australia | (OTCPK:CBAUF) | 2.71% | 5,316 |
| Johnson & Johnson | (JNJ) | 2.61% | 5,108 |
| W. P. Carey | (WPC) | 2.46% | 4,816 |
| Main Street Capital Corporation | (MAIN) | 2.35% | 4,609 |
| AT&T Inc. | (T) | 2.32% | 4,546 |
| Shell | (SHEL) | 2.00% | 3,921 |
| Southern Company | (SO) | 1.98% | 3,877 |
| STAG Industrial Inc | (STAG) | 1.94% | 3,802 |
| Texas Instruments Incorporated | (TXN) | 1.90% | 3,714 |
| Wells Fargo & Co | (WFC) | 1.70% | 3,331 |
| Altria Group Inc | (MO) | 1.66% | 3,258 |
| Home Depot | (HD) | 1.66% | 3,256 |
| Ares Capital Corporation | (ARCC) | 1.64% | 3,204 |
| Toronto-Dominion Bank | (TD) | 1.60% | 3,137 |
| JPMorgan Chase & Co. | (JPM) | 1.60% | 3,128 |
| Bank of Nova Scotia | (BNS) | 1.52% | 2,972 |
| NVIDIA Corporation | (NVDA) | 1.49% | 2,928 |
| Medical Properties Trust | (MPW) | 1.47% | 2,889 |
| STORE Capital | (STOR) | 1.47% | 2,876 |
| Gilead Sciences, Inc. | (GILD) | 1.38% | 2,707 |
| Siemens Healthineers | (OTCPK:SEMHF) | 1.33% | 2,600 |
| Allianz SE | (OTCPK:ALIZF) | 1.08% | 2,115 |
| Blackstone Group LP | (BX) | 1.07% | 2,096 |
| PepsiCo, Inc. | (PEP) | 1.02% | 1,994 |
| Morgan Stanley | (MS) | 1.01% | 1,985 |
| Procter & Gamble Co | (PG) | 0.94% | 1,837 |
| Intel Corporation | (INTC) | 0.92% | 1,806 |
| Brookfield Renewable Partners | (BEP) | 0.90% | 1,761 |
| Broadcom Inc | (AVGO) | 0.89% | 1,739 |
| BMW | (OTCPK:BMWYY) | 0.88% | 1,723 |
| Enbridge | (ENB) | 0.85% | 1,667 |
| Philip Morris International Inc. | (PM) | 0.85% | 1,660 |
| Rithm Capital Corp | (RITM) | 0.80% | 1,568 |
| Bank of America Corp | (BAC) | 0.78% | 1,532 |
| Honeywell International Inc. | (HON) | 0.78% | 1,532 |
| 3M Co | (MMM) | 0.74% | 1,451 |
| BP1 | (BP) | 0.70% | 1,371 |
| Target Corporation | (TGT) | 0.67% | 1,318 |
| BP2 | (BP) | 0.64% | 1,257 |
| The Coca-Cola Co | (KO) | 0.63% | 1,225 |
| Realty Income Corp | (O) | 0.62% | 1,216 |
| Daimler | (OTCPK:DDAIF) | 0.61% | 1,200 |
| Dominion Energy Inc | (D) | 0.61% | 1,196 |
| NextEra Energy Partners LP | (NEP) | 0.58% | 1,139 |
| Starwood Property Trust, Inc. | (STWD) | 0.56% | 1,093 |
| Gladstone Commercial Corporation | (GOOD) | 0.55% | 1,081 |
| B&G Foods, Inc. | (BGS) | 0.53% | 1,039 |
| Unilever NV ADR | (UL) | 0.53% | 1,034 |
| CVS Health Corp | (CVS) | 0.52% | 1,024 |
| Apple Hospitality REIT | (APLE) | 0.49% | 967 |
| Royal Bank of Canada | (RY) | 0.49% | 956 |
| Verizon Communications Inc. | (VZ) | 0.48% | 939 |
| Stryker | (SYK) | 0.42% | 831 |
| Canadian Imperial Bank of Commerce | (CM) | 0.41% | 801 |
| Walgreens Boots Alliance Inc | (WBA) | 0.37% | 724 |
| NextEra Energy | (NEE) | 0.37% | 721 |
| AGNC Investment Corporation | (AGNC) | 0.37% | 721 |
| sino AG | (XTP.F) | 0.37% | 715 |
| Medtronic | (MDT) | 0.36% | 712 |
| Pfizer Inc. | (PFE) | 0.35% | 679 |
| BASF | (OTCQX:BASFY) | 0.32% | 624 |
| Walt Disney Co | (DIS) | 0.28% | 546 |
| Antero Midstream Corporation | (AM) | 0.27% | 538 |
| Kinder Morgan Inc | (KMI) | 0.27% | 528 |
| General Electric Company | (GE) | 0.27% | 524 |
| Exxon Mobil Corporation | (XOM) | 0.27% | 524 |
| Alibaba Group Holding Ltd | (BABA) | 0.23% | 449 |
| Annaly Capital Management | (NLY) | 0.23% | 448 |
| Sixt | (OTC:SXTSY) | 0.21% | 402 |
| BRT Apartments | (BRT) | 0.20% | 394 |
| Colgate-Palmolive Company | (CL) | 0.20% | 390 |
| Omega Healthcare Investors Inc | (OHI) | 0.20% | 387 |
| Enterprise Products Partners L.P. | (EPD) | 0.20% | 385 |
| Mastercard | (MA) | 0.19% | 363 |
| Energy Transfer Partners | (ET) | 0.17% | 339 |
| MPLX LP | (MPLX) | 0.17% | 338 |
| Bayer AG | (OTCPK:BAYZF) | 0.16% | 313 |
| Apollo Commercial Real Est. Finance Inc | (ARI) | 0.13% | 260 |
| Apollo Investment | (AINV) | 0.13% | 249 |
| Brookfield Infrastructure Partners L.P. | (BIP) | 0.12% | 239 |
| Vonovia | (OTCPK:VONOY) | 0.10% | 203 |
| Prudential Financial | (PRU) | 0.10% | 197 |
| Uniti Group Inc | (UNIT) | 0.10% | 197 |
| Lumen Technologies | (LUMN) | 0.08% | 159 |
| Fresenius SE | (OTCPK:FSNUF) | 0.07% | 143 |
| Equitrans Midstream Corporation | (ETRN) | 0.07% | 129 |
| Boeing | (BA) | 0.06% | 121 |
| Newtek Business Services | (NEWT) | 0.05% | 103 |
| Bank of Montreal | (BMO) | 0.05% | 98 |
| Diversified Healthcare Trust | (DHC) | 0.04% | 77 |
| Fresenius Medical Care | (FMS) | 0.04% | 73 |
| The GEO Group Inc | (GEO) | 0.02% | 45 |
| Service Properties Trust | (SVC) | 0.02% | 38 |
Be the first to comment