

FeelPic
In this month’s article, I outline why I am maintaining my October’s allocation to the SPDR S&P 500 ETF (NYSEARCA:SPY) at 40% with the other 60% of my assets in cash. First, let me review my pension plan performance in October. The market, as measured by the S&P 500 index, gained 7.99% for the month. As for my pension plan assets, I underperformed the index as my investment allocation gained 3.42%. My investment objective of preserving my capital was met, as I did make money. I did not meet my second investment objective, which is beating the S&P 500 index. Table 1 below shows my returns and allocations for the month of October, and Table 2 below shows my returns for the past 12 months.
I have made changes to Table 2 below after I received a comment from a reader. Table 2 shows new columns to better (more accurately) reflect my investment results. The third column, $100K Hypo, is what my returns would be if I started my account with $100,000 in my first article of this series and followed the allocation recommendations from my articles. The fifth column, $100K SPY, shows the returns of just investing $100,000 and keeping it all allocated to SPY. The percentage returns in the last row show that my strategy returned a negative 11.32% for the last 12 months, and simply investing in SPY would have returned a negative 14.61% for the last 12 months. Therefore, I have outperformed SPY for the last 12 months by 3.30%.
Table 1 – Investment Returns for October
Author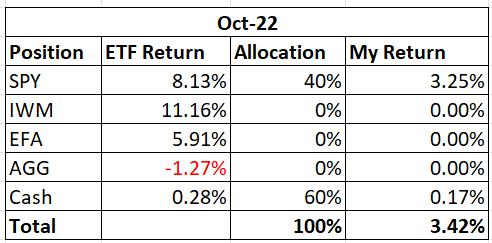
Table 2 – Investment Returns Last 12 Months
Author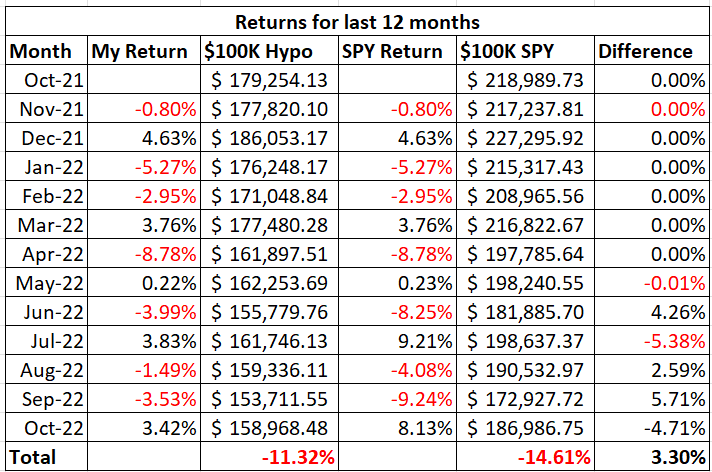
To review the purpose of this series of articles, my retirement account only allows me to buy the following four exchange-traded funds (“ETFs”): iShares Core U.S. Aggregate Bond ETF (AGG), SPDR S&P 500 ETF (SPY), iShares Russell 2000 ETF (IWM), and iShares MSCI EAFE ETF (EFA). I can also have my money in cash. The question is how to decide where and when to allocate money to these various ETFs.
I use my moving average crossover system combined with relative strength charts to determine how to allocate my pension plan assets. My moving average crossover system uses the 6-month and the 10-month exponential moving averages to identify which of the four ETFs are in a position to be bought. If the 6-month moving average is above the 10-month moving average, then the ETF is a buy. I call this setup being in bullish alignment. When the 6-month moving average is below the 10-month moving average, the setup is referred to as a bearish alignment. When a bearish alignment happens, I don’t want to hold that asset. See Chart 1 below for a long-term look at the S&P 500 index using my moving average crossover system.
Chart 1 – Monthly SP 500 Index with 6/10 Moving Averages
www.stockcharts.com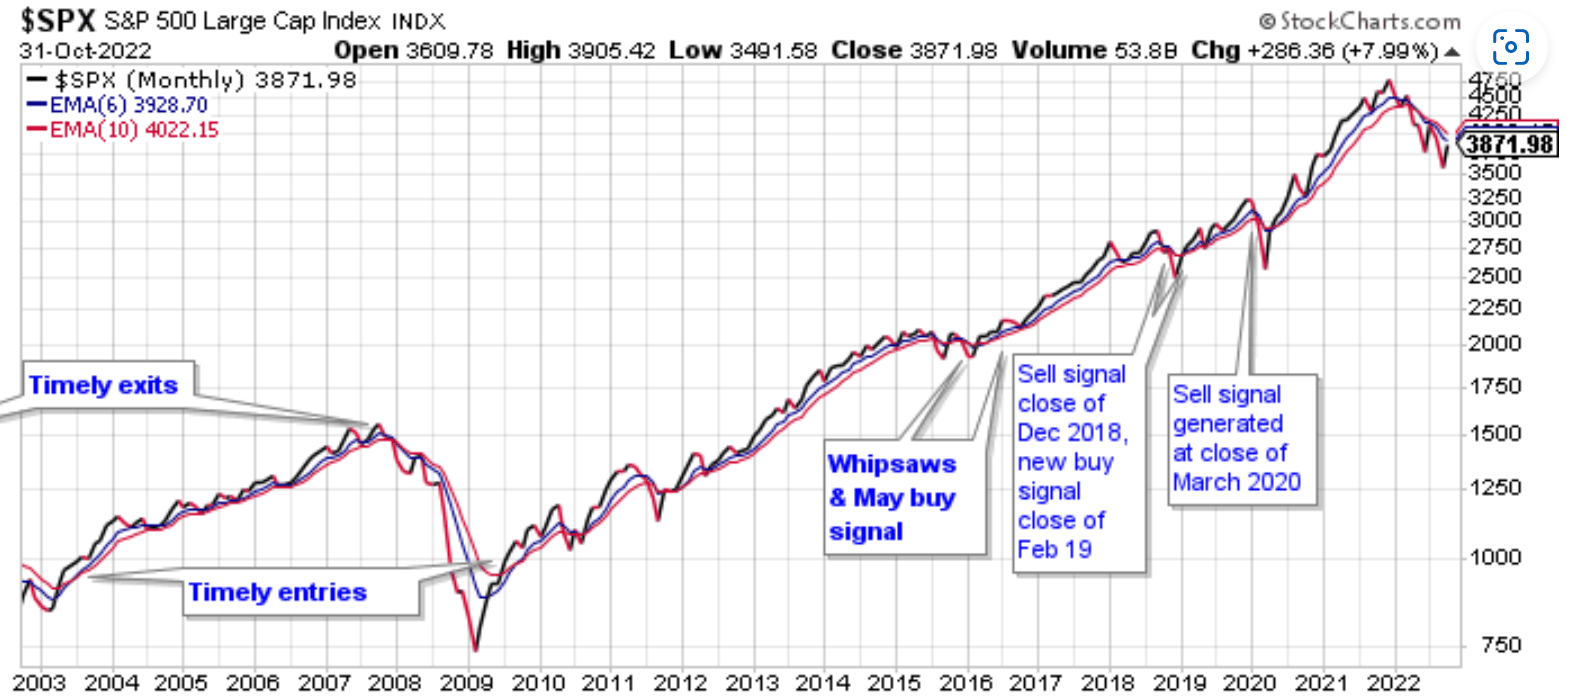
You can see that the moving average crossover system provided some excellent long-term buy and sell signals that would have allowed investors to capture long-duration moves in the index; while avoiding costly drawdowns. Avoiding these costly drawdowns allows me to meet the objective of capital reservation.
I employ this strategy because I do not want to experience a large drawdown with my pension assets. During the 2008 – 2009 market crash, many people didn’t even look at their retirement statements because they were afraid of what they would find. I submit that if those people would have used a market strategy like what I outline in this series of articles, they would have been able to avoid much of the decline during the bear market and consequently would have had less emotional stress during that time period.
The following charts show the current status of the ETFs that I am allowed to buy in my retirement account.
Chart 2 – Monthly SPY with 6/10 Moving Averages
www.stockcharts.com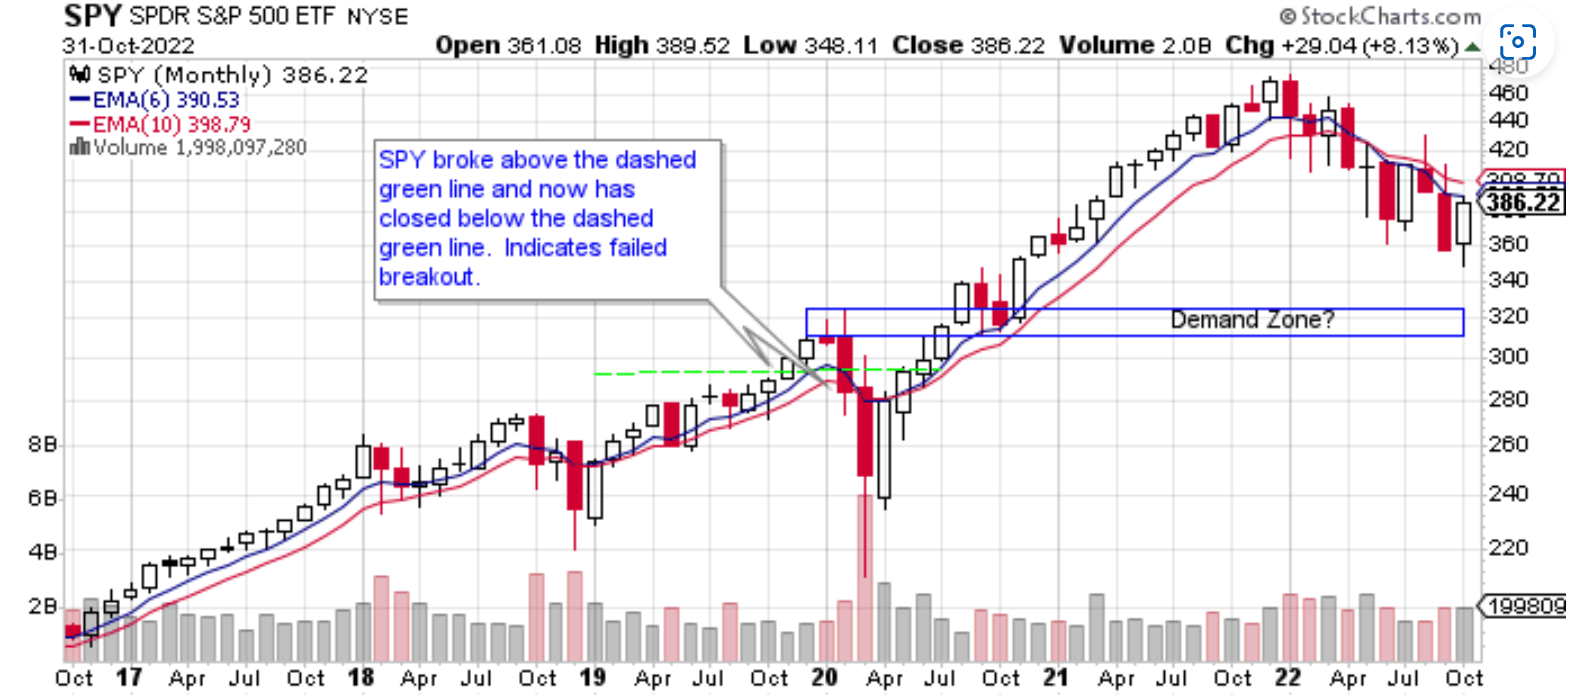
Chart 2 shows that SPY had a nice gain of 8.13% in October. Volume was about the same as last month. The SPY candle was bullish, finishing at the high end of its range. While all of that is good, SPY remains in bearish alignment. I would have liked to see SPY be able to close above its blue 6-month moving average. Doing so would make me more confident that this month’s rally was something more than a countertrend rally. At this point in time, SPY is still in a downtrend. As I look at Chart 2, I see a potential demand zone where bulls could step in, at the 320 level. The demand zone is outlined in blue. We will see where we go from here. For November, I am staying with my allocation of 40% to SPY. I will look to increase my exposure to SPY once SPY closes above its 10-month moving average, which is in red. Now that we are entering the seasonally strong period for stocks, (November-May), that could happen in the next month or two. Or we could be in for a challenging winter.
Chart 3 – Monthly IWM with 6/10 Moving Averages
www.stockcharts.com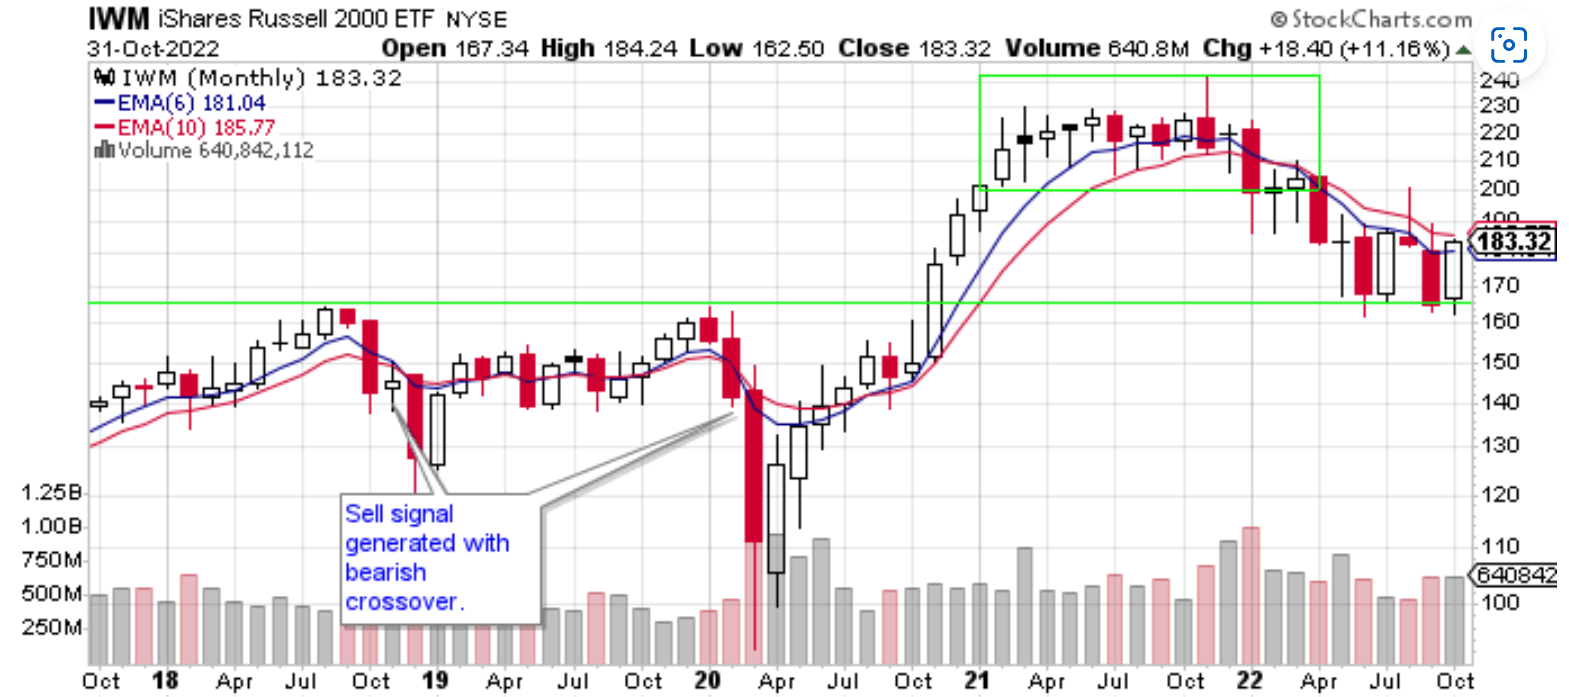
Chart 3 shows that small-cap stocks were the big winner in October. IWM gained 11.16% outperforming all other ETFs. While IWM remains in bearish alignment, IWM bulls must feel good about IWM closing above its blue 6-month moving average. With IWM being so strong, does that mean fears of a recession are done? I don’t know the answer to that question. It seems to me that small-cap stocks wouldn’t do well if recession fears, or a deepening recession was imminent. Another possibility is that IWM’s rally was just a strong countertrend rally. If IWM can close above its red 10-month moving average, then I will be a believer in a long-term IWM rally. November will be an interesting month for IWM.
Chart 4 – Monthly IWM:SPY Relative Strength
www.stockcharts.com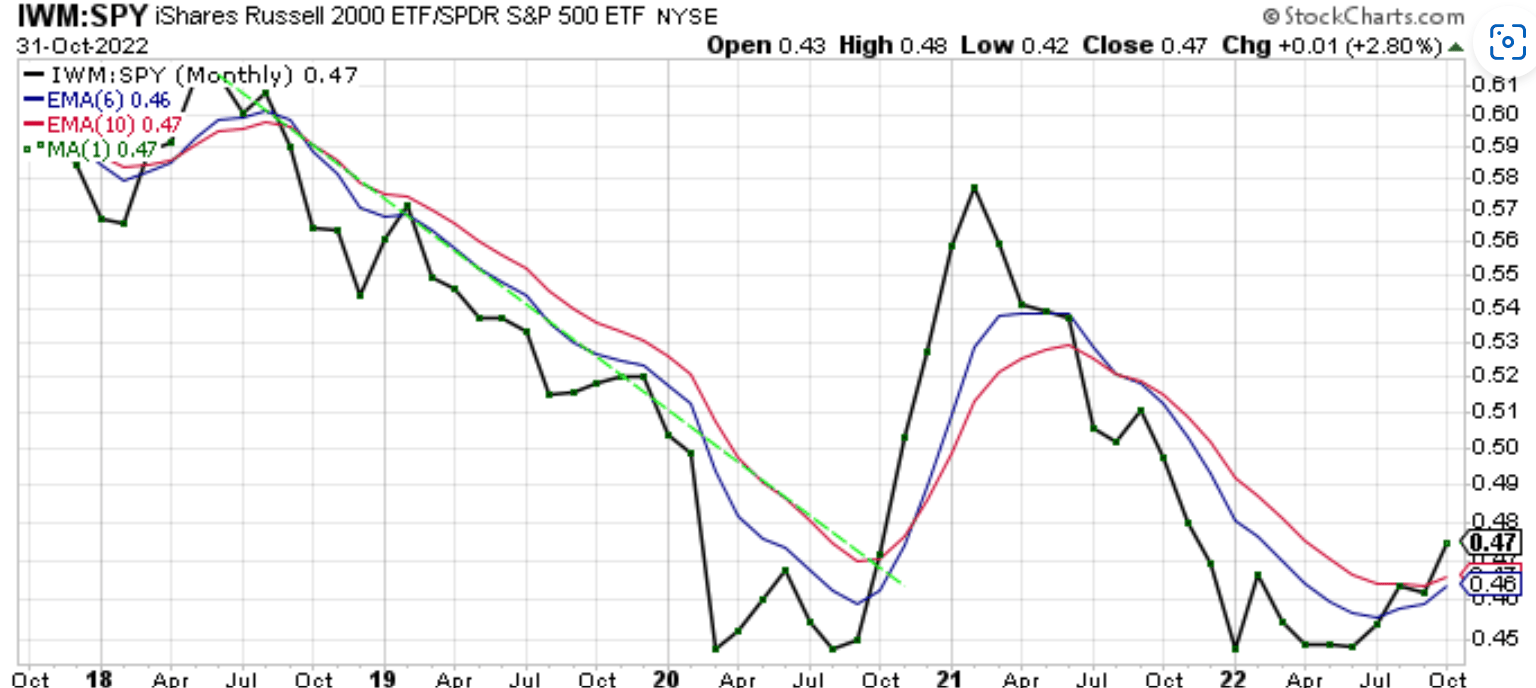
Chart 4 shows that the IWM:SPY ratio is perhaps bottoming. In October, the ratio cleared the blue 6-month and red 10-month moving averages. IWM is getting the best of SPY in the current market environment. While the ratio is in bearish alignment, the two moving averages seem to have flattened out and are turning higher. That can be seen as a bullish development. A small allocation to IWM could be made once IWM closes above its 10-month moving average on Chart 3.
Chart 5 – Monthly EFA with 6/10 Moving Averages
www.stockcharts.com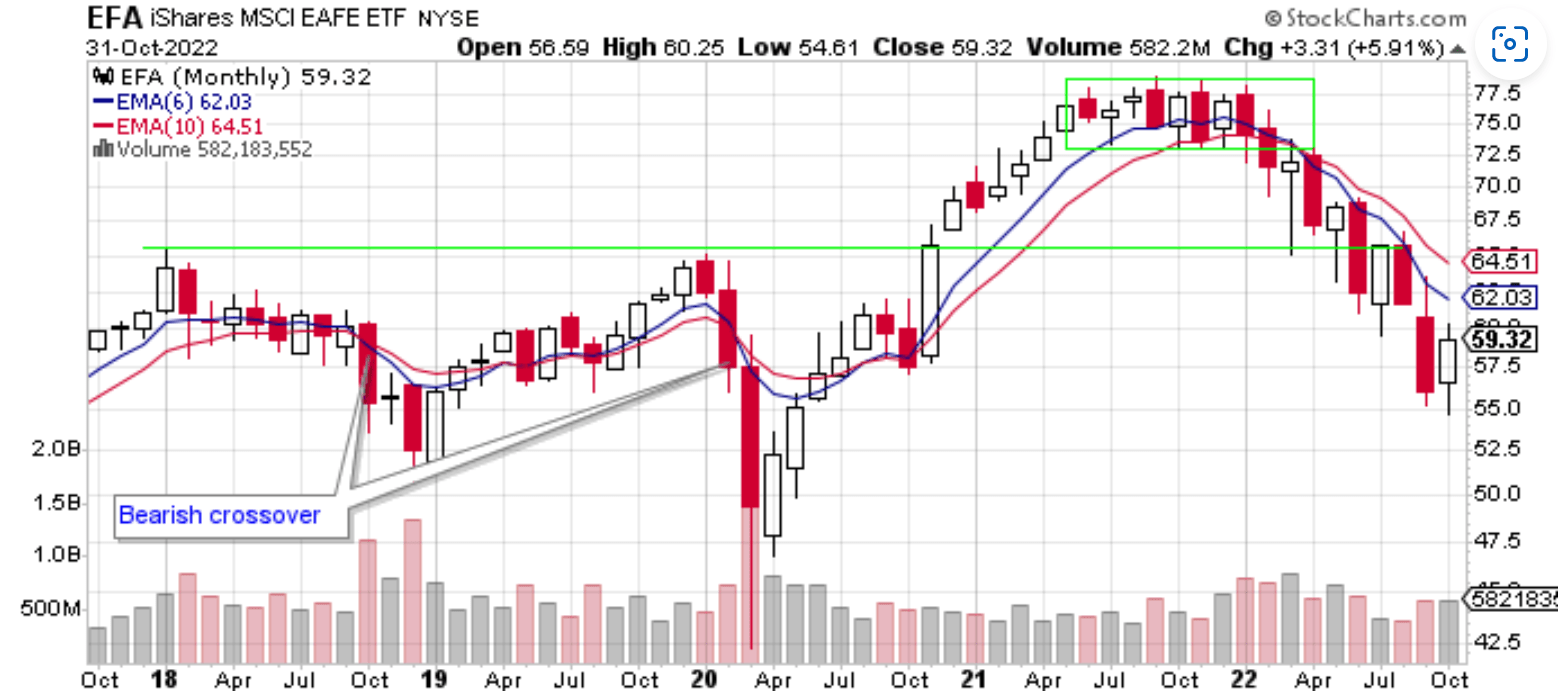
Chart 5 shows that EFA rose 5.91% in October. EFA remains in bearish alignment. Looking at Chart 5 I don’t see much in the way of support for EFA. EFA could test the COVID lows. As I wrote before, EFA has some work to do before I would consider allocating money to that ETF. I need to see EFA close above the red ten-month moving average.
Chart 6 – Monthly EFA:SPY Relative Strength
www.stockcharts.com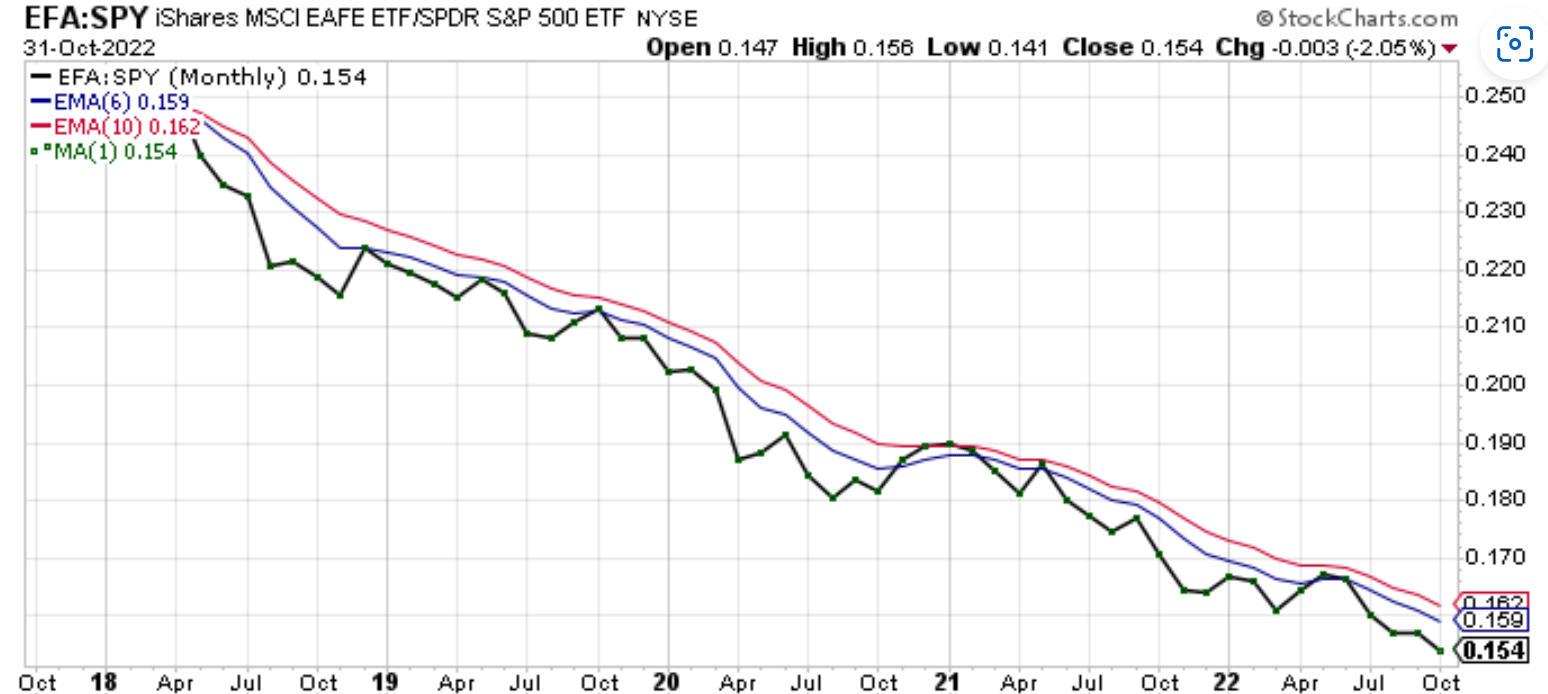
There is nothing new to report for Chart 6. The EFA:SPY ratio continued to fall in October. The ratio made a new low. When you’re looking at a price chart and you see price move from the upper left-hand corner to the lower right-hand corner of the chart, that is the textbook definition of a downtrend. I need to see this ratio close above the red 10-month moving average before I allocate money to EFA over SPY.
Chart 7 – Monthly EFA:IWM Relative Strength
www.stockcharts.com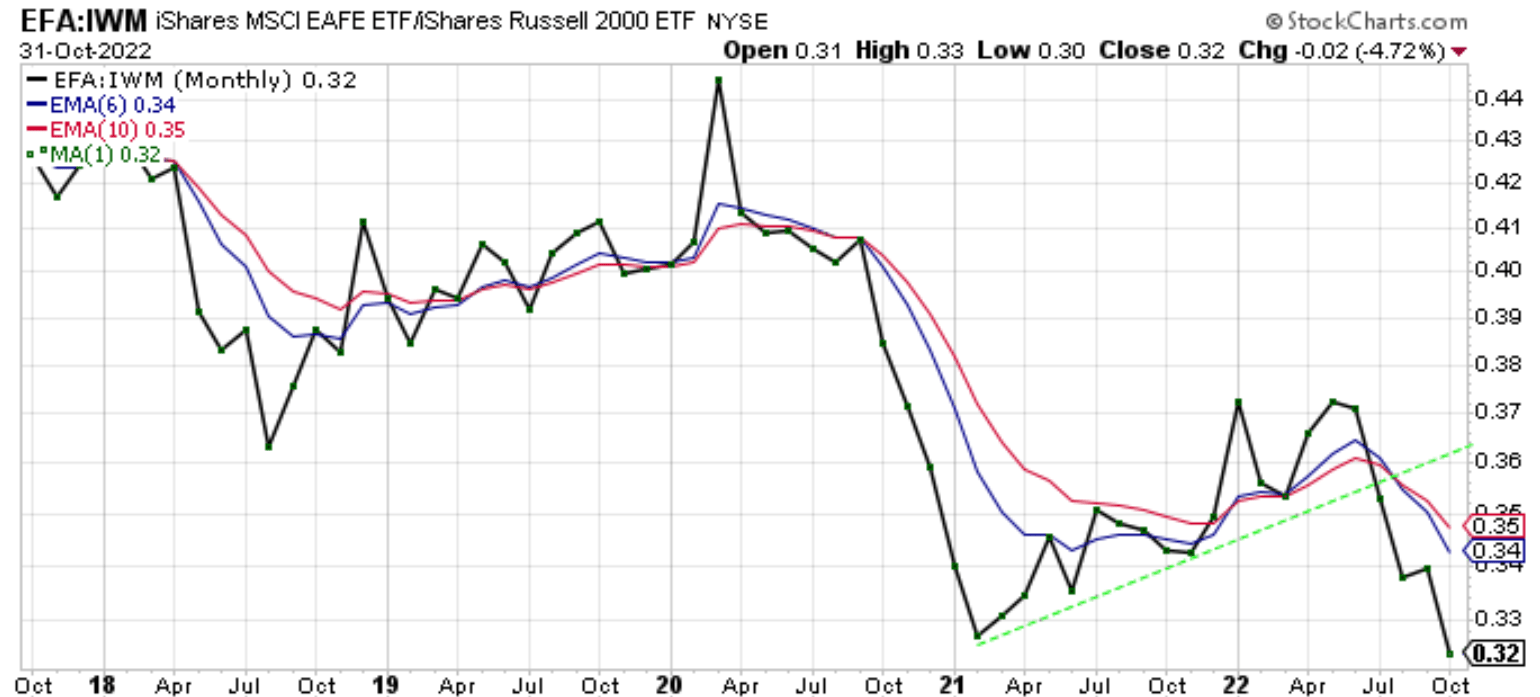
Chart 7 shows that EFA underperformed IWM in September by 4.72%. The ratio has flipped from being in bullish alignment to now being in bearish alignment with a new low. The recent series of higher highs and higher lows has been broken. I will continue to watch this chart to see how events unfold.
Chart 8 – Monthly AGG with 6/10 Moving Averages
www.stockcharts.com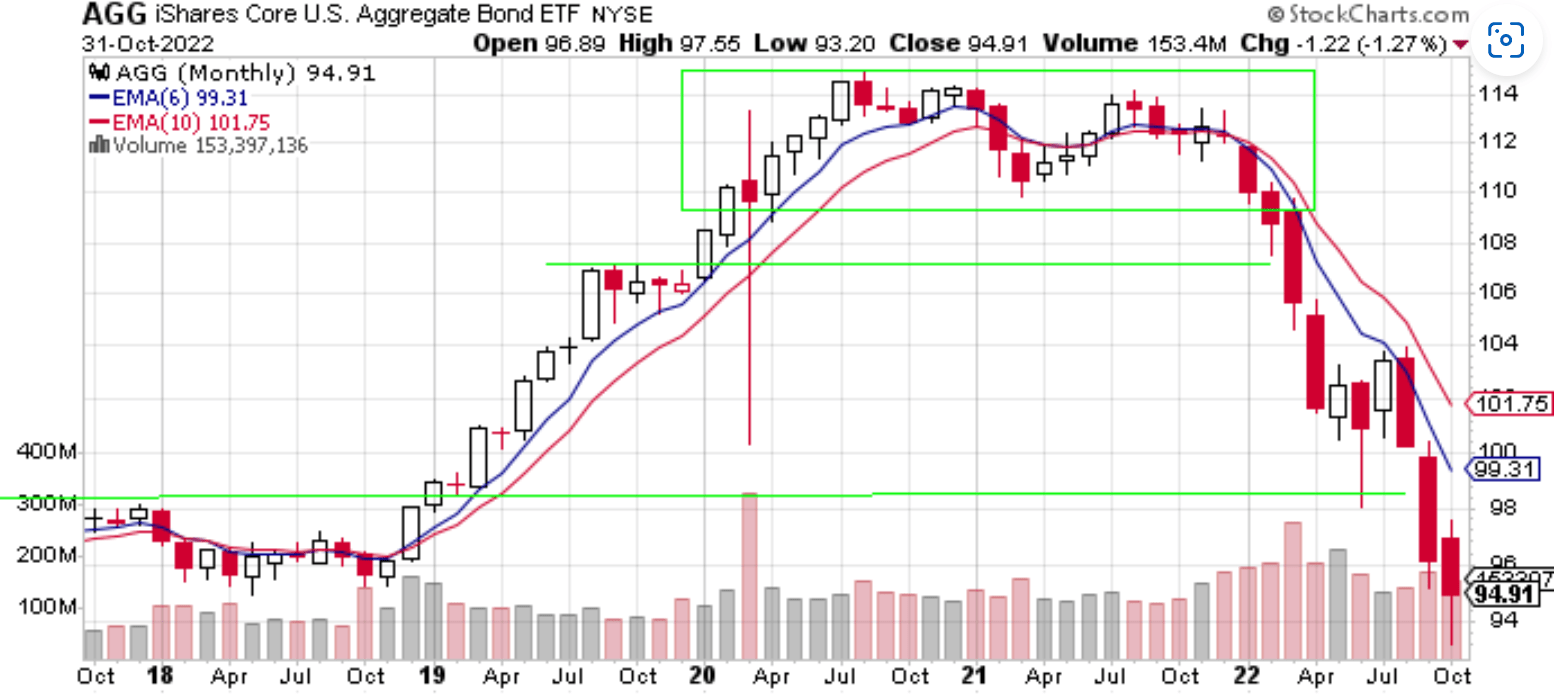
Chart 8 shows that AGG lost 1.27% in October. AGG was the only ETF in this article that lost money for October. AGG remains in bearish alignment, lost the green line of support, and the June lows. AGG is now at levels last seen in 2018. AGG is now down over 17% from its highs in August 2020.
Chart 9 – Monthly AGG:SPY Relative Strength
www.stockcharts.com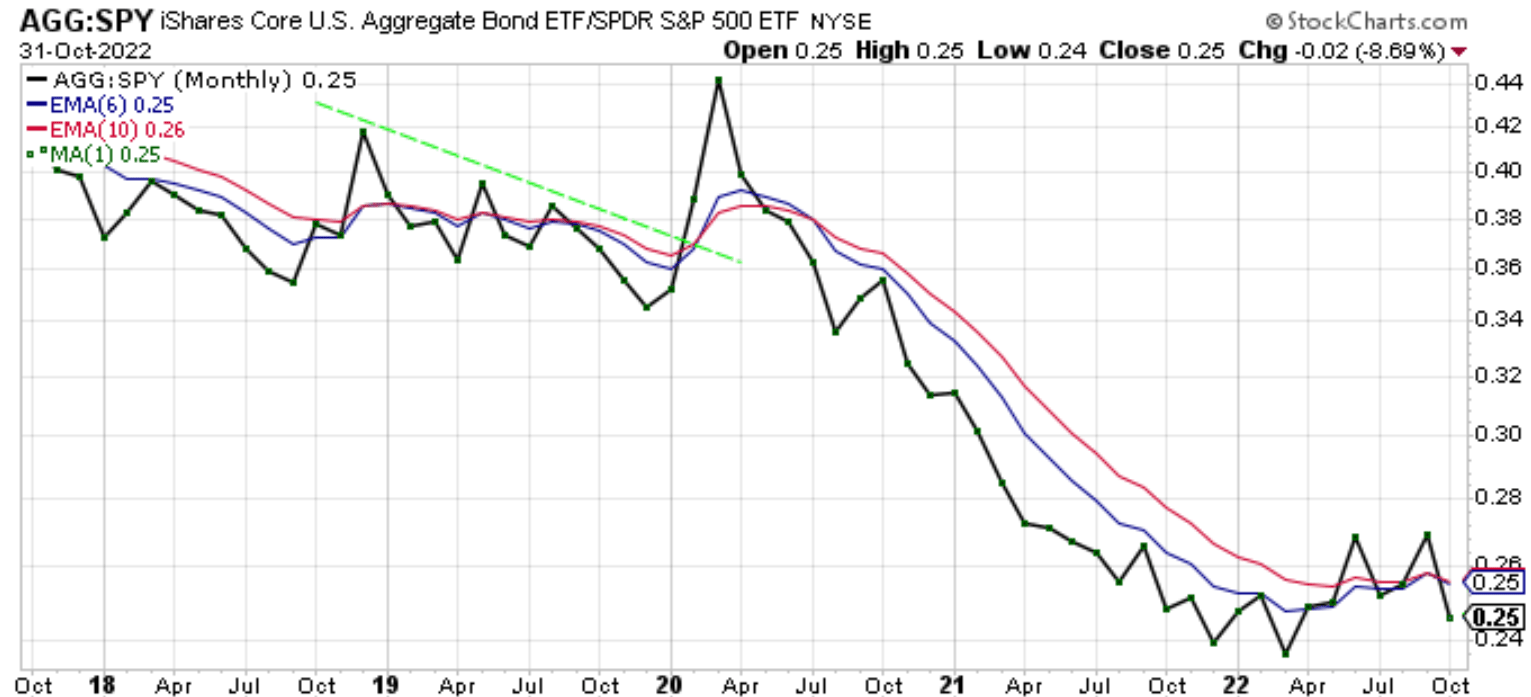
The AGG:SPY ratio in Chart 9 lost 8.69% as AGG underperformed SPY in October. The ratio was on the cusp of being in bullish alignment and is now heading lower.
In summary, all the equity ETFs made nice gains in October. AGG was the lone loser for the month. Despite the rallies, all the price charts are in bearish alignment.
There were some interesting developments. IWM managed to close above its blue 6-month moving average. The IWM:SPY ratio closed above its red 10-month moving average. Perhaps this is signaling the end of the bear market. It’s also possible that we are witnessing a to-be-expected countertrend rally.
Until I see equity price charts close above their red 10-month moving averages, I see no reason to get too excited about this being the end of the bear market. I am keeping my allocation of 40% in SPY and 60% in cash. That may be too conservative, and I can live with that. It could also be too aggressive. We will see. I just try to follow price and the trend. Right now, the trend for equities and bonds remains down. I will monitor the markets for the month of November and then reallocate, if necessary, at the end of the month.
Be the first to comment