

Darren415
2022 Review
The ProShares S&P 500 Dividend Aristocrats ETF (NOBL) gained a cool 10.31% in October and is thus far keeping the momentum going in November. Right after posting its second-worst monthly loss in September, NOBL follows up with its second-best month in October. The only better month was November of 2020 with the ETF gaining 11.96%. The current month is thus far looking strong as well, as the exchange-traded fund (“ETF”) is up 6.52% through November 22nd. If this positive momentum can be sustained for the remainder of the year, not only will NOBL not have its worst annual return since inspection, we can even see the fund finish 2022 in the green. 2018 was the only year NOBL finished with a negative total return, losing 3.29% during the year. As of November 22nd, NOBL has a year-to-date loss of 3.03%.
Not all of the dividend aristocrats are contributing equally to NOBL’s momentum rally; 30 dividend aristocrats are beating NOBL through October, and 21 still have positive returns on the year. That’s 12 more than a month ago. Here are the best-performing aristocrats in 2022 (through October):
- Exxon (XOM) +88.75%
- Chevron (CVX) +58.50%
- Cardinal Health (CAH) +51.23%
- Archer-Daniels-Midland (ADM) +45.53%
- Genuine Parts Company (GPC) +29.36%
- General Dynamics (GD) +22.50%
- Albemarle (ALB) +20.31%
- Nucor (NUE) +16.56%
- Grainger (GWW) +13.91%
- Aflac (AFL) +13.71%
- Sysco (SYY) +12.86%
- Chubb (CB) +12.56%
- AbbVie (ABBV) +12.36%
- IBM (IBM) +7.36%
- Pepsi (PEP) +6.65%
- Caterpillar (CAT) +6.60%
- Consolidated Edison (ED) +5.79%
- Johnson & Johnson (JNJ) +3.68%
- Atmos Energy (ATO) +3.56%
- McDonald’s (MCD) +3.40%
- Coca-Cola (KO) +3.37%
The S&P 500, as measured by SPY, gained 8.13% in October and is up 3.54% in November thus far (through 11/22). NOBL continues to outpace SPY this year with a year-to-date loss through 11/22 of 3.03% versus a loss of 18.45%. The dividend aristocrat ETF has beaten SPY for each of the last 11 months, and this trend looks to continue in November. The dividend aristocrats are not known to consistently beat the S&P 500 index, in fact, the dividend aristocrat index underperformed the S&P 500 index for 6 out of the last 7 full calendar years.
However, if you look further back in history, the dividend aristocrat index is outperforming the S&P 500 index by about 1.62% per year between 1990 and 2021. A significant portion of this long-term outperformance is attributable to the dot com bubble and the financial crisis as well as the immediate years following each market crash. This pattern was broken with the 2020 market crash, perhaps the much shorter duration of the crash and recovery are the reason. The dot com bubble and the financial crisis both extended for multiple years while the 2020 market crash was fully recovered in a matter of months.
Even though the dividend aristocrats have trailed the S&P for the better part of the last 7 years, long-term investors can rest assured that based on history, over a much longer time period, the dividend aristocrats can hold their own. There are currently 64 companies in the dividend aristocrat index but strong historical returns for the index can be attributed to only a handful of them. As an investor, I am always curious how to identify these drivers of outperformance.
I want to present 3 strategies that theoretically could identify winning aristocrats and lead to better performance than the dividend aristocrat index. These strategies work best with a buy and hold long-term investing approach as will be evidenced by the results. They are based on quantitative models that do not consider qualitative data, therefore it is prudent that further due diligence is performed on all chosen stocks.
The Most Undervalued Strategy
Strategy number 1 is a focus on valuation and more specifically it targets the potentially most undervalued dividend aristocrats. In theory, this is a long-term strategy since it may take some time to fully see the reward of leveraging a valuation approach. My preferred method for valuation is dividend yield theory, mainly for its simplicity. Unlike other valuation methods, dividend yield theory does not require making assumptions aside from assuming that a given stock will revert back to its long-term trailing dividend yield.
This valuation technique works best for mature businesses with long histories of dividend growth, making the dividend aristocrats an ideal pool of companies to value using this technique.
Selecting the 10 most undervalued dividend aristocrats each month and adopting a buy and hold investing approach can lead to long-term outperformance when/if the targeted stocks return to fair valuation. It may take a few months or even years to see if this strategy actually pays off. I predict that it will underperform NOBL for the first few months while we wait for bargain stocks to return to fair value.
|
Month |
Most Undervalued |
NOBL |
SPY |
|
Aug 21 |
0.49% |
1.87% |
2.98% |
|
Sep 21 |
-2.99% |
-5.69% |
-4.66% |
|
Oct 21 |
3.63% |
5.95% |
7.02% |
|
Nov 21 |
-2.19% |
-1.76% |
-0.80% |
|
Dec 21 |
10.37% |
6.54% |
4.63% |
|
Jan 22 |
1.04% |
-4.08% |
-5.27% |
|
Feb 22 |
-1.94% |
-2.59% |
-2.95% |
|
Mar 22 |
3.40% |
3.86% |
3.76% |
|
Apr 22 |
-2.14% |
-3.42% |
-8.78% |
|
May 22 |
3.11% |
0.31% |
0.23% |
|
Jun 22 |
-7.30% |
-6.73% |
-8.25% |
|
Jul 22 |
5.00% |
6.56% |
4.55% |
|
Aug 22 |
-3.25% |
-2.78% |
-4.08% |
|
Sep 22 |
-11.39% |
-9.15% |
-9.24% |
|
Oct 22 |
10.07% |
10.31% |
8.13% |
|
Nov 22 |
6.94% |
6.52% |
3.54% |
|
2021 Partial |
9.05% |
6.54% |
9.06% |
|
2022 YTD |
1.54% |
-3.03% |
-18.45% |
|
TOTAL |
10.72% |
3.31% |
-11.06% |
|
Alpha over NOBL |
7.41% |
||
|
Alpha over SPY |
21.79% |
The table above shows the monthly and annual returns for the buy-and-hold portfolio of the most undervalued strategy.
The portfolio finished October with a gain of 10.7%, losing to NOBL by 0.24% but beating SPY by 1.94%. Through November 22nd the portfolio has a return of 6.94% and is beating both NOBL and SPY. As a result, the portfolio, is making up some more alpha this month to NOBL and SPY. On a year-to-date basis, the portfolio is outperforming NOBL by 4.57% and SPY by 19.99%. Since inception this portfolio has generated 7.41% of alpha over NOBL and 21.79% of alpha over SPY.
The portfolio consists of 31 unique present and former dividend aristocrats. I track this portfolio by investing $1,000 each month equally split among the 10 chosen aristocrats for that month. The positions are never trimmed or sold and all dividends are reinvested back into the issuing stock. Here are all of the positions, the current market value, capital invested, total return and allocation as of November 22nd.
|
TICKER |
MARKET VALUE |
CAPITAL INVESTED |
TOTAL RETURN |
CURRENT ALLOCATION |
|
ABBV |
157.20 |
100 |
57.20% |
0.93% |
|
AFL |
378.18 |
300 |
26.06% |
2.23% |
|
AMCR |
315.22 |
300 |
5.07% |
1.86% |
|
AOS |
212.03 |
200 |
6.01% |
1.25% |
|
APD |
127.98 |
100 |
27.98% |
0.75% |
|
ATO |
977.04 |
800 |
22.13% |
5.76% |
|
BDX |
103.23 |
100 |
3.23% |
0.61% |
|
BEN |
810.58 |
800 |
1.32% |
4.78% |
|
CAH |
661.79 |
400 |
65.45% |
3.90% |
|
CLX |
1,410.13 |
1400 |
0.72% |
8.32% |
|
CVX |
582.95 |
300 |
94.32% |
3.44% |
|
ECL |
826.90 |
900 |
-8.12% |
4.88% |
|
ED |
532.73 |
400 |
33.18% |
3.14% |
|
GD |
262.37 |
200 |
31.18% |
1.55% |
|
HRL |
797.73 |
700 |
13.96% |
4.71% |
|
IBM |
256.88 |
200 |
28.44% |
1.52% |
|
KMB |
111.62 |
100 |
11.62% |
0.66% |
|
LEG |
89.88 |
100 |
-10.12% |
0.53% |
|
LOW |
575.44 |
500 |
15.09% |
3.39% |
|
MDT |
677.33 |
800 |
-15.33% |
4.00% |
|
MKC |
218.69 |
200 |
9.35% |
1.29% |
|
MMM |
1,023.54 |
1100 |
-6.95% |
6.04% |
|
PPG |
205.76 |
200 |
2.88% |
1.21% |
|
SHW |
227.08 |
200 |
13.54% |
1.34% |
|
SWK |
672.77 |
800 |
-15.90% |
3.97% |
|
T |
745.72 |
700 |
6.53% |
4.40% |
|
TGT |
106.38 |
100 |
6.38% |
0.63% |
|
TROW |
929.23 |
900 |
3.25% |
5.48% |
|
VFC |
922.81 |
1300 |
-29.01% |
5.44% |
|
WBA |
1,602.96 |
1600 |
0.18% |
9.46% |
|
XOM |
429.45 |
200 |
114.72% |
2.53% |
|
TOTAL |
16,951.62 |
Here are the 10 most undervalued dividend aristocrats chosen for the month of December. The table below shows potential undervaluation (column Valuation) for each of the 10 chosen aristocrats. The data is from November 23rd so the current dividend yield may differ slightly from the stated yield.
Created by Author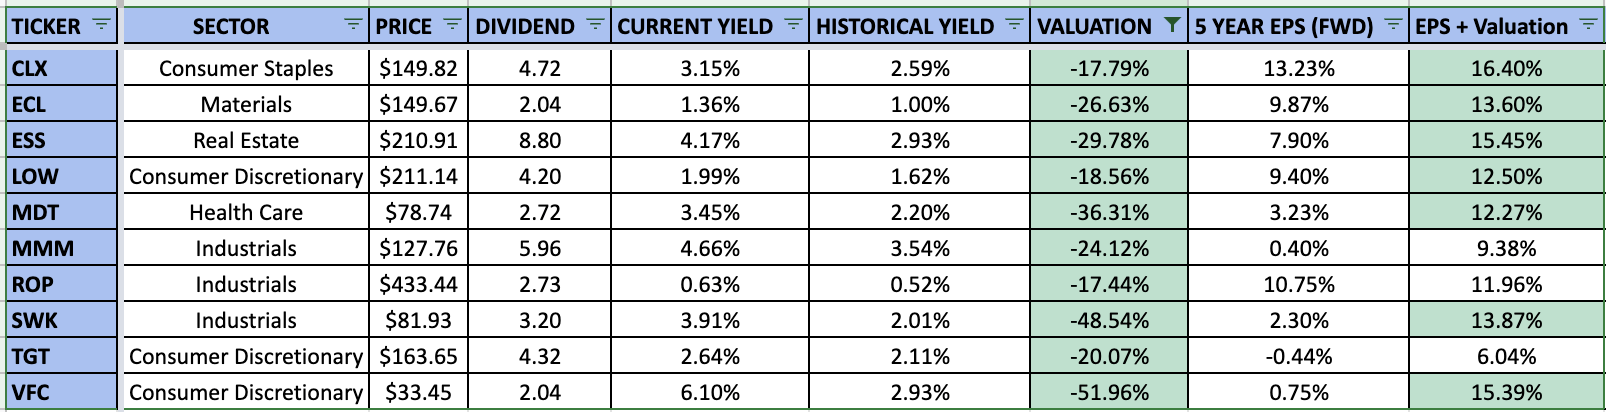
The Fastest Expected Growth Strategy
Strategy number 2 is a focus on dividend aristocrats that are expected to grow the fastest in the near future. Historically, there has been a correlation between earnings per share growth and share price appreciation. Companies that have grown their earnings faster have also seen higher total returns. One way to gauge how fast earnings for a company will grow is to leverage analyst forecasts. For this strategy, I decided to use a discounted five-year EPS growth forecast combined with a return to fair valuation and the dividend yield to identify the 10 best aristocrats poised for the best total return in the future.
|
Month |
Fastest Growth |
NOBL |
SPY |
|
Aug 21 |
5.12% |
1.87% |
2.98% |
|
Sep 21 |
-4.42% |
-5.69% |
-4.66% |
|
Oct 21 |
5.92% |
5.95% |
7.02% |
|
Nov 21 |
-2.06% |
-1.76% |
-0.80% |
|
Dec 21 |
7.09% |
6.54% |
4.63% |
|
Jan 22 |
-4.42% |
-4.08% |
-5.27% |
|
Feb 22 |
-0.10% |
-2.59% |
-2.95% |
|
Mar 22 |
3.71% |
3.86% |
3.76% |
|
Apr 22 |
-2.19% |
-3.42% |
-8.78% |
|
May 22 |
0.12% |
0.31% |
0.23% |
|
Jun 22 |
-8.94% |
-6.73% |
-8.25% |
|
Jul 22 |
6.09% |
6.56% |
4.55% |
|
Aug 22 |
-2.69% |
-2.78% |
-4.08% |
|
Sep 22 |
-11.37% |
-9.15% |
-9.24% |
|
Oct 22 |
13.68% |
10.31% |
8.13% |
|
Nov 22 |
6.07% |
6.52% |
3.54% |
|
2021 Partial |
11.62% |
6.54% |
9.06% |
|
2022 YTD |
-2.58% |
-3.03% |
-18.45% |
|
TOTAL |
8.74% |
3.31% |
-11.06% |
|
Alpha over NOBL |
5.42% |
||
|
Alpha over SPY |
19.80% |
The table above shows the monthly and annual returns for the buy-and-hold portfolio of the fastest expected growth strategy.
The portfolio finished October with a gain of 13.68%, beating NOBL by 3.37% and SPY by 5.55%. Through November 22nd the portfolio is up 6.07%, so far trailing NOBL and beating SPY. The portfolio has gained some momentum in the stock market rally we are currently enjoying. The portfolio continues to remain ahead of NOBL on the year with a lead of 0.45%, and remains ahead of SPY, by 15.87%. Since inception, this portfolio has generated 5.42% of alpha over NOBL and 19.80% of alpha over SPY.
The portfolio consists of 28 unique present and former dividend aristocrats. I track this portfolio by investing $1,000 each month equally split amongst the 10 chosen aristocrats for that month. The positions are never trimmed or sold and all dividends are reinvested back into the issuing stock. People’s United (PBCT) was removed from the portfolio in April, as the company was acquired by M&T Bank (MTB); the value of the position was reinvested equally amongst the 10 chosen aristocrats for April. Here are all of the positions, the current market value, capital invested, total return and allocation as of November 22nd.
|
TICKER |
MARKET VALUE |
CAPITAL INVESTED |
TOTAL RETURN |
CURRENT ALLOCATION |
|
ALB |
1,062.69 |
900 |
18.08% |
6.34% |
|
APD |
126.07 |
100 |
26.07% |
0.75% |
|
CAT |
1,334.72 |
1100 |
21.34% |
7.97% |
|
CB |
1,160.43 |
1000 |
16.04% |
6.93% |
|
CINF |
112.20 |
100 |
12.20% |
0.67% |
|
CLX |
104.20 |
100 |
4.20% |
0.62% |
|
CVX |
114.52 |
100 |
14.52% |
0.68% |
|
ECL |
583.26 |
700 |
-16.68% |
3.48% |
|
GWW |
123.77 |
100 |
23.77% |
0.74% |
|
IBM |
1,228.24 |
1000 |
22.82% |
7.33% |
|
ITW |
216.30 |
200 |
8.15% |
1.29% |
|
LIN |
315.73 |
300 |
5.24% |
1.88% |
|
LOW |
639.31 |
600 |
6.55% |
3.82% |
|
MCD |
791.69 |
700 |
13.10% |
4.73% |
|
MDT |
524.52 |
600 |
-12.58% |
3.13% |
|
MMM |
289.79 |
300 |
-3.40% |
1.73% |
|
NUE |
2,011.02 |
1500 |
34.07% |
12.00% |
|
O |
104.87 |
100 |
4.87% |
0.63% |
|
PPG |
521.92 |
500 |
4.38% |
3.11% |
|
PBCT |
200 |
-100.00% |
0.00% |
|
|
SHW |
104.89 |
100 |
4.89% |
0.63% |
|
SWK |
650.78 |
800 |
-18.65% |
3.88% |
|
SYY |
1,782.44 |
1600 |
11.40% |
10.64% |
|
T |
104.76 |
100 |
4.76% |
0.63% |
|
TGT |
510.61 |
500 |
2.12% |
3.05% |
|
TROW |
833.38 |
800 |
4.17% |
4.97% |
|
VFC |
1,091.82 |
1600 |
-31.76% |
6.52% |
|
WST |
192.35 |
200 |
-3.83% |
1.15% |
|
XOM |
118.92 |
100 |
18.92% |
0.71% |
|
TOTAL |
16,755.20 |
Here are the 10 dividend aristocrats poised for the best total return right now. The table below shows the expected growth rate (column EPS + Valuation) for each of the 10 chosen aristocrats. The data is from November 23rd so the current dividend yield may differ slightly from the stated yield.
Created by Author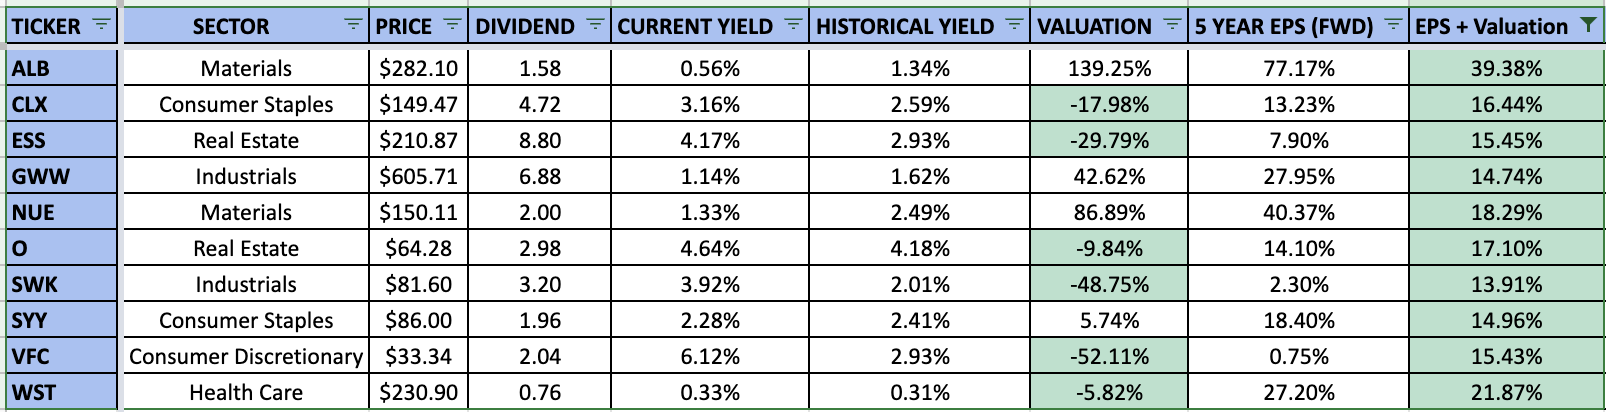
The Blended Strategy
Strategy 3 is a blend of the first two strategies, with a focus on the fastest expected growth but applied only to undervalued aristocrats. A blend of undervaluation and expected growth could narrow down the best aristocrats between the two strategies. The most undervalued aristocrats may not necessarily be poised for the fastest growth. Additionally targeting only undervalued aristocrats can offer a margin of safety in that securities are purchased for fair or better prices.
|
Month |
Blended |
NOBL |
SPY |
|
Aug 21 |
2.64% |
1.87% |
2.98% |
|
Sep 21 |
-3.42% |
-5.69% |
-4.66% |
|
Oct 21 |
2.70% |
5.95% |
7.02% |
|
Nov 21 |
-2.56% |
-1.76% |
-0.80% |
|
Dec 21 |
10.07% |
6.54% |
4.63% |
|
Jan 22 |
-0.71% |
-4.08% |
-5.27% |
|
Feb 22 |
0.49% |
-2.59% |
-2.95% |
|
Mar 22 |
3.48% |
3.86% |
3.76% |
|
Apr 22 |
-5.04% |
-3.42% |
-8.78% |
|
May 22 |
1.28% |
0.31% |
0.23% |
|
Jun 22 |
-6.23% |
-6.73% |
-8.25% |
|
Jul 22 |
4.56% |
6.56% |
4.55% |
|
Aug 22 |
-3.29% |
-2.78% |
-4.08% |
|
Sep 22 |
-10.88% |
-9.15% |
-9.24% |
|
Oct 22 |
9.97% |
10.31% |
8.13% |
|
Nov 22 |
5.78% |
6.52% |
3.54% |
|
2021 Partial |
9.18% |
6.54% |
9.06% |
|
2022 YTD |
-2.37% |
-3.03% |
-18.45% |
|
TOTAL |
6.60% |
3.31% |
-11.06% |
|
Alpha over NOBL |
3.29% |
||
|
Alpha over SPY |
17.66% |
The table above shows the monthly and annual returns for the buy-and-hold portfolio of the fastest expected growth strategy.
The portfolio gained 9.97% in October, trailing NOBL by 0.34% and beating SPY by 1.84%. Through November 22nd the portfolio is up 5.78% and is again trailing NOBL but beating SPY. Year-to-date the portfolio is down 2.37% which is slightly better than NOBL, down 3.03%, and better than SPY that is down 18.45%. Since inception, this portfolio has generated alpha of 3.29% over NOBL and 17.66% over SPY.
The portfolio consists of 33 unique present and former dividend aristocrats. I track this portfolio by investing $1,000 each month equally split amongst the 10 chosen aristocrats for that month. The positions are never trimmed or sold and all dividends are reinvested back into the issuing stock. People’s United (PBCT) was removed from the portfolio in April as the company was acquired by M&T Bank; the value of the position was reinvested equally amongst the 10 chosen aristocrats for April. Here are all of the positions: the current market value; capital invested; total return; and allocation as of November 22nd.
|
TICKER |
MARKET VALUE |
CAPITAL INVESTED |
TOTAL RETURN |
CURRENT ALLOCATION |
|
ABT |
106.47 |
100 |
6.47% |
0.65% |
|
AMCR |
315.22 |
300 |
5.07% |
1.91% |
|
AOS |
190.84 |
200 |
-4.58% |
1.16% |
|
APD |
647.24 |
500 |
29.45% |
3.93% |
|
ATO |
757.16 |
600 |
26.19% |
4.60% |
|
BDX |
402.00 |
400 |
0.50% |
2.44% |
|
BEN |
180.62 |
200 |
-9.69% |
1.10% |
|
CAH |
504.59 |
300 |
68.20% |
3.06% |
|
CAT |
135.13 |
100 |
35.13% |
0.82% |
|
CINF |
232.82 |
200 |
16.41% |
1.41% |
|
CLX |
104.20 |
100 |
4.20% |
0.63% |
|
CTAS |
270.92 |
200 |
35.46% |
1.64% |
|
ECL |
927.84 |
1000 |
-7.22% |
5.63% |
|
GD |
655.70 |
500 |
31.14% |
3.98% |
|
HRL |
691.62 |
600 |
15.27% |
4.20% |
|
IBM |
1,459.78 |
1100 |
32.71% |
8.86% |
|
ITW |
117.67 |
100 |
17.67% |
0.71% |
|
KMB |
139.97 |
100 |
39.97% |
0.85% |
|
LOW |
348.44 |
300 |
16.15% |
2.12% |
|
MDT |
917.76 |
1100 |
-16.57% |
5.57% |
|
MMM |
1,087.83 |
1300 |
-16.32% |
6.60% |
|
O |
218.34 |
200 |
9.17% |
1.33% |
|
PBCT |
200 |
-100.00% |
0.00% |
|
|
PPG |
439.01 |
400 |
9.75% |
2.67% |
|
ROP |
99.43 |
100 |
-0.57% |
0.60% |
|
SHW |
654.87 |
600 |
9.15% |
3.98% |
|
SWK |
702.38 |
900 |
-21.96% |
4.26% |
|
SYY |
684.87 |
600 |
14.15% |
4.16% |
|
T |
104.76 |
100 |
4.76% |
0.64% |
|
TGT |
510.61 |
500 |
2.12% |
3.10% |
|
TROW |
916.44 |
900 |
1.83% |
5.56% |
|
VFC |
938.18 |
1300 |
-27.83% |
5.70% |
|
WBA |
581.07 |
600 |
-3.15% |
3.53% |
|
XOM |
429.45 |
200 |
114.72% |
2.61% |
|
TOTAL |
16,473.24 |
Here are the 10 dividend aristocrats chosen for the blended strategy for December. The table below shows potential undervaluation (column Valuation) and the expected growth rate (column EPS + Valuation) for each of the 10 chosen aristocrats. The data is from November 23rd, so the current dividend yield may differ slightly from the stated yield.
Created by Author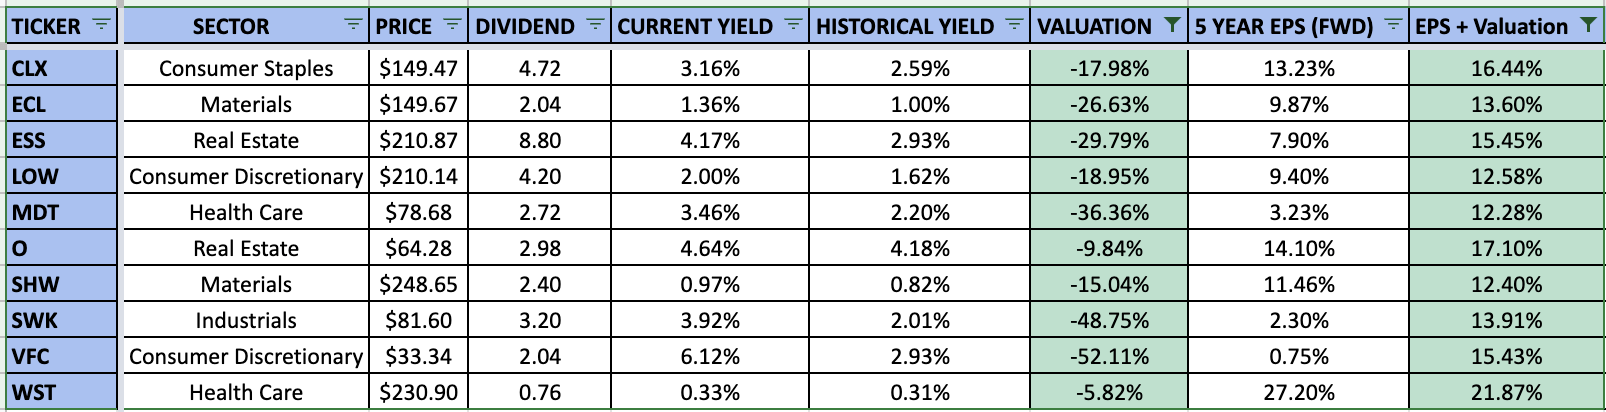
Performance Review
The 10 chosen aristocrats for the most undervalued strategy are up 7.02% in November and beating NOBL by 0.50%. The fastest expected growth strategy selections are up 3.47% and trailing NOBL by 3.05%. The blended strategy is up 3.88% this month and trailing NOBL by 2.64%. All strategies except the most undervalued are struggling this month. However, each buy-and-hold portfolio is performing better significantly better. I still believe that a buy-and-hold approach is the optimal investing method for these strategies and performance should be measured over longer periods of time.
The best performing selection from all 3 strategies in November is VFC, with a gain of 19.19%.
Here is a comparison of the buy-and-hold portfolios and the individual monthly selections for each strategy. As you can see the buy-and-hold portfolios are still performing much better than if we bought and sold the 10 chosen aristocrats each month. A buy-and-hold approach is also a much more tax friendly investing strategy.
|
Type |
Most Undervalued |
Fastest Growth |
Blended |
NOBL |
|
Individual |
-5.11% |
0.44% |
1.10% |
3.31% |
|
Buy-and-Hold |
10.72% |
8.74% |
6.60% |
3.31% |
|
O/U |
15.83% |
8.30% |
5.50% |
0.00% |
Final Thoughts
I personally believe each of the 3 strategies outlined above can theoretically beat the dividend aristocrat index over a long period of time. These strategies are based on simple principles of valuation and expected returns, and they are easy to understand and implement. Investors should keep in mind that selecting individual stocks carries more risk than investing in an index. The simplest and possibly the safest way to invest in the dividend aristocrats is to purchase shares of NOBL. The fund finished 2021 with a fantastic return and has an annualized rate of return of 11.17% since inception.
The dividend aristocrat data in the images of this article came from my live Google spreadsheet that tracks all of the current dividend aristocrats. Because this data is updated continuously throughout the day, you may notice slightly different data for the same company across the images.
Be the first to comment