

Ed Lallo
Introduction
Murphy Oil Corporation (NYSE:MUR) is an independent global oil and natural gas exploration and production company that I have followed on Seeking Alpha since October 2017.
The company released its fourth-quarter and full-year 2022 results on January 26, 2023. Company presentation can be accessed by clicking here.
Note: This article is an update of my preceding article, published on November 7, 2022.
1 – 4Q22 and Full-year 2022 Results Snapshot
The company posted a fourth-quarter 2022 adjusted net income, excluding discontinued operations and other one-off items, of $1.10 per diluted share, beating slightly analysts’ expectations.
The 2022 adjusted earnings per share were $5.59, up 333% from $1.29 per share in the year-ago period.
MUR 4Q22 Highlight Presentation (MUR Presentation)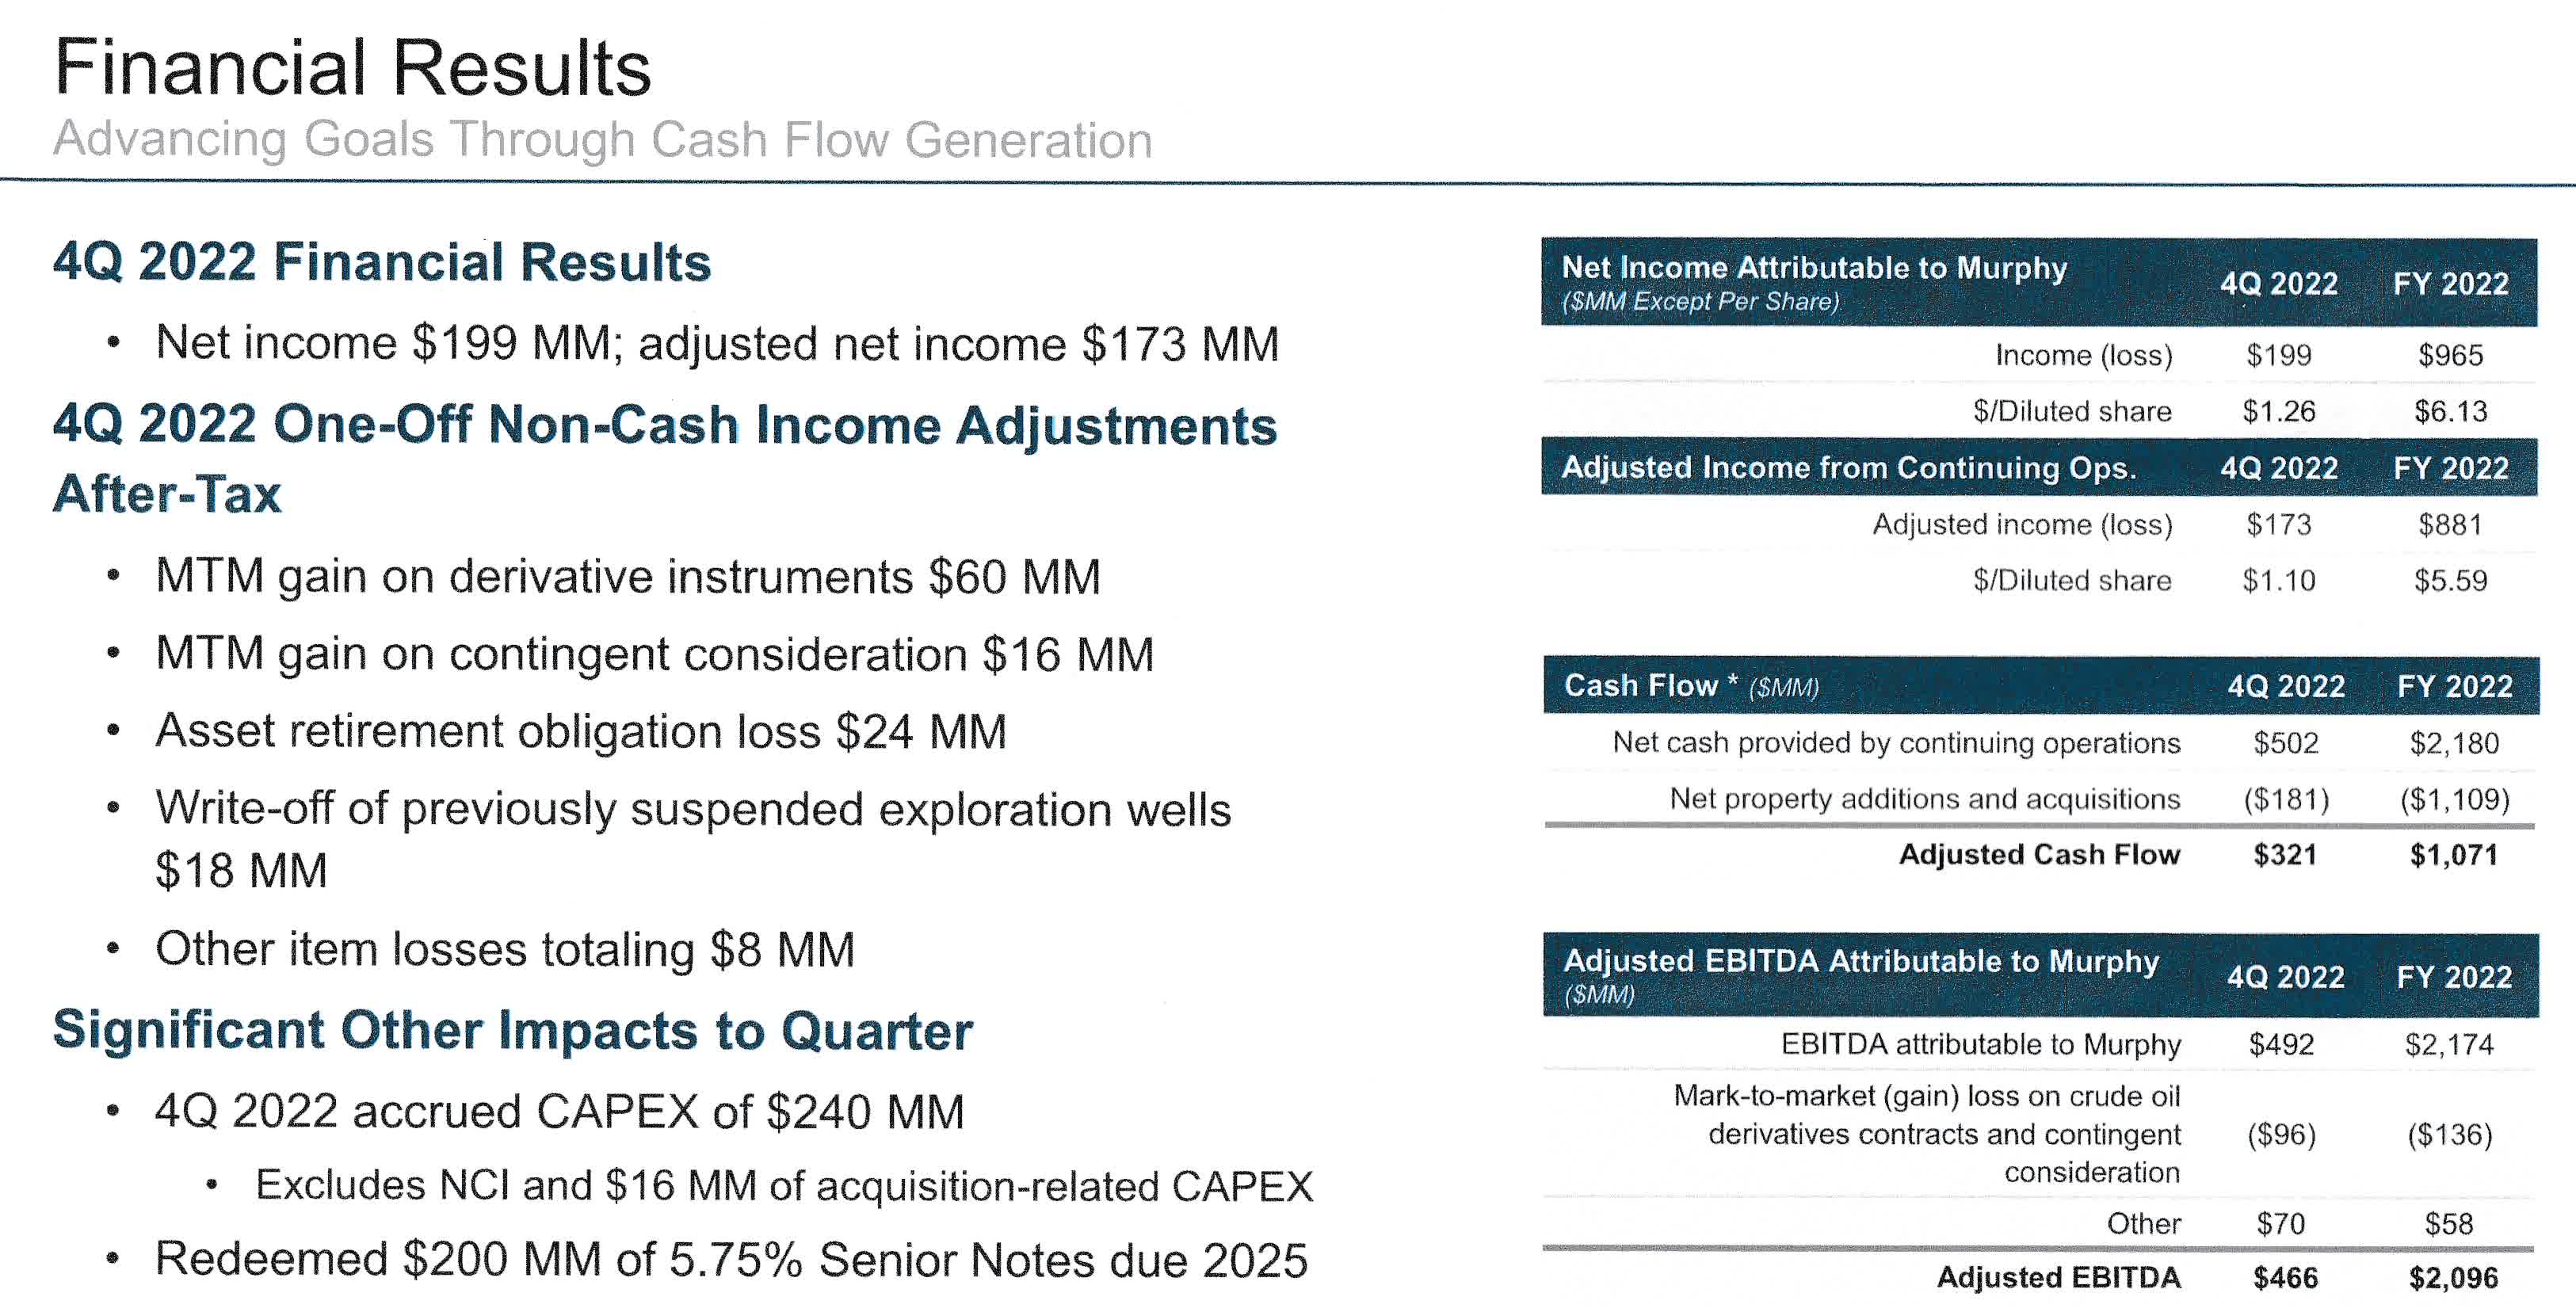
Murphy Oil’s revenues of $975.219 million in 4Q22 beat revenue expectations. Revenues improved from the prior-year quarter of $738.953 million. During 2022 total revenues were $3,932.7 million, up 71% year over year.
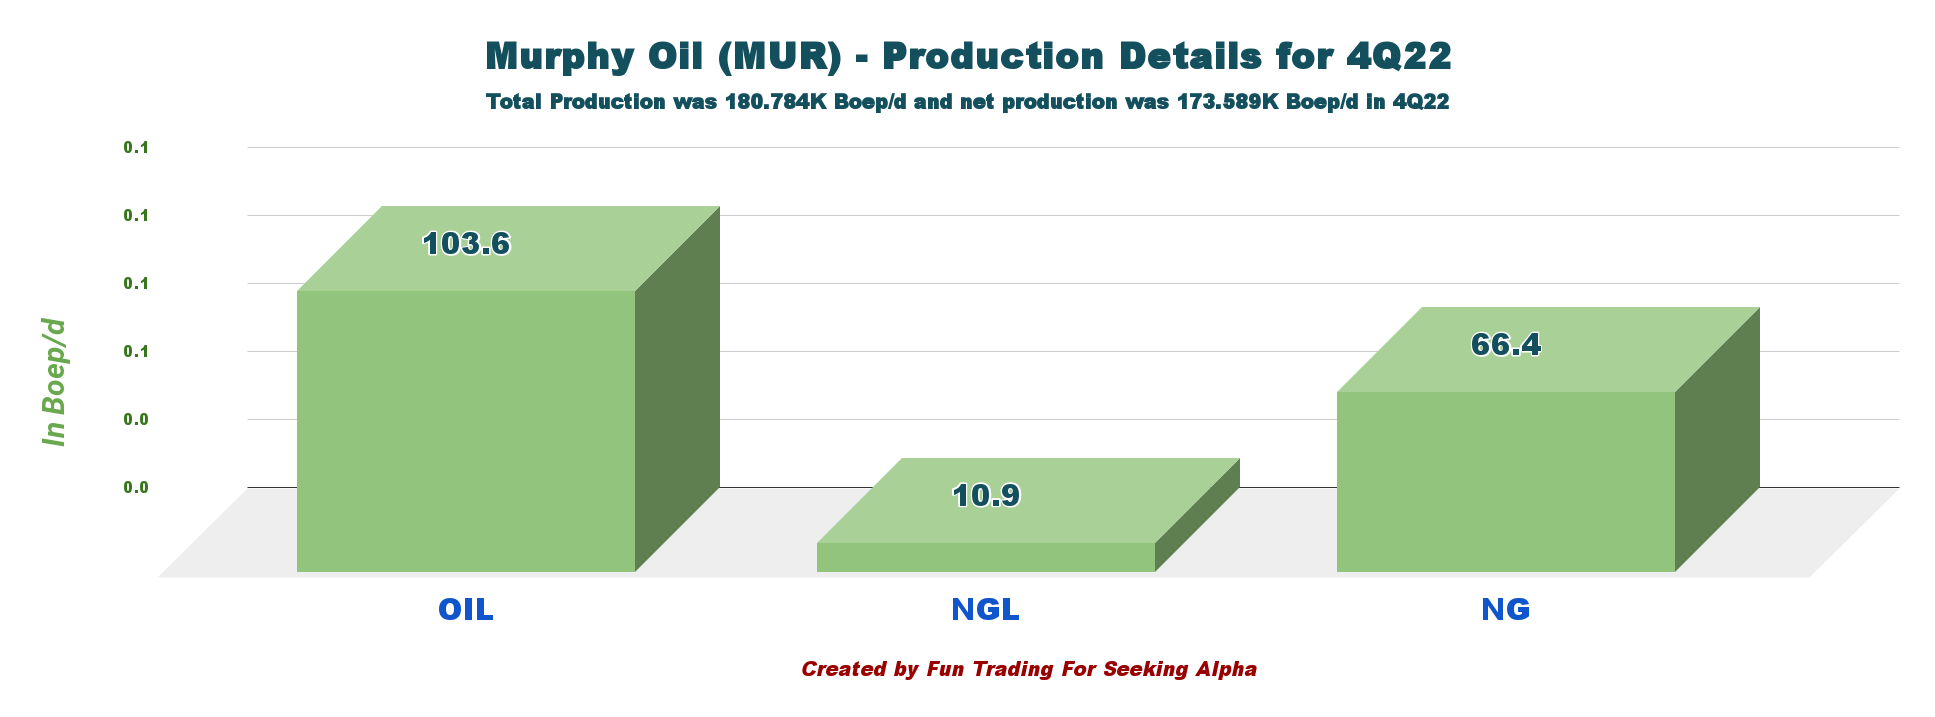
The E&P company produced 173.589K Boep/d in the fourth quarter (excluding noncontrolling interest in GOM), comprising 62% of liquids.
MUR Production Details and Revenue in 4Q22 (MUR Presentation)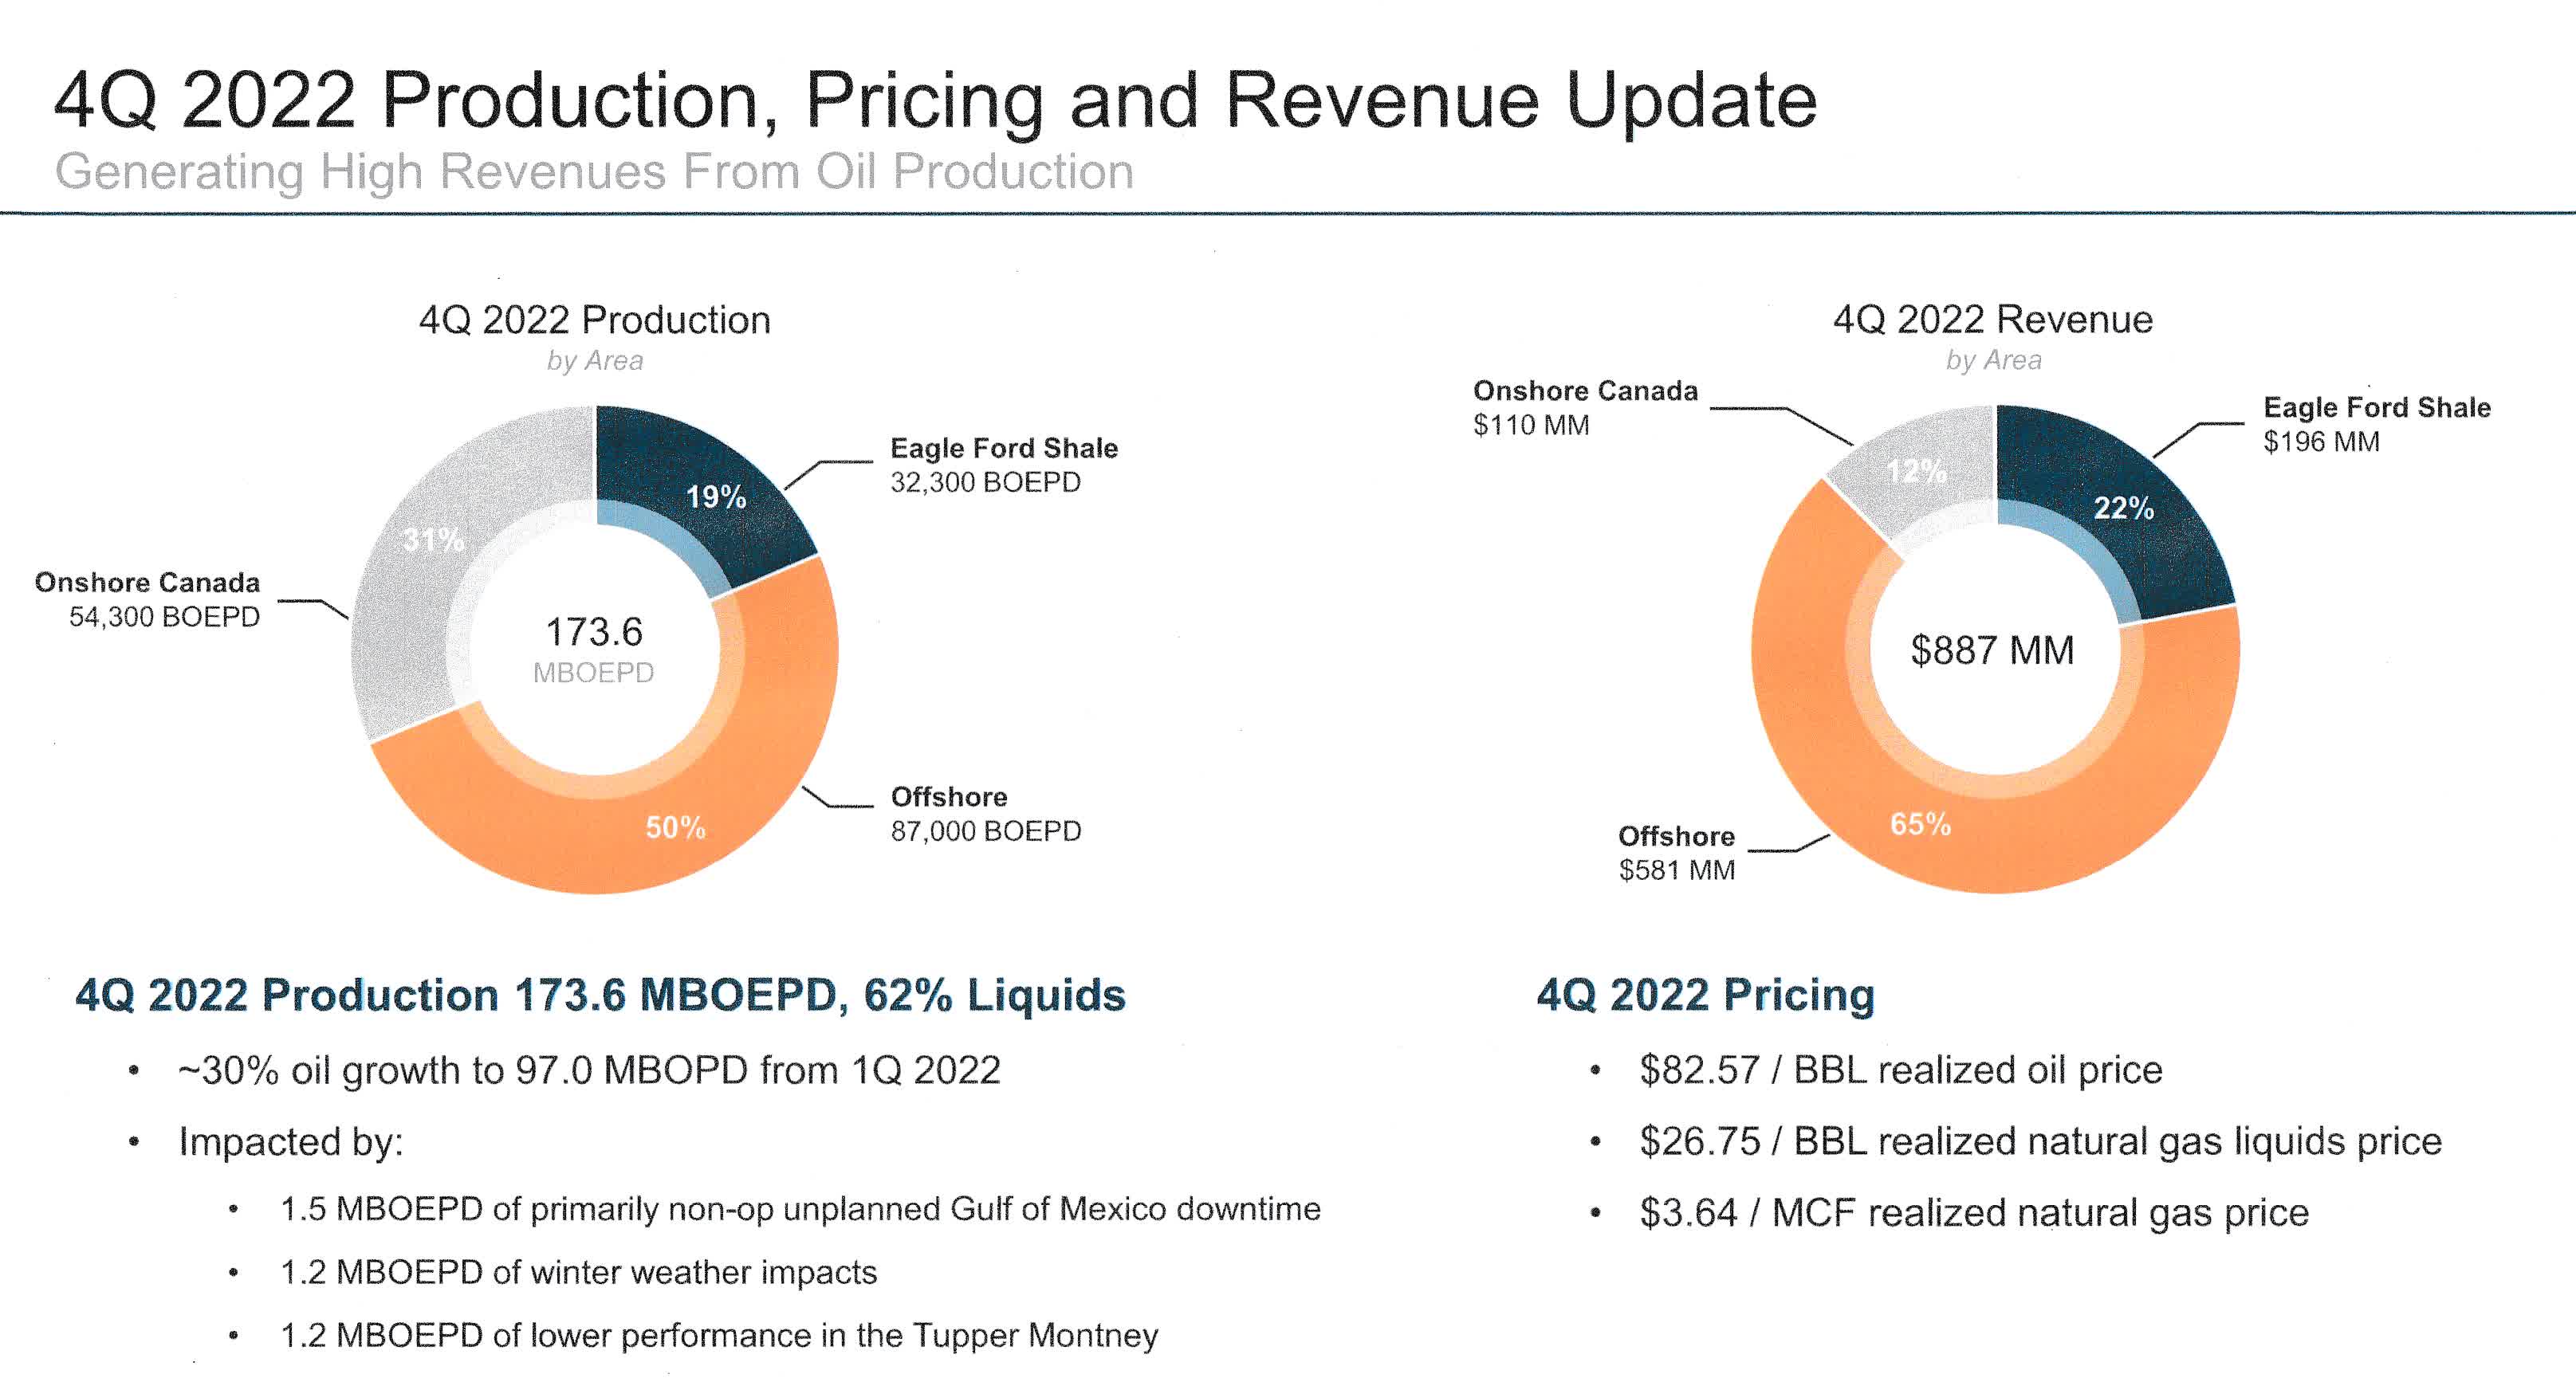
Murphy Oil’s total costs and expenses were $651.081 million, up from $428.923 million in the prior-year quarter. MUR’s fourth quarter production was near the lower-end of expected production volumes in 173.5-181.5K Boep/d.
Murphy Oil declared a quarterly dividend of $0.275 per share in the fourth quarter of 2022, an increase of 10%.
2 – Stock Performance And Commentary
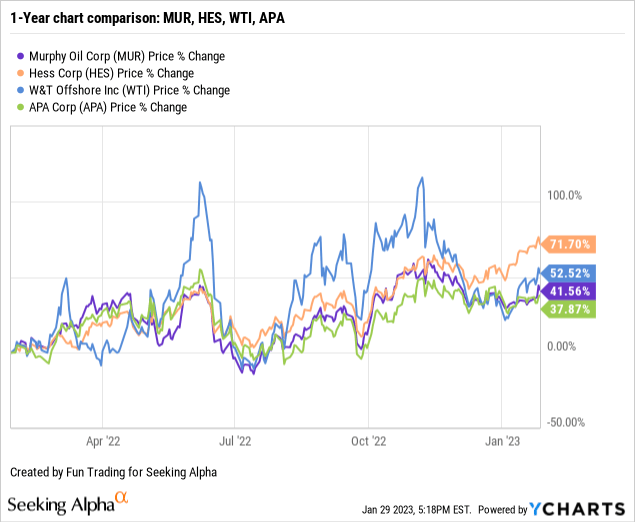
MUR is now up 42% on a one-year basis. The stock is following the general trend in this sector, rebounding from a period of consolidation.
CEO Roger Jenkins said in the conference call:
Murphy continues to deliver a strong value proposition, our ongoing execution excepts, especially in our oil-weighted assets, ensures that we remain a long-term sustainable company. We operate safely with a focus on continual improvement in our carbon emissions intensity. Our offshore competitive advantage is reinforced with our significant recent project success at our Khaleesi, Mormont, Samurai fields in the Gulf of Mexico.
What I like the most about this small E&P is the producing assets in the Gulf of Mexico and their growth potential. MUR is a US/Canada E&P producer with a very low risk attached, paying a dividend yield of about 2.5%.
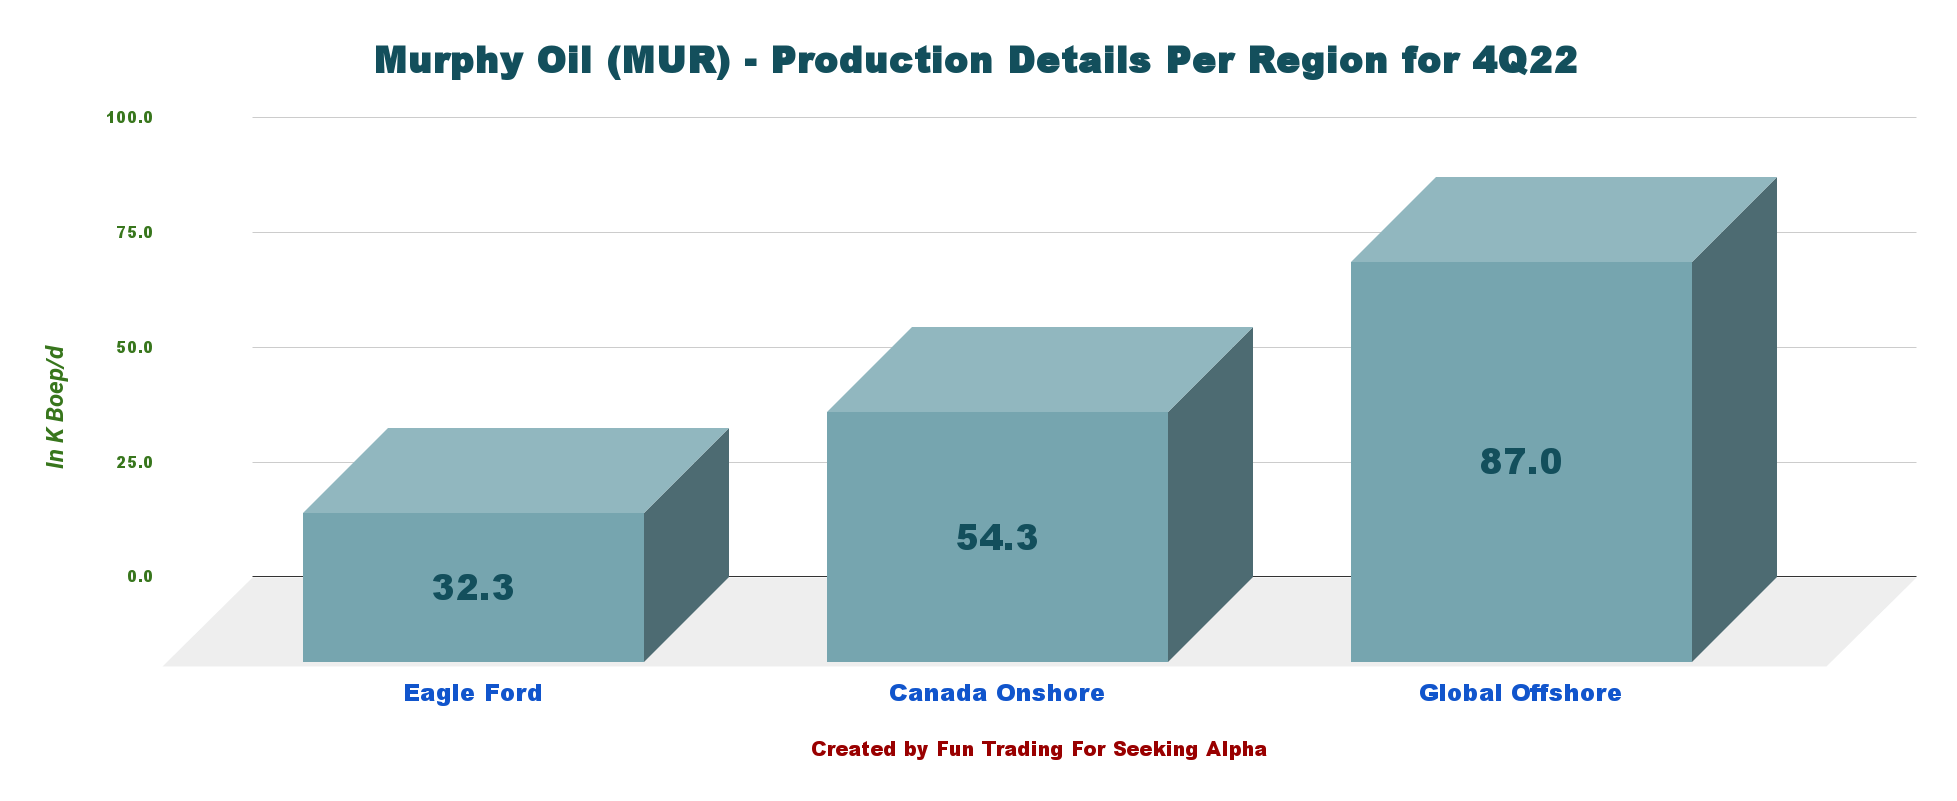
Murphy Oil achieved 84K Boep/d in the Gulf of Mexico with 81% oil.
MUR Gulf of Mexico Assets (MUR Presentation)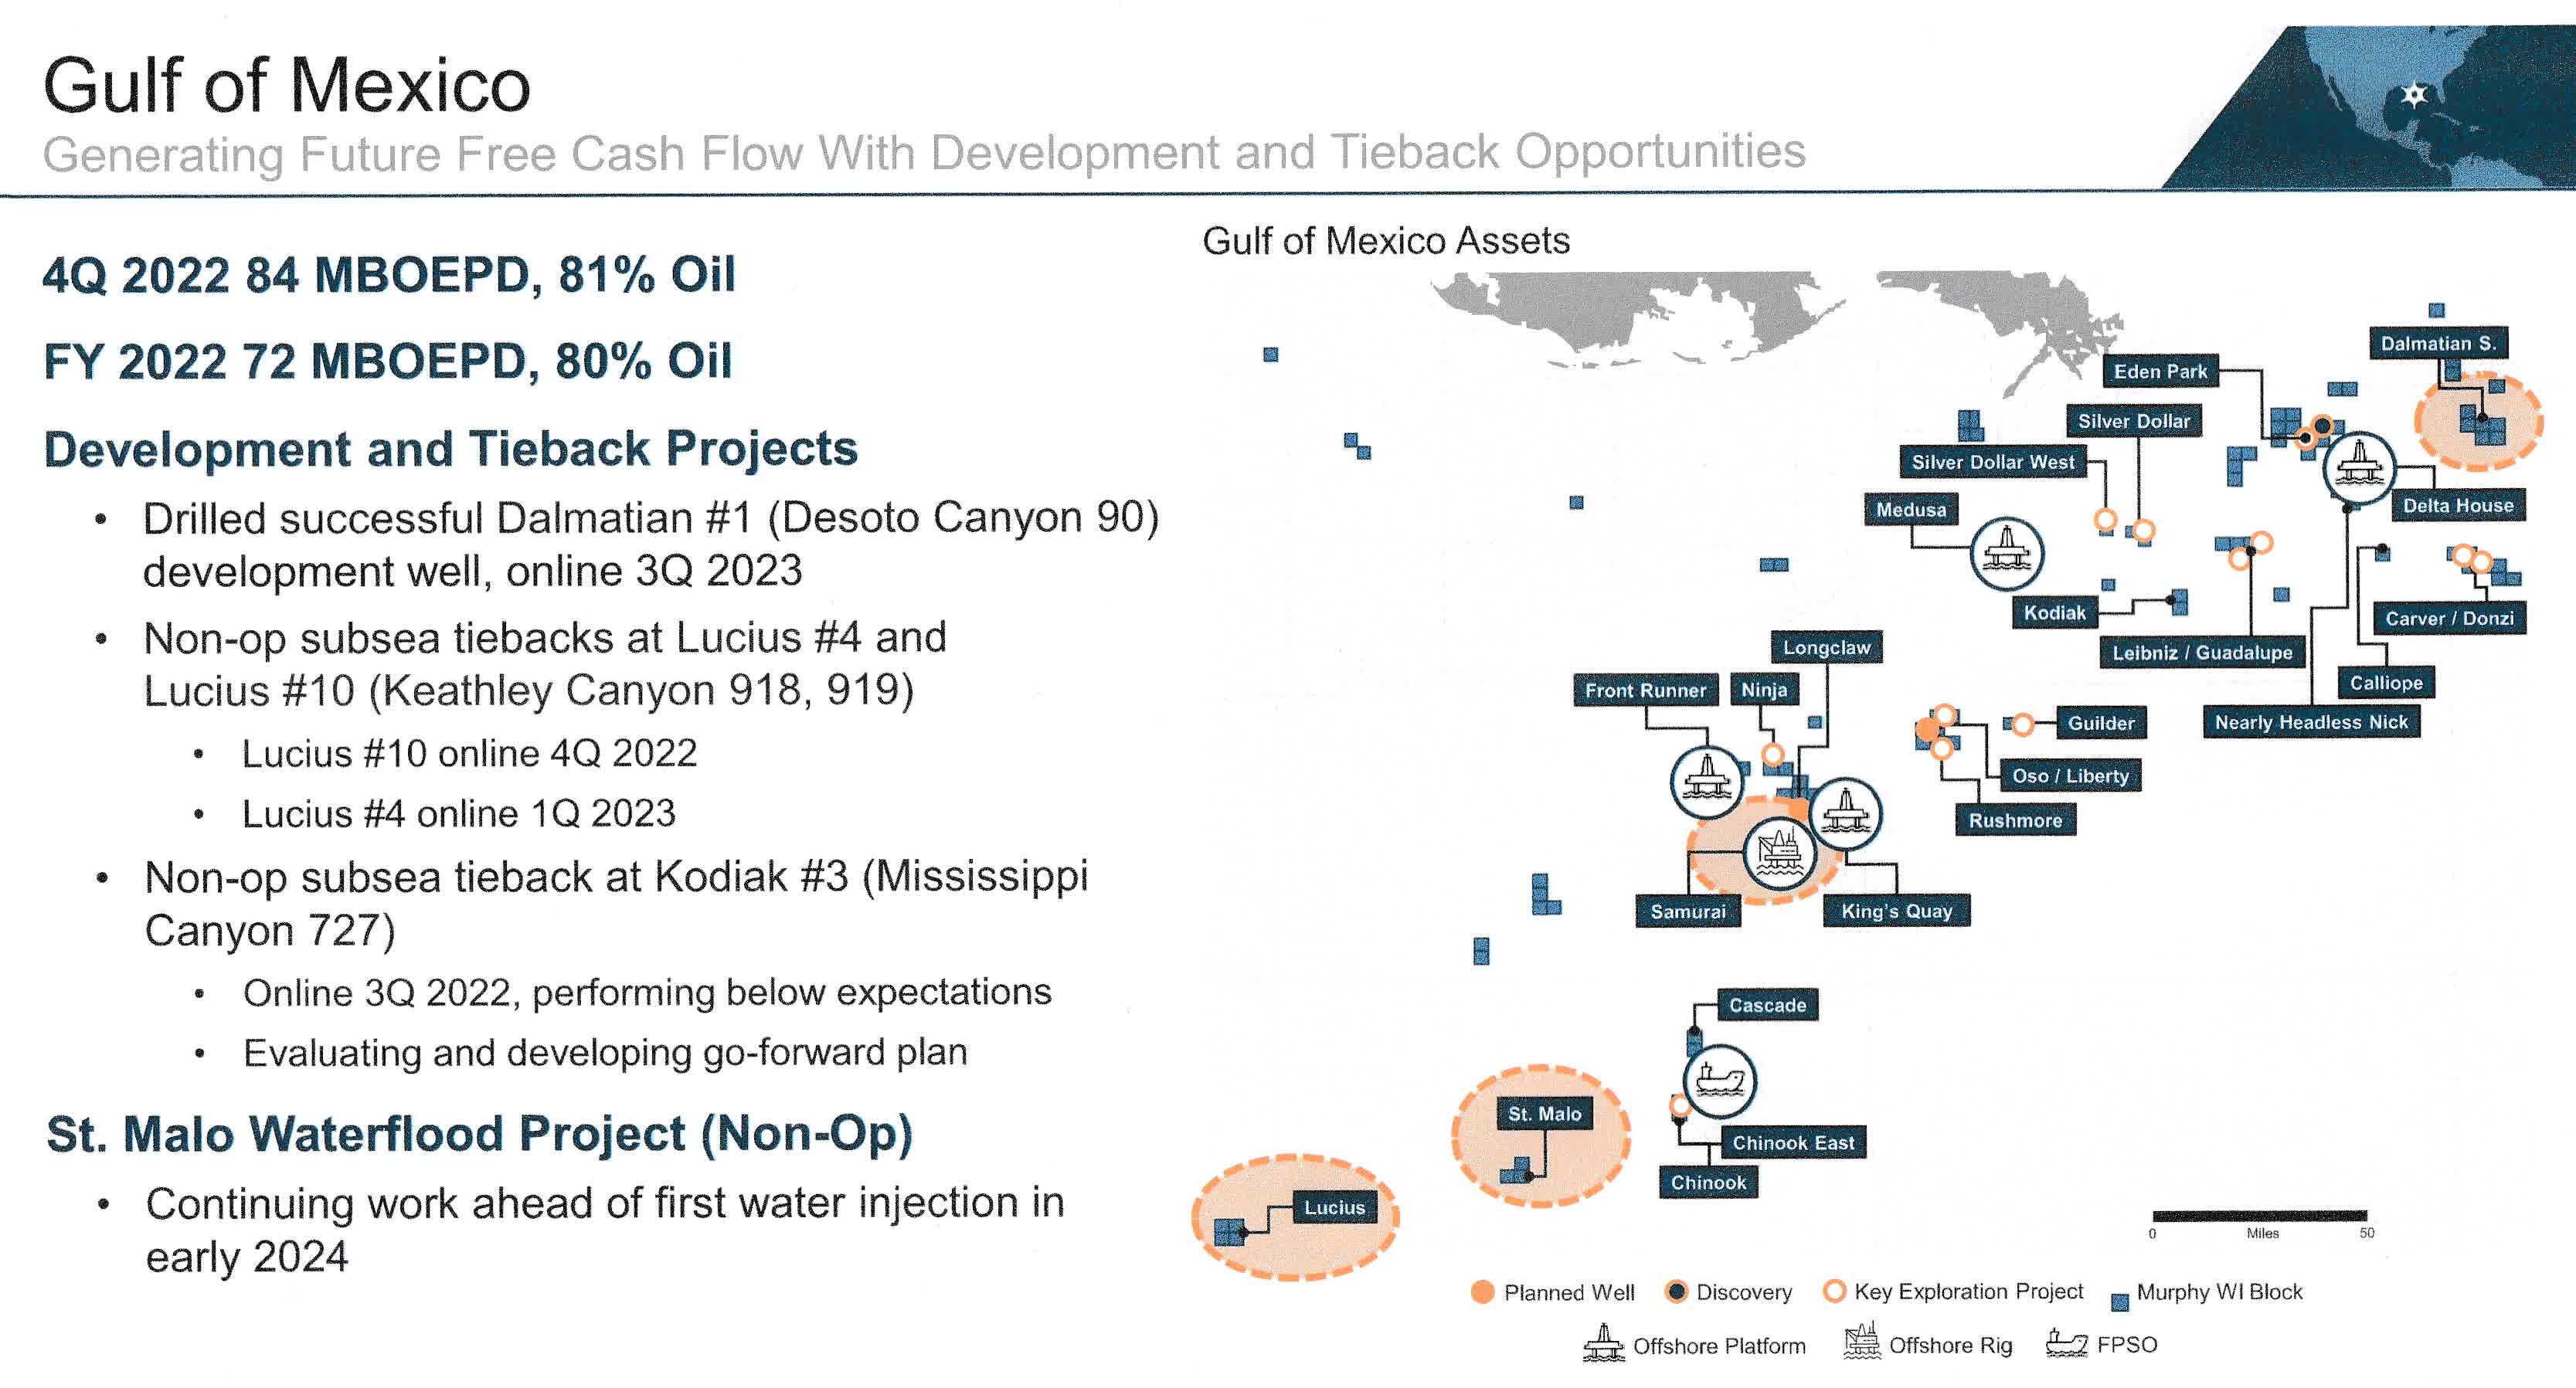
During the fourth quarter, Murphy Oil completed the Khaleesi, Mormont, and Samurai field development projects with seven wells brought online.
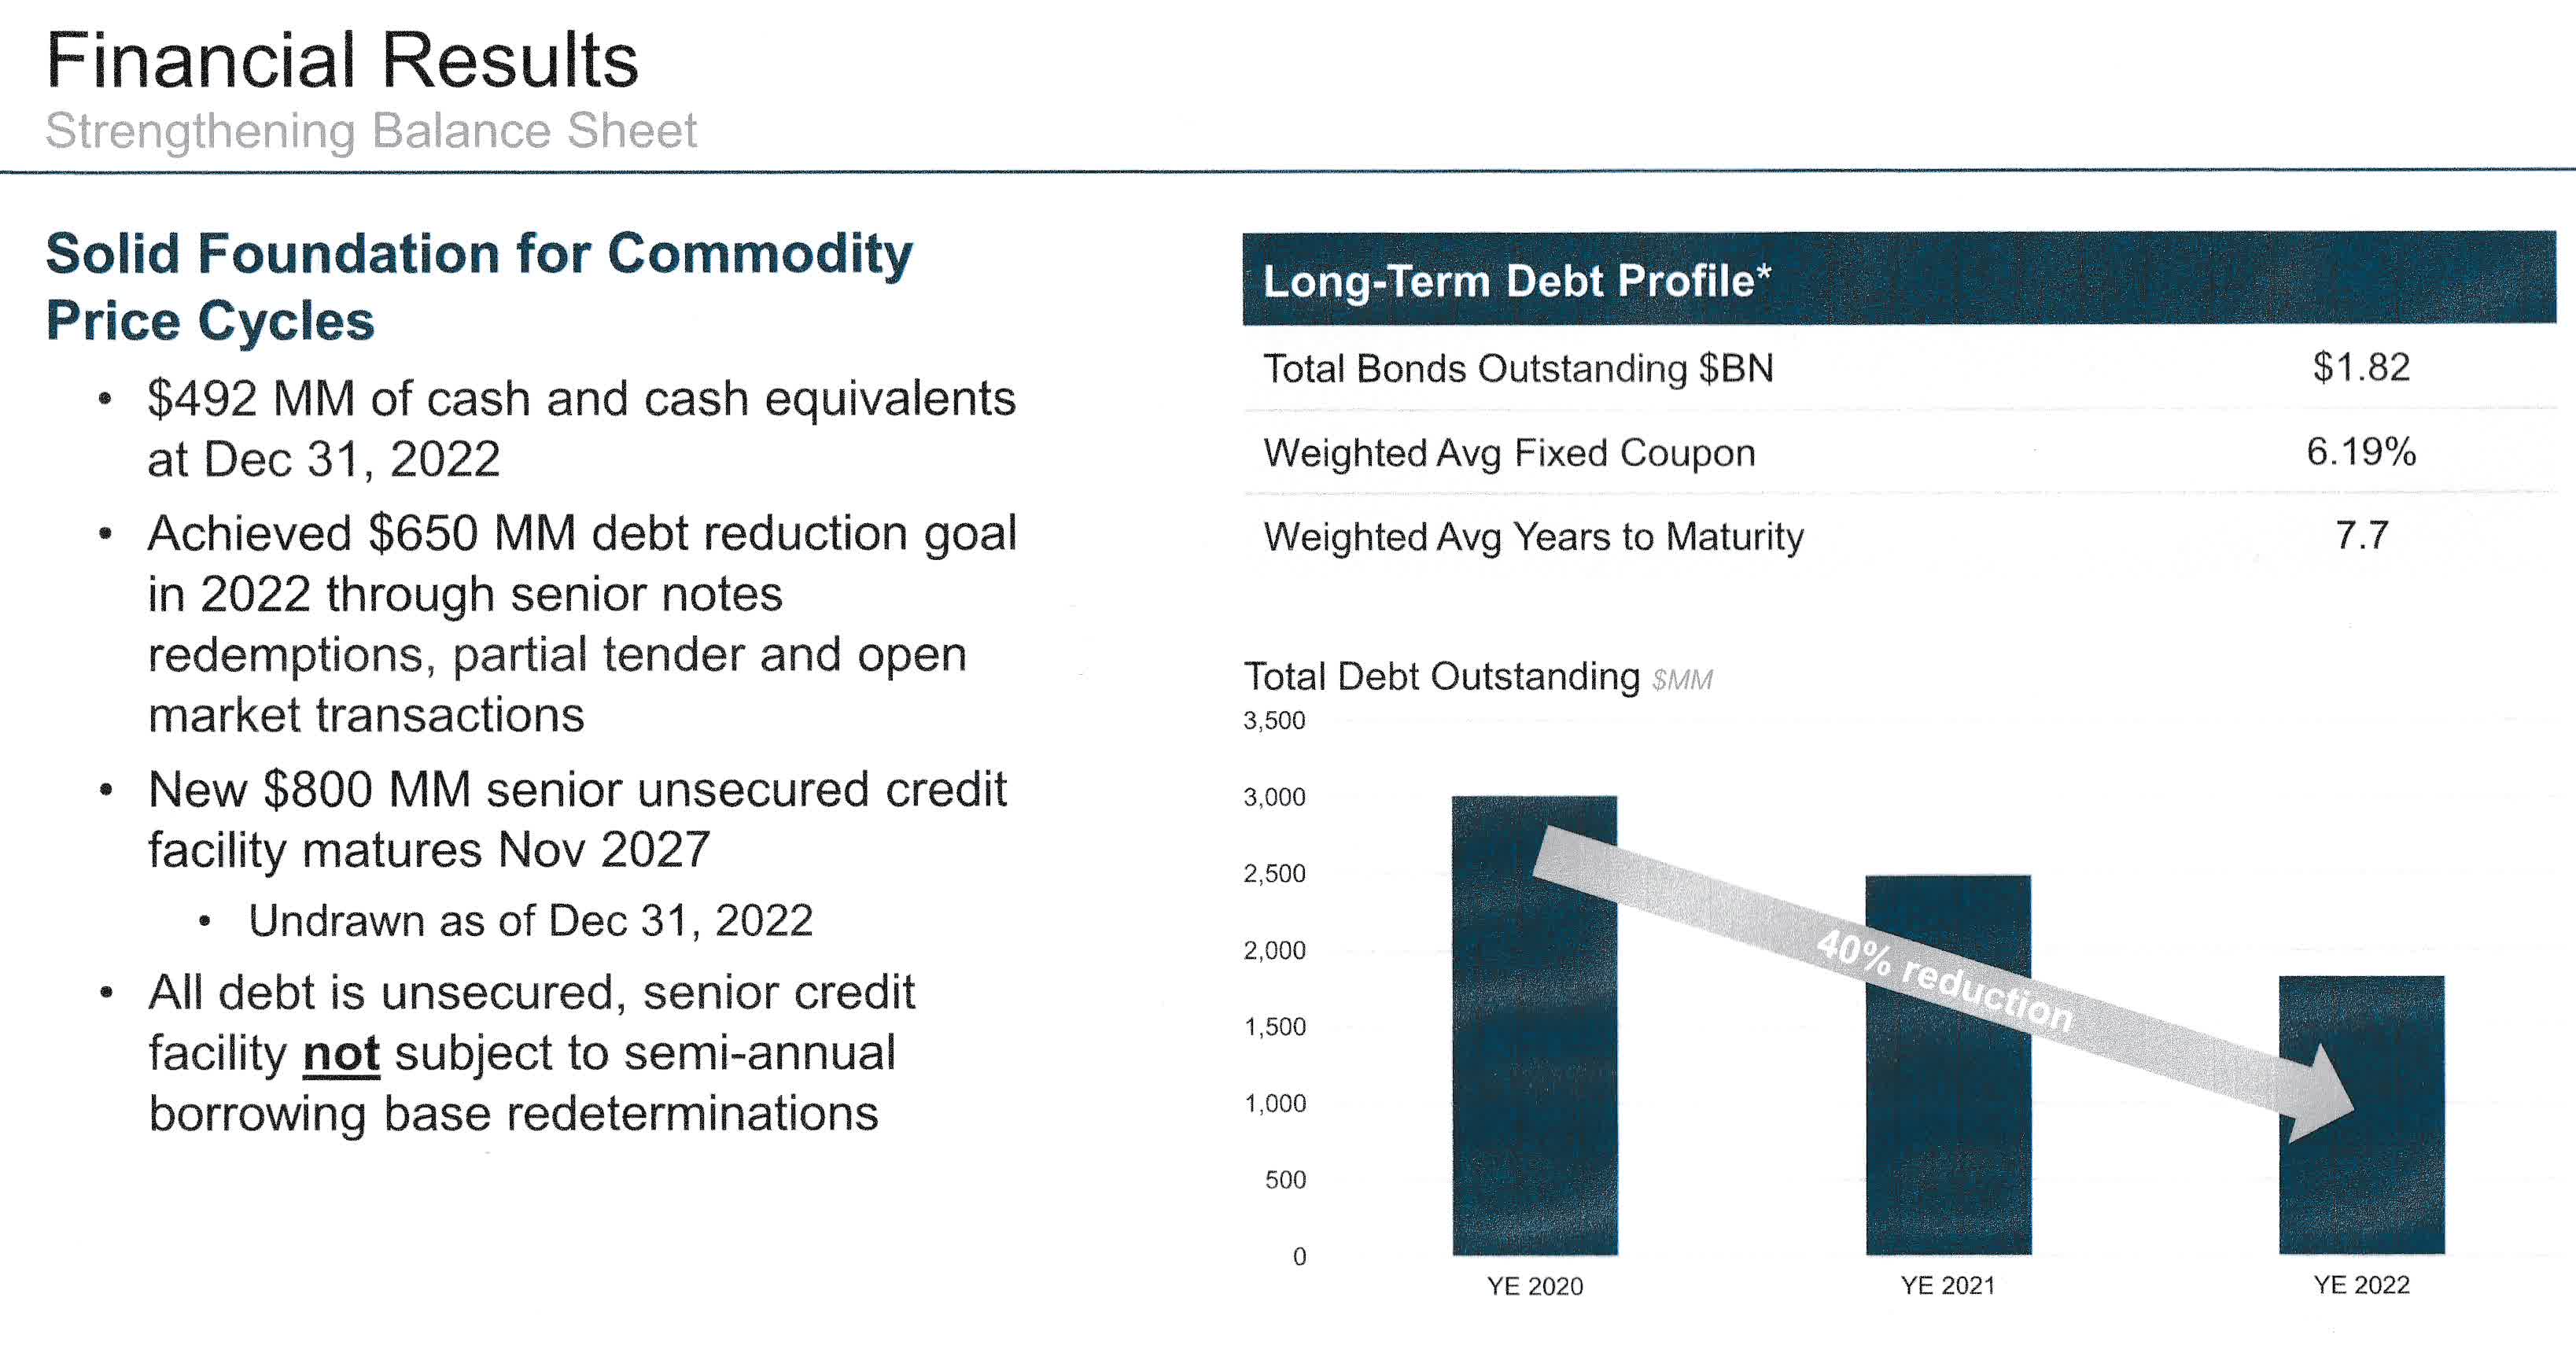
Finally, with high oil prices, the company was able to reduce its debt significantly in 2022.
Thus, MUR should be considered a good stock for the long term. However, because of the inherent volatility of the oil and gas sector, I recommend trading short-term LIFO (about 40%) and keeping a medium-core long-term position for a much higher target.
Trading LIFO is the most adapted strategy that allows you to profit while waiting for a significant uptrend. It is perfectly adapted to companies like MUR that have a solid balance sheet and pay a good dividend.
Murphy Oil – Financial History Including 4Q22 – The Raw Numbers
| Murphy Oil | 4Q21 | 1Q22 | 2Q22 | 3Q22 | 4Q22 |
| Total oil and gas revenues in $ Million | 762.3 | 871.37 | 1,196.24 | 1,120.91 | 986.12 |
| Total revenues and others in $ Million | 739.0 | 552.96 | 1,101.06 | 1,303.43 | 975.22 |
| Net income in $ Million | 168.4 | -113.34 | 350.56 | 528.43 | 199.30 |
| EBITDA $ Million | 489.76 | 119.51 | 752.77 | 985.91 | 519.65* |
| EPS diluted in $/share | 1.08 | -0.73 | 2.23 | 3.36 | 1.26 |
| Operating cash flow in $ Million | 330.9 | 338.33 | 620.91 | 704.99 | 501.5* |
| CapEx in $ Million | 106.2 | 244.91 | 354.41 | 329.28 | 184.6* |
| Free cash flow in $ Million | 224.63 | 93.42 | 266.50 | 392.33 | 316.9* |
| Total cash $ Billion | 0.52 | 0.48 | 0.43 | 0.47 | 0.49 |
| Long-term debt (including current) in $ Billion | 2.47 | 2.47 | 2.27 | 2.02 | 1.82 |
| Dividend per share in $ | 0.15 | 0.175 | 0.25 | 0.25 | 0.275 |
| Shares outstanding (diluted) in Million | 154.45 | 154.92 | 157.46 | 157.34 | 157.68 |
| Oil Production | 4Q21 | 1Q22 | 2Q22 | 3Q22 | 4Q22 |
| Oil Equivalent Production in K Boe/d (Net) | 150.2 | 141.0 | 164.4 | 188.5 | 173.59 |
| US Onshore Crude oil price ($/b) | 76.28 | 93.87 | 109.25 | 93.65 | 83.06 |
Source: Murphy Oil press release
* Estimated by Fun Trading. The 10-Q filing has not been published, and I used only data from the company release and presentation.
Analysis: Revenues, Earnings Details, Free Cash Flow, Debt, And Oil & Gas Production
1 – Total Revenue and Others (Hedging) was $975.219 Million In 4Q22
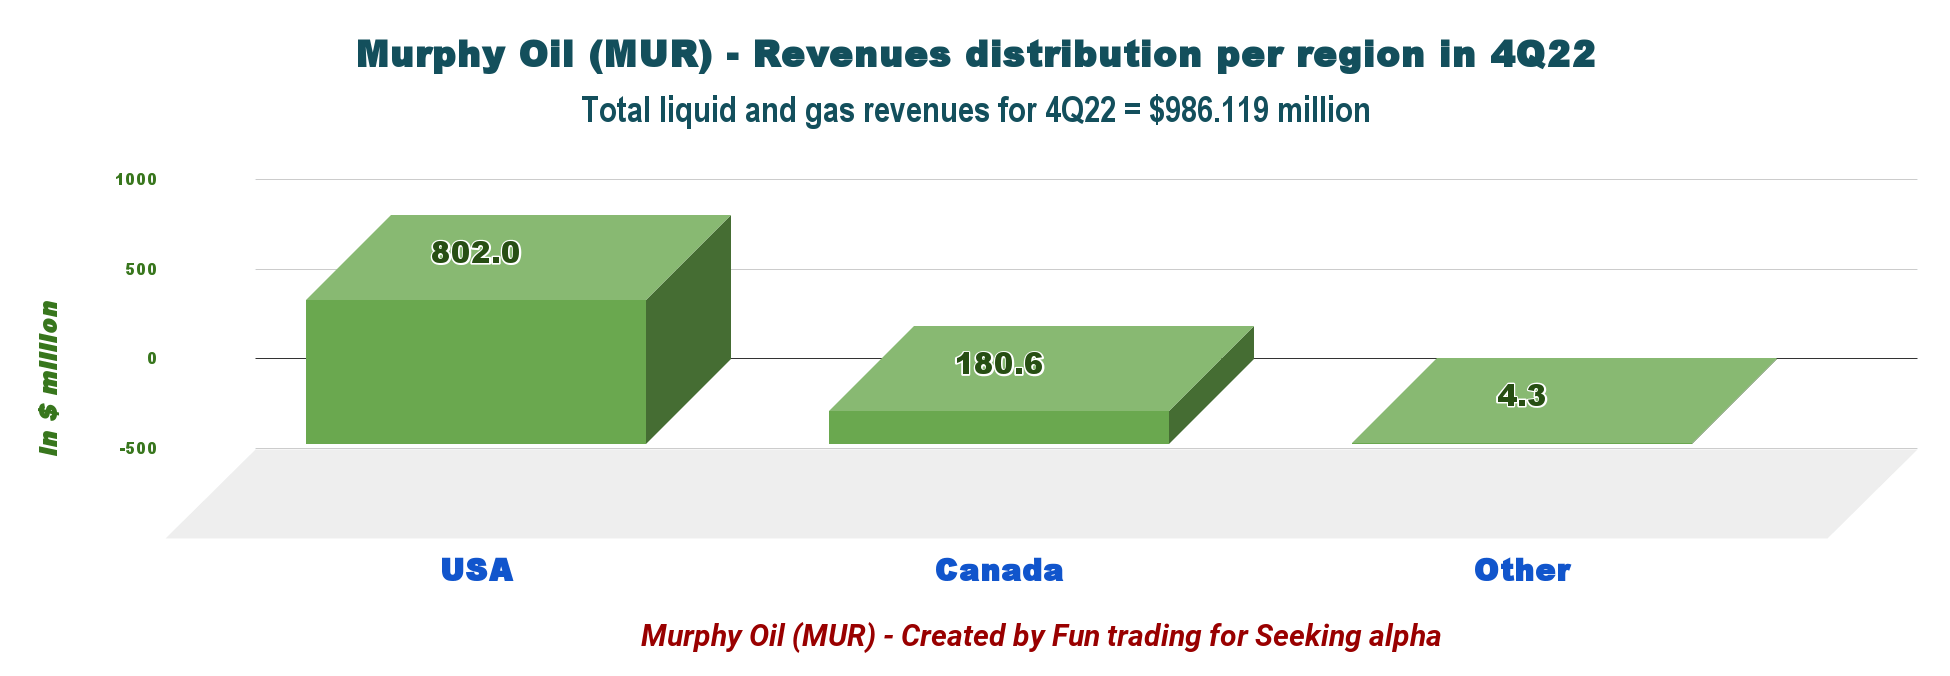
MUR Quarterly Revenue History (Fun Trading) Note: Revenues from oil and gas were $986.119 million. MUR Quarterly Revenue Per Region (Fun Trading)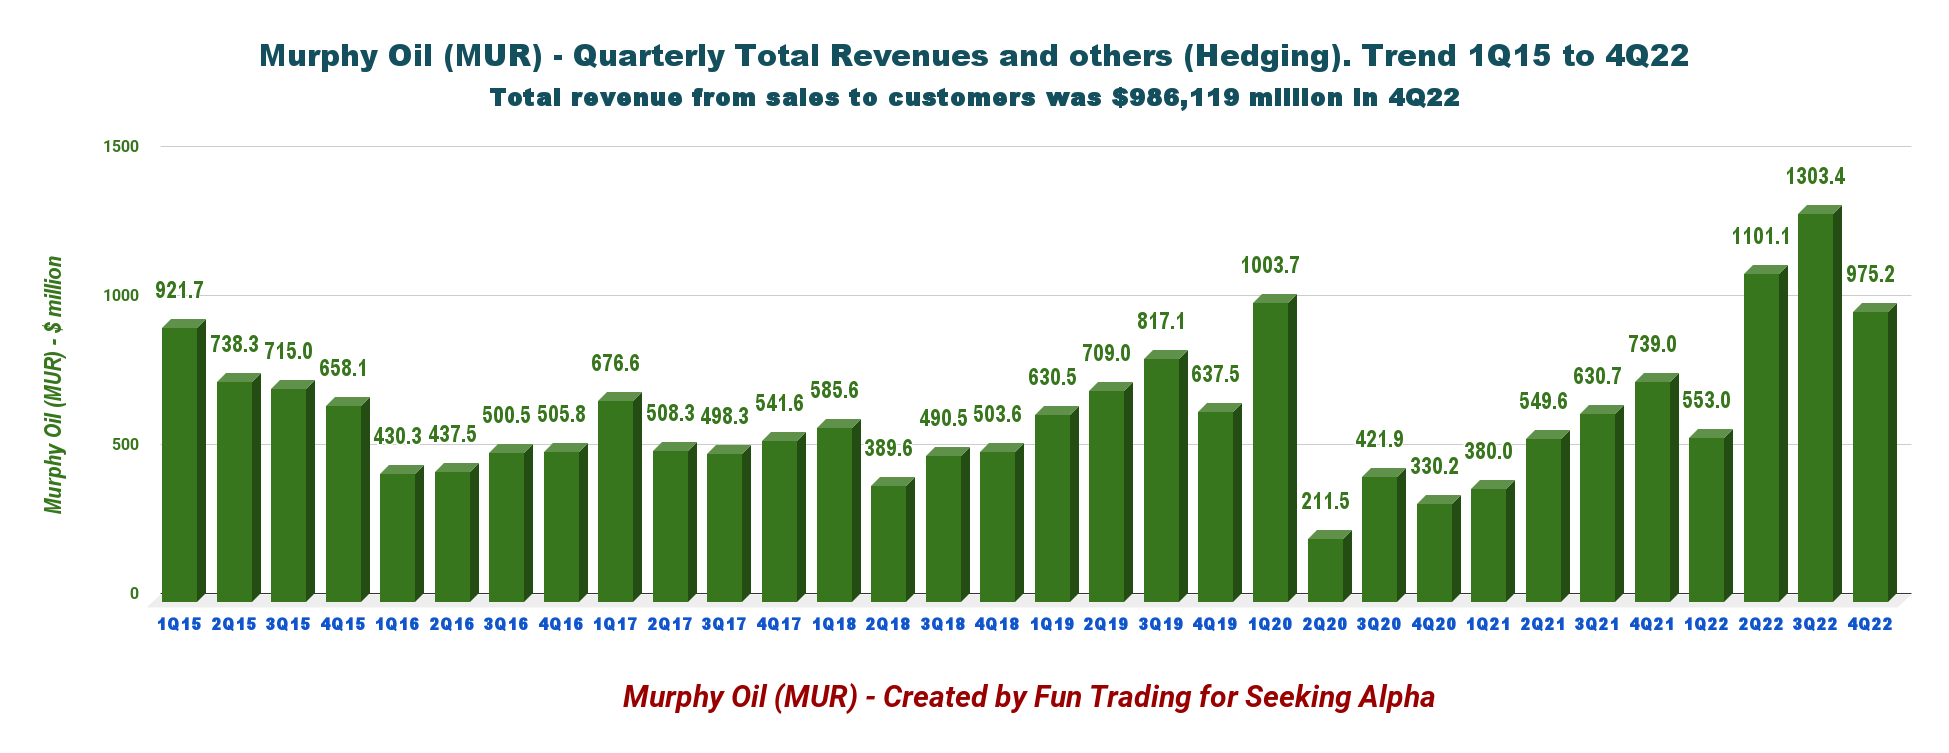
Murphy Oil reported a net income of $199.398 million, or $1.26 per diluted share, for the fourth quarter of 2022. This compares to $168.40 million or $1.08 per share a year ago.
The net cash provided by continuing operations activities in 4Q22 was $501.518 million, compared with $330.88 million in 4Q21.
2 – Free Cash Flow was $316.9 Million in 4Q22
MUR Quarterly Free Cash Flow History (Fun Trading) Note: The generic free cash flow is cash from operating activities minus CapEx. The company has a different calculation, including divestiture.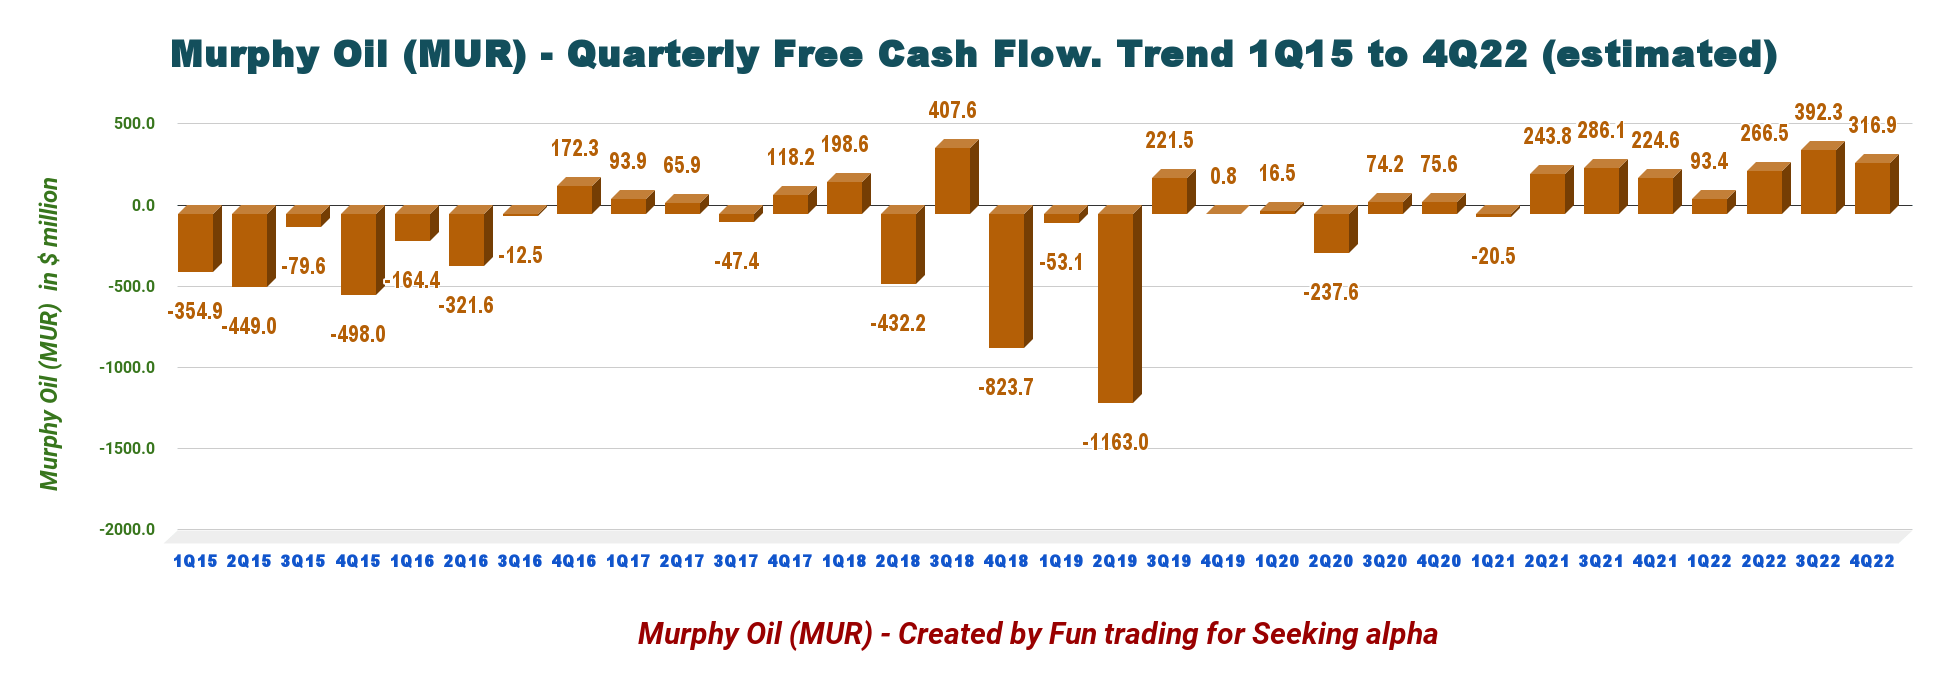
The generic free cash flow was $316.9 million in 4Q22. The trailing 12-month free cash flow is $1,052.52 million.
The company now pays a quarterly dividend of $0.275 per share. The dividend yield is currently 2.5%, which is still considered small in this industry if we compare it to the oil majors.
MUR Oil Majors Dividend (Fun Trading)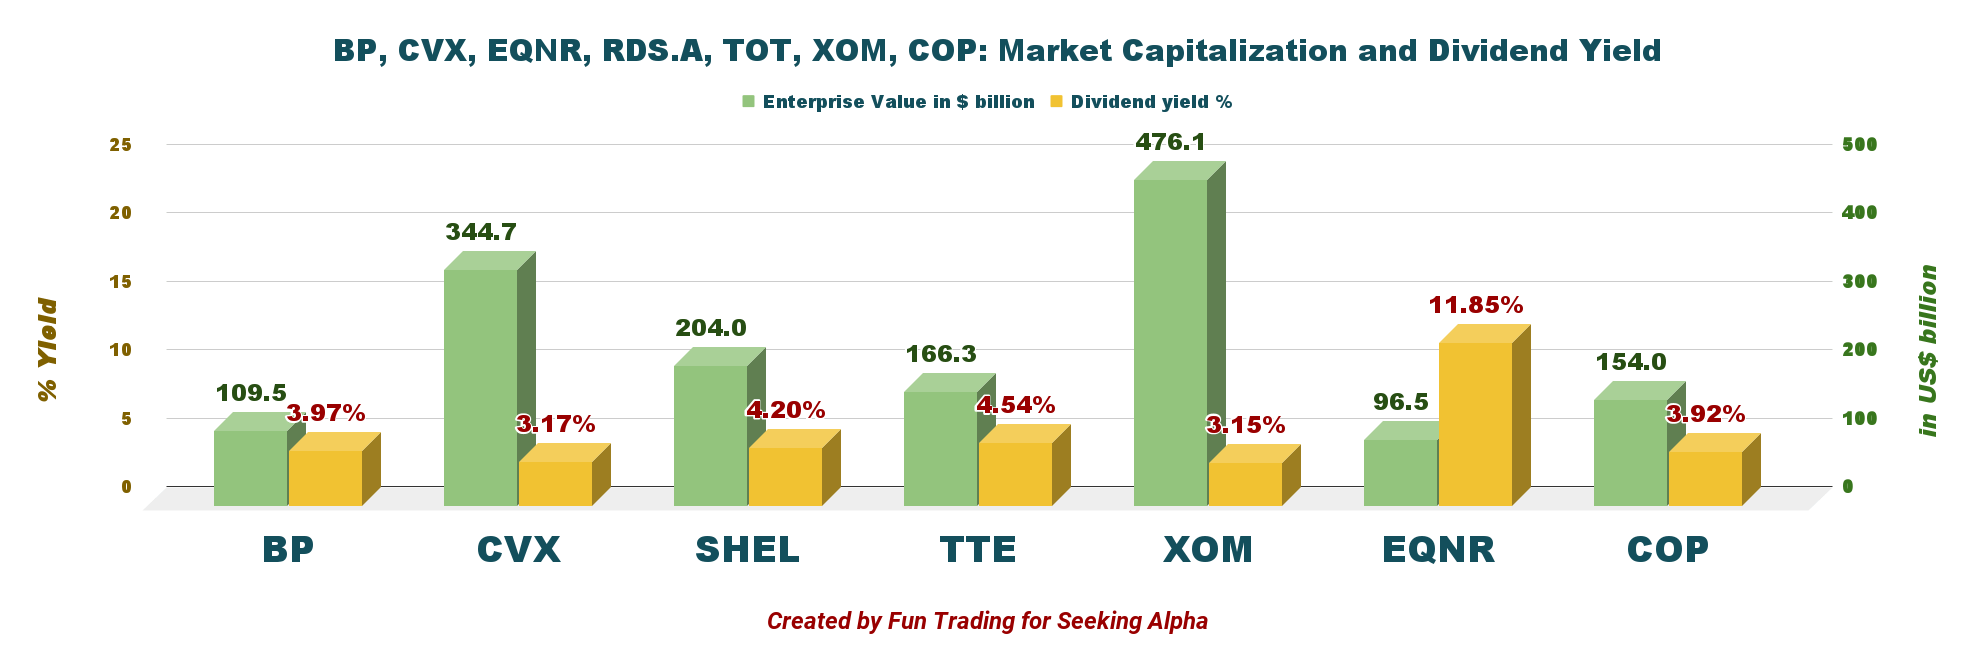
3 – Production was a Total of 173.59k Boep/d in 4Q22 (Net)
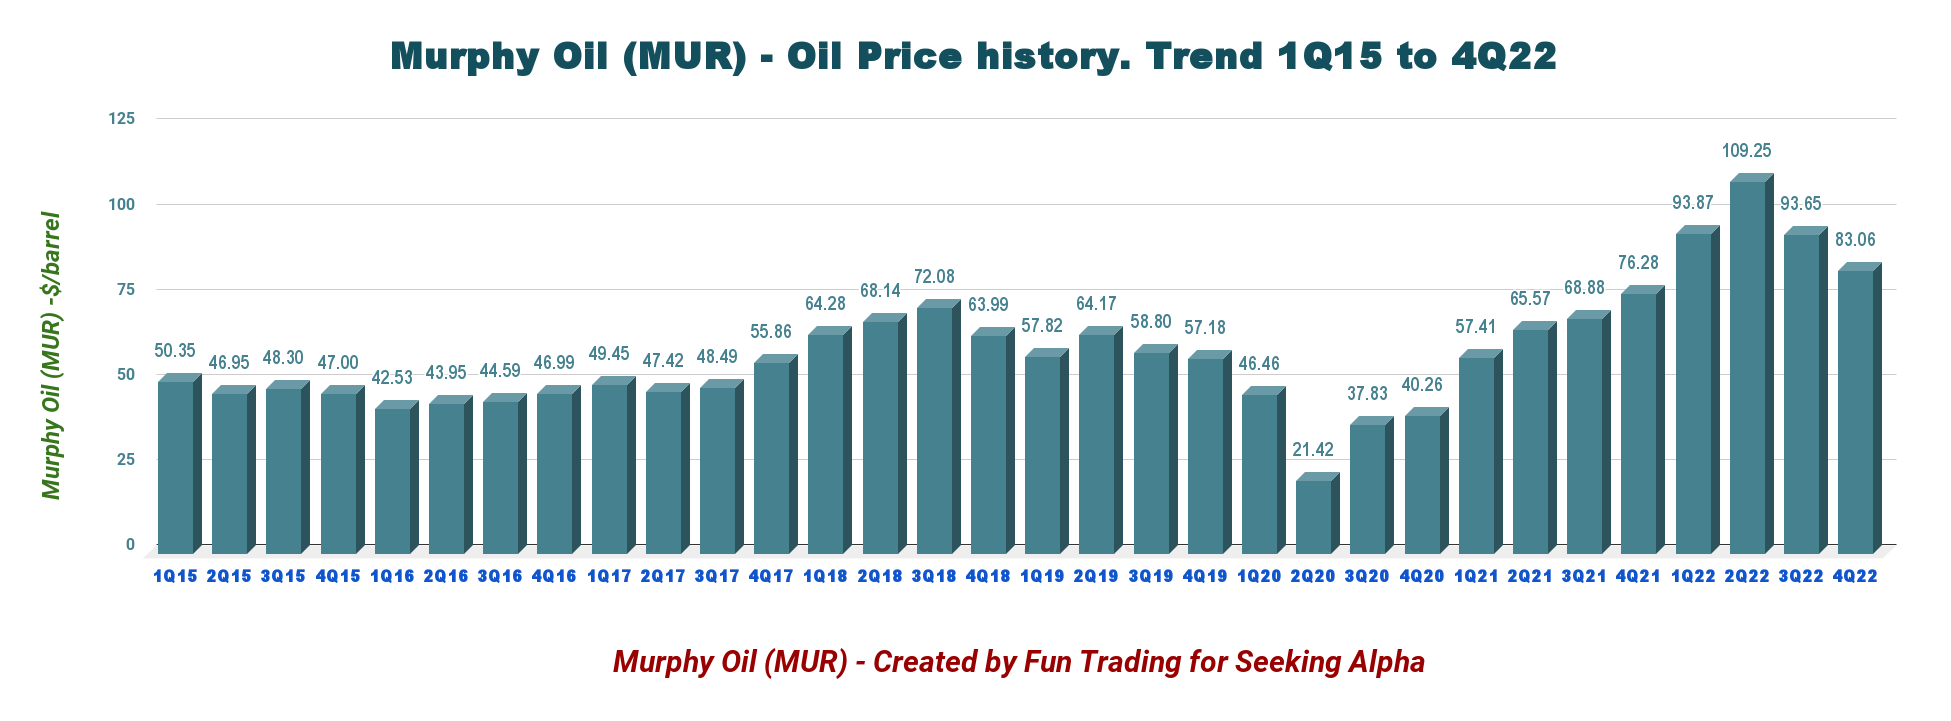
MUR Quarterly Production history (Fun Trading) The company produced 173.59K Boep/d in the fourth quarter, comprising 62% of liquids. The offshore section, mainly the Gulf of Mexico, represents 50.1% of the total output in 4Q22. MUR Production Per Region (Fun Trading) Onshore US oil prices were $83.06 a barrel in 4Q22, up significantly from $76.28 realized last year. MUR Quarterly Oil Price History (Fun Trading) Below is shown how the equivalent production is spread between oil, NGL, and natural gas. Liquids represented 63% of the total output. MUR Production in Oil, NGL, NG in 4Q22 (Fun Trading)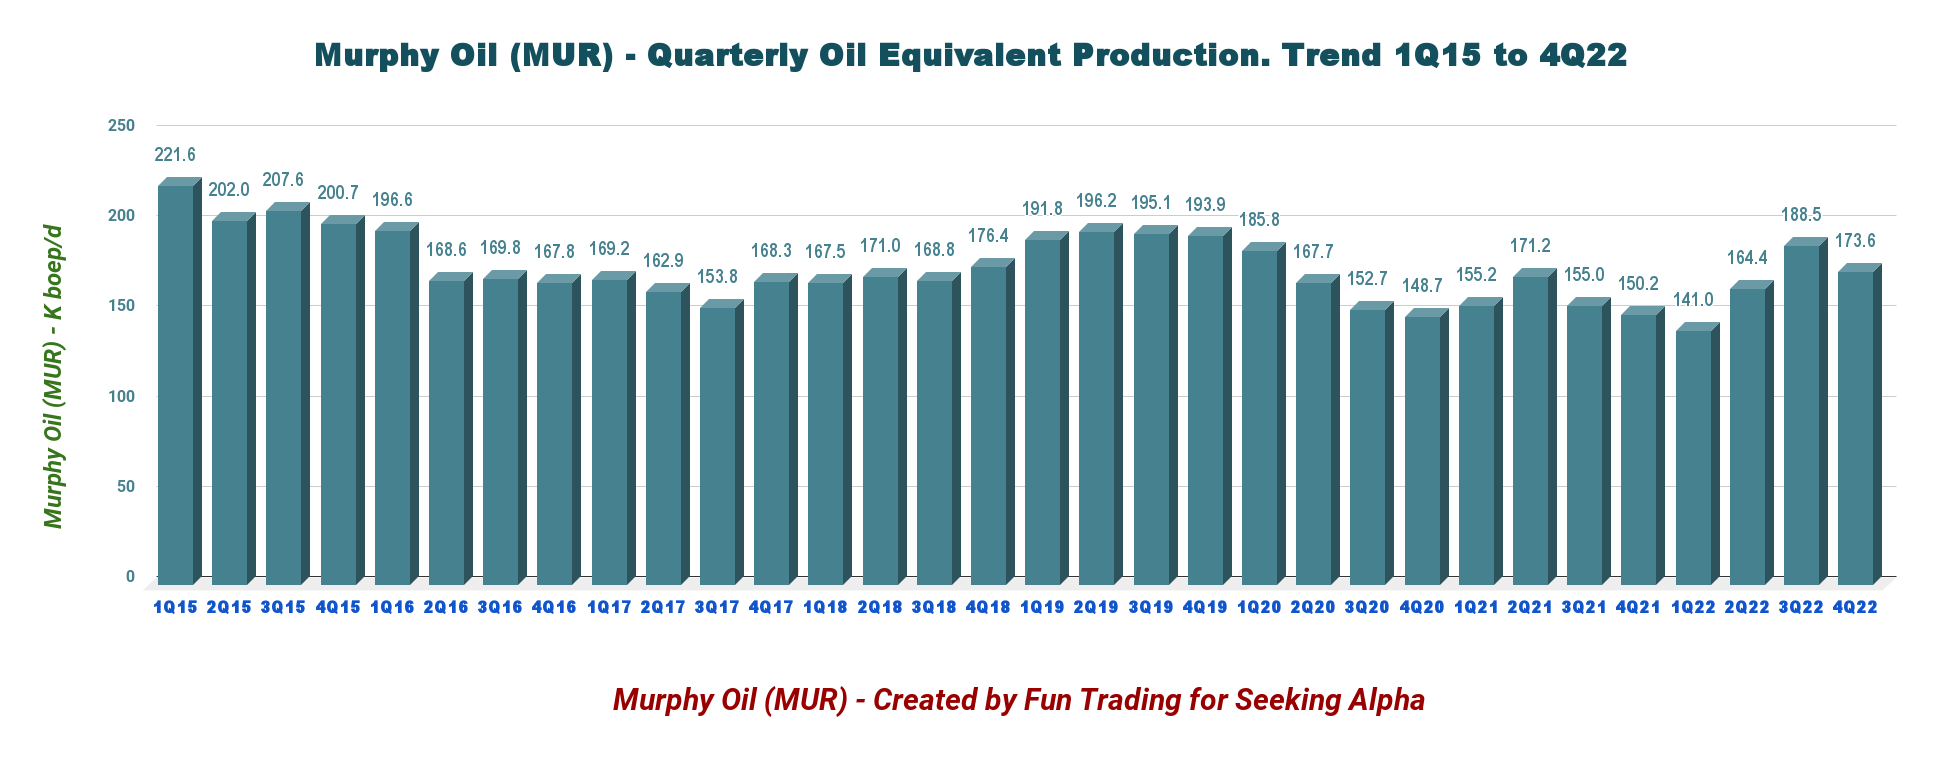
4 – Net Debt Going Down Again
Murphy Oil had cash and cash equivalents of $491.962 million as of December 31, 2022, compared with $521.18 million as of December 31, 2021.
MUR Quarterly Cash Versus Debt History (Fun Trading) Net debt was $1.33 billion at the end of December 2022. The Debt is an unsecured senior credit facility, not subject to semi-annual borrowing base redetermination. MUR Balance Sheet (MUR Presentation)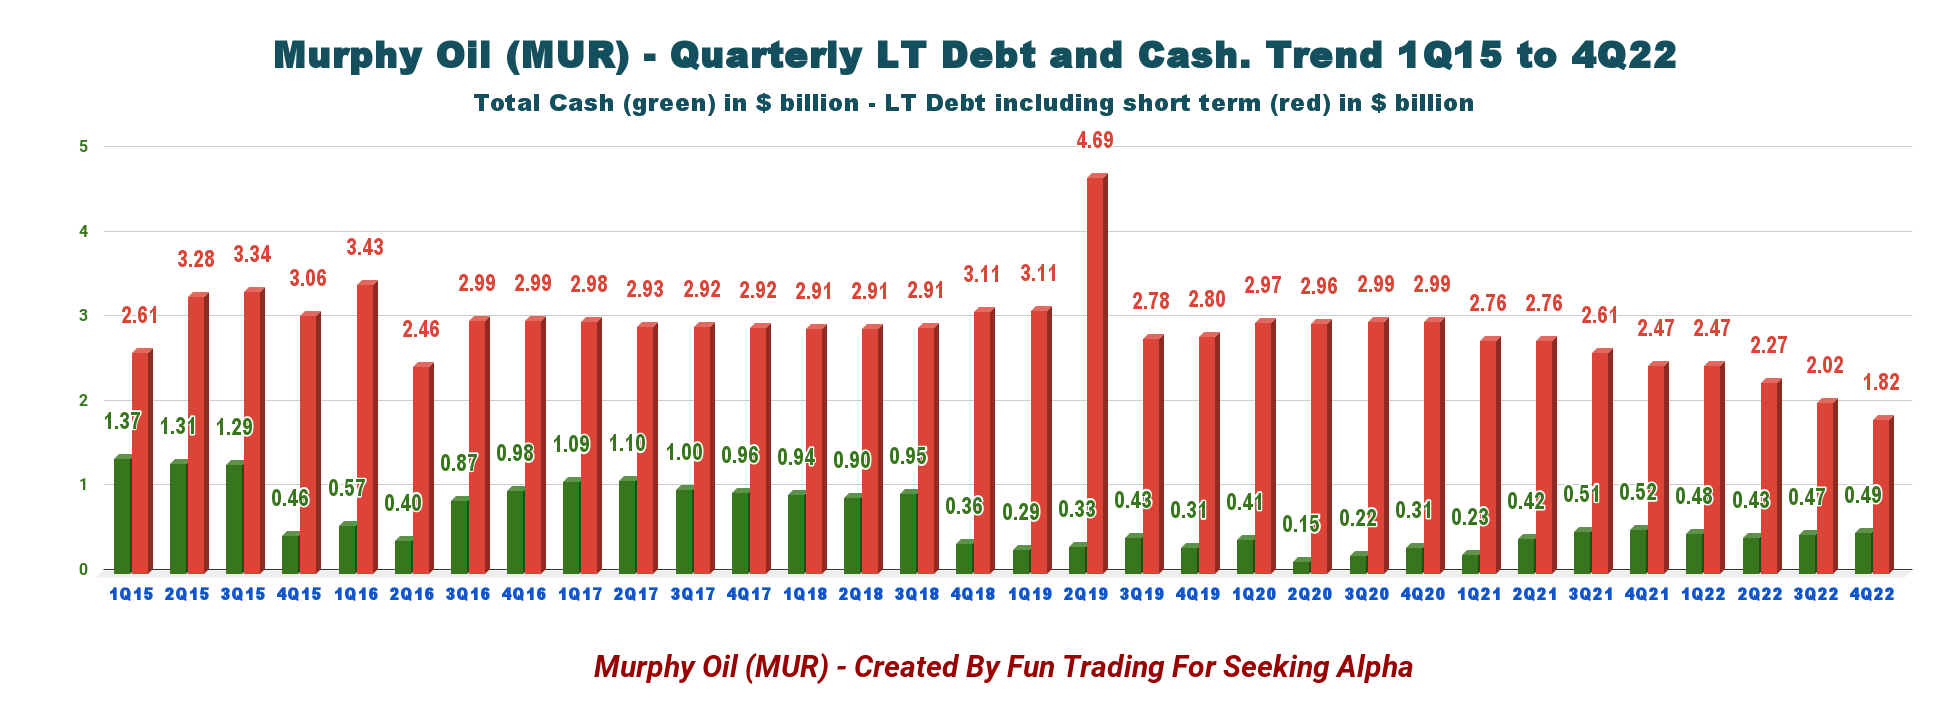
5 – 1Q23 Guidance
MUR expects its production to be 161k-169k Boep/d in 1Q23, significantly lower than indicated in the preceding quarter.
Full-year CapEx is between $875-$1,025 million.
MUR expects 2023 production volumes of 175.5k-183.5K Boe/d. Murphy Oil targets further debt reduction of $500 million in 2023.
MUR 1Q23 Guidance (MUR Presentation)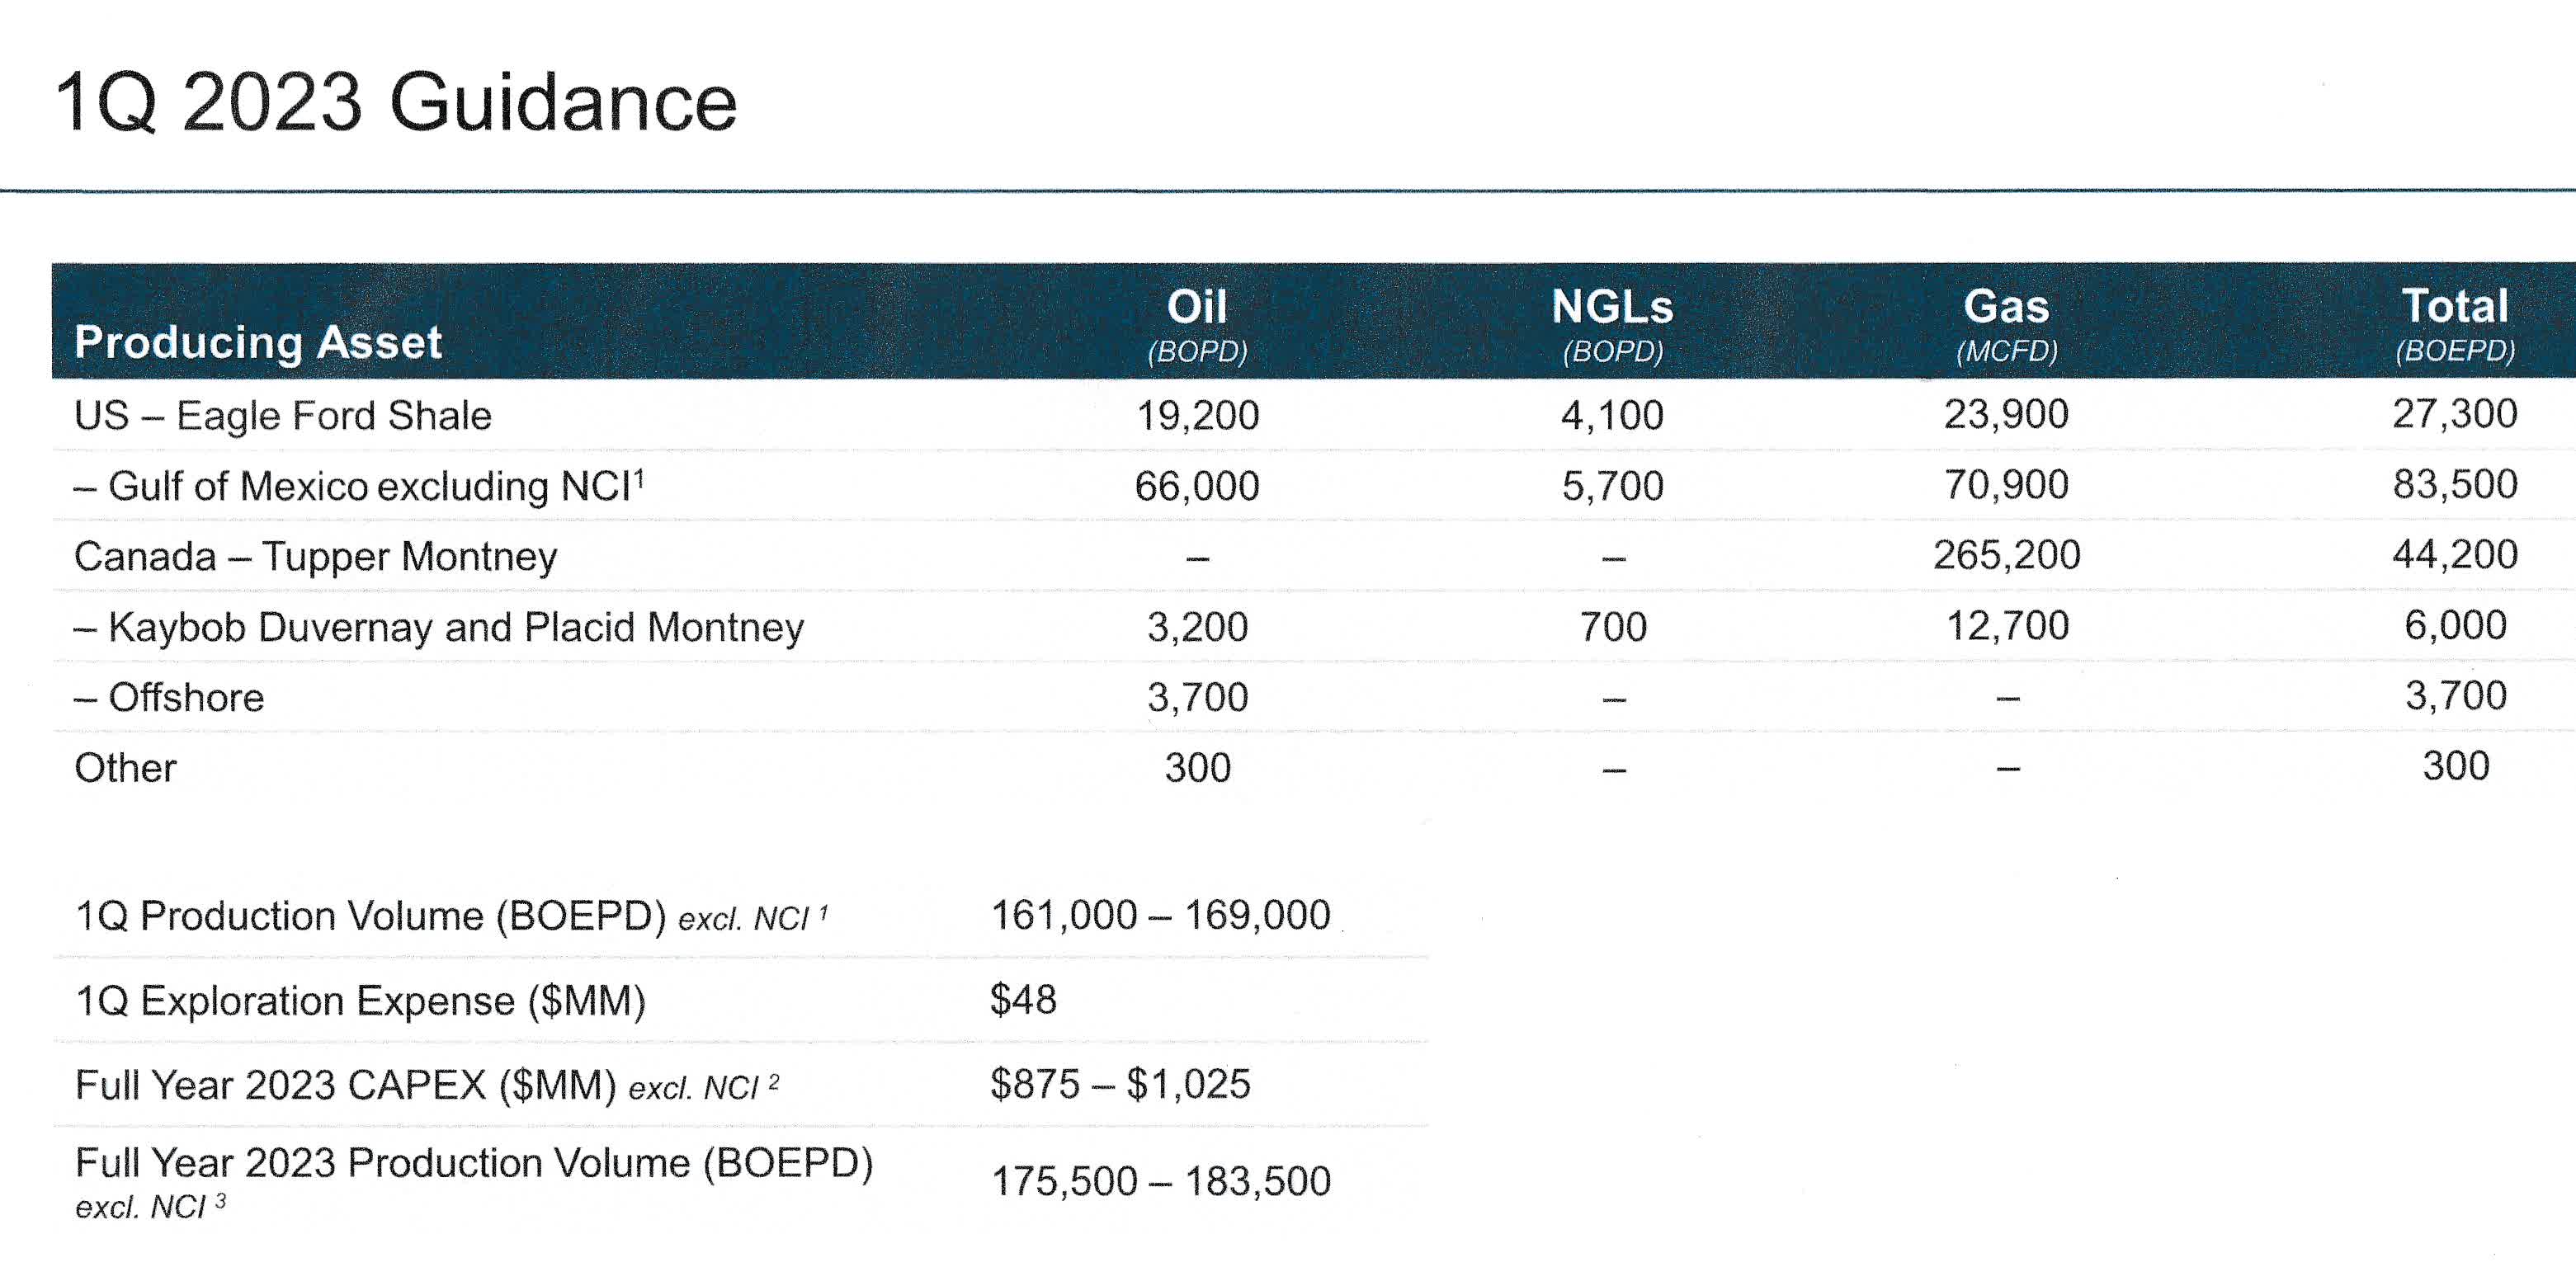
Technical Analysis (Short Term) And Commentary
MUR TA Chart Short-term (Fun Trading StockCharts)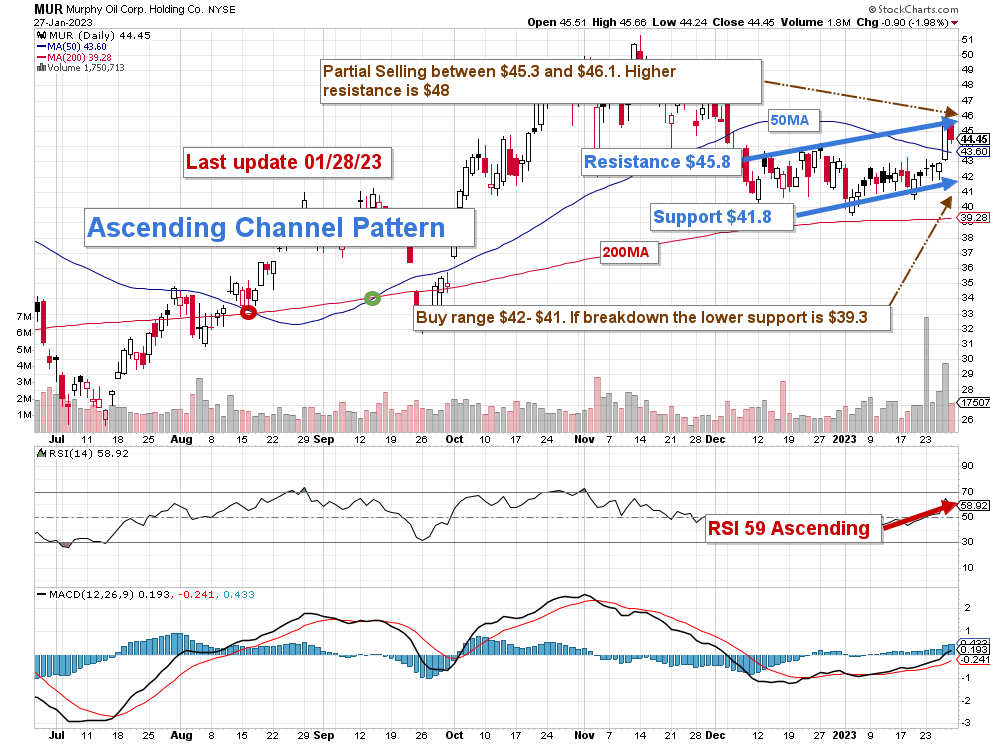
Note: The chart is adjusted for the dividend.
MUR forms an ascending channel pattern with resistance at $45.8 and support at $41.8. Ascending channel patterns are short-term bullish, but these patterns often form within longer-term downtrends as continuation patterns.
As I said in my preceding article, we cannot ignore those early signs, and we must protect our MUR investment by adopting a strategy that takes the “best of both worlds.” It is what I promote in my marketplace, “The Gold and Oil corner.”
The Fed is expected to hike interest rates this week by 25 points and potentially hike again by 25 points in March before taking a pause.
That cooling has traders betting the Fed will soon wind down its most aggressive policy-tightening since the 1980s, designed to dampen demand across the economy in a bid to bring inflation, which surged to a 40-year high last year, back down to its 2% target rate.
Inflationary pressures are softening significantly, and the market is turning bullish, which is pushing oil prices higher. However, we may experience an overbought situation now, and the market has already factored in most of the news. It could directly sell off on any slightly disappointing related event.
The trading strategy is to sell LIFO about 50% of your position between $45.3 and $46.1, with possible higher resistance at $48 if oil prices continue their bullish rally. Conversely, I suggest accumulating between $41 and $42, with potential lower support at $39.3, if oil prices fall significantly.
Warning: The TA chart must be updated frequently to be relevant. It is what I am doing in my stock tracker. The chart above has a possible validity of about a week. Remember, the TA chart is a tool only to help you adopt the right strategy. It is not a way to foresee the future. No one and nothing can.
Be the first to comment