

Cold Stone Creamery is one of the main brands operated by the MTY Food Group RiverNorthPhotography/iStock Unreleased via Getty Images
Introduction
In 1968, a young teenager from Hong Kong emigrated to Canada. He earnt a living working in restaurants, cleaning dishes, waiting tables and servicing customers. 11 years later, in 1979, this young man shared his South East Asian roots with his new home country via Chinese-Polynesian cuisine. Fast forward more than 50 years later, and you’re looking at a USD$1bn market capitalization company called MTY Food Group (TSX:MTY:CA), (OTCPK:MTYFF). The young teenager is now a venerable gentleman that has passed on the management reins to a professional CEO. His stake and interests remain however, as he still holds more than 16% (more than the largest institutional funds) of the empire he has built since half a century ago.
The entrepreneur in this story is Stanley Ma. This is my analysis of his company:
About the Business
MTY is in the quick-service, fast-casual and casual dining restaurants space primarily in Canada and the United States. It houses a wide portfolio of more than 80 brands across diverse categories.
MTY Brands (MTY April 2022 Investor Presentation)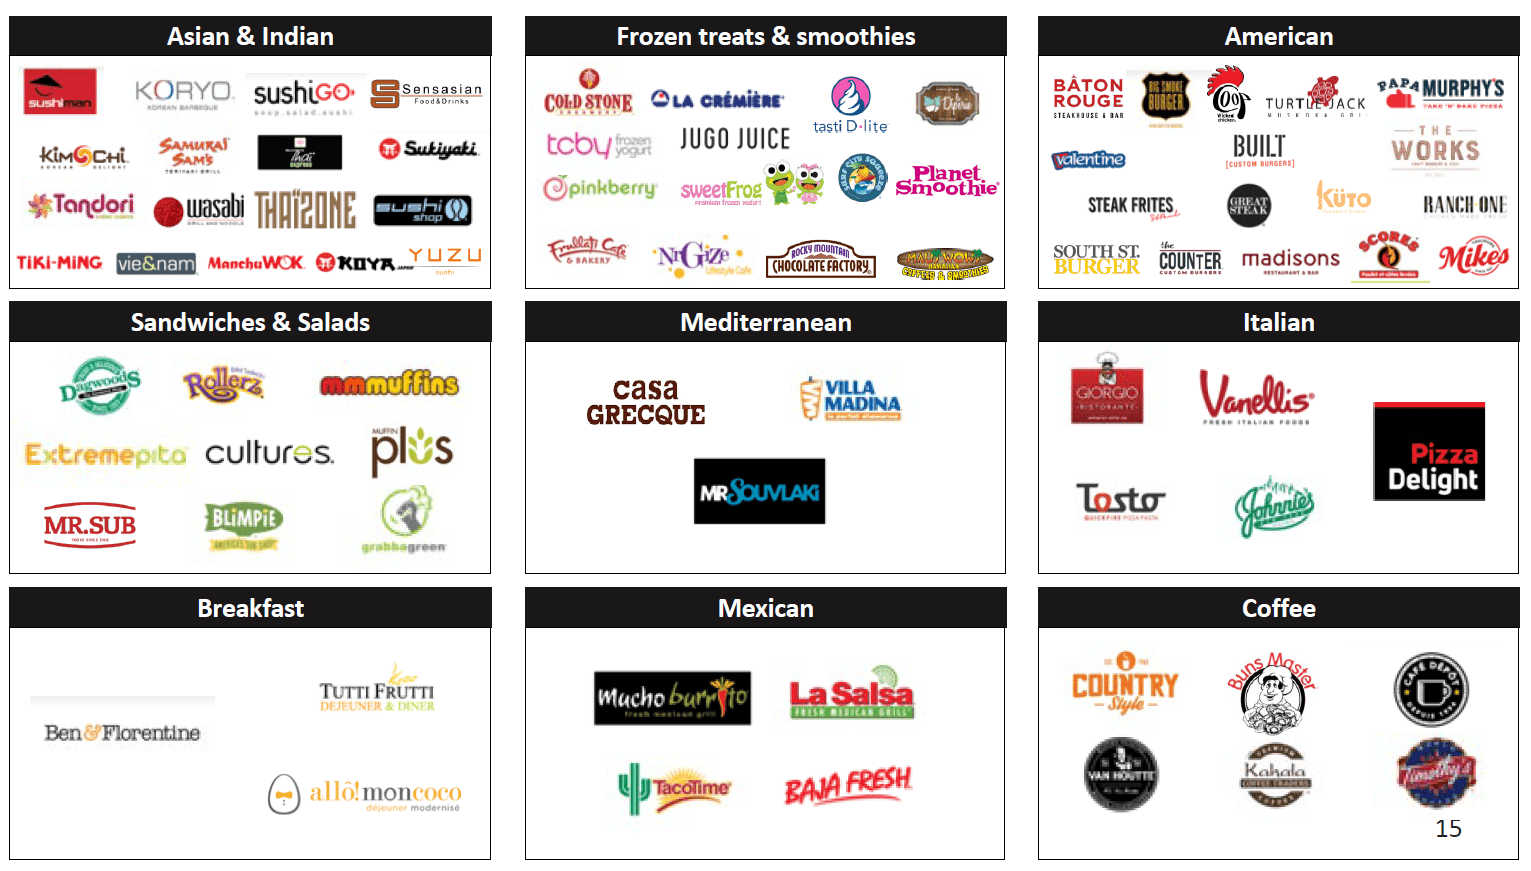
MTY is a wonderful business. It has delivered high and consistent growth well above the cost of capital over the past 15 years:
Key Performance Metrics (MTY Filings, Author’s Analysis)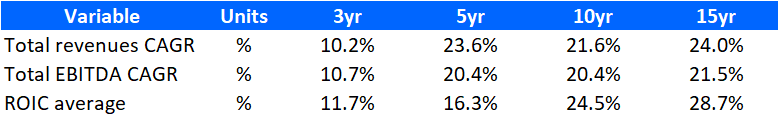
Note that much of this has been due to serial acquisitions. But I think it would be a superficial move to cast a poor judgment on the business due to this reason. This is because the return metrics have still held up rather well. More on this later…
There has been a sharp fall in the growth and return profiles in the last 3 year CAGRs. This is of course due to the impact of the pandemic-driven lockdowns.
Business Profile
Business Model Sales Mix (MTY Filings, Author’s Analysis)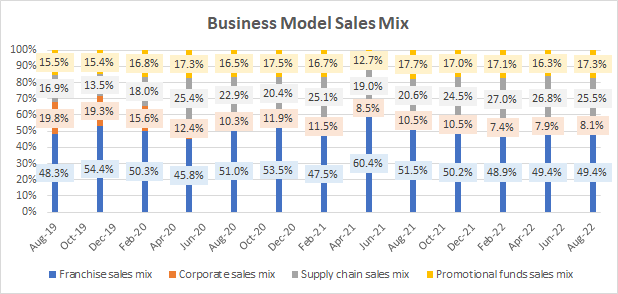
Franchise revenues make up the majority of the sales mix with 49.4% as of Q3 FY22. The business also has a retail arm, which I have called the supply chain sales mix in the chart above. This is present mostly in Canada and has been a growing segment for them. Over the past 3 years, the mix here has shifted from 16.9% to 25.5%. Corporate sales refers to company-owned stores. MTY has seen the mix share of this business fall from 19.8% in Q3 FY19 to just 8.1% in Q3 FY22. Lastly, promotional funds refers to revenues that are ear-marked to automatically go back to marketing and promotion spends. This stands at 17.3% as of Q3 FY22.
Geography Sales Mix (MTY Filings, Author’s Analysis)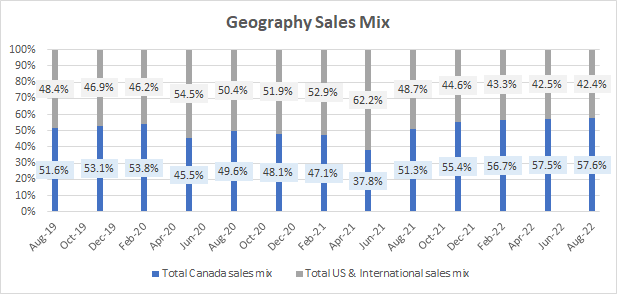
From a geography perspective, the company has 57.6% exposure to the Canada. The remainder belongs mostly to the US, but also includes some international locations. The business entered the US market in 2016 with one big move when it acquired 2800 stores of Kahala Brands in 2016 for $300 million. In 2019, MTY acquired the struggling pizza chain brand Papa Murphy in the hopes of turning it around.
This is characteristic of MTY’s M&A-focused business strategy in the past; absorb mature, struggling brands and operate them better.
One more important thing to note is the margins mix:
Business Model Margins Mix (MTY Filings, Author’s Analysis)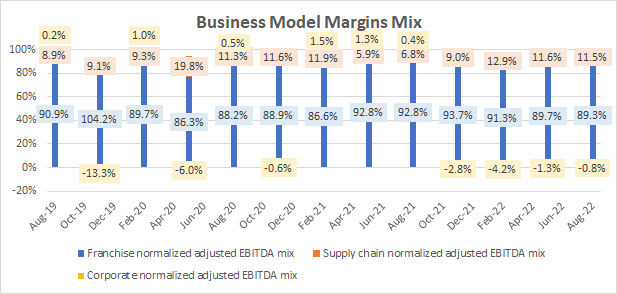
Although it makes up for almost half of the sales, the franchises clock in more than 50% EBITDA margins and hence contribute almost 90% of the overall company EBITDA. The supply chain/retail operations operate at early teens EBITDA margins and make up 11.5% of overall EBITDA. The company owned stores on average have been barely profitable.
From a restaurant model perspective, almost 70% of MTY’s revenues comes via the QSR model:
Restaurant Segment Sales Mix (MTY Filings, Author’s Analysis)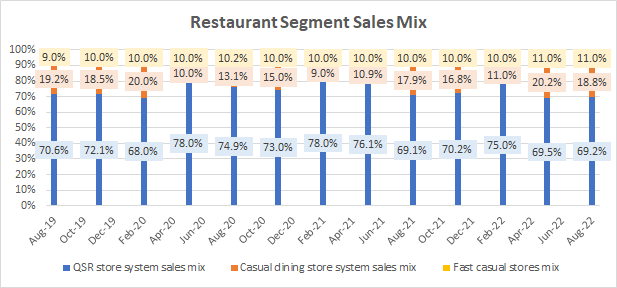
Now, I note a few important characteristics about the MTY business:
M&A Strategy Is Returns-Accretive
Serial M&A acquirers have a bad reputation as inorganic growth is a riskier growth strategy with 70-90% chances of success according to a HBR study. However, MTY has been very successful in its M&A of mature brands, as it clocks in mid-teen post-tax ROICs. This is well above reasonable cost of capital estimates, which would be sub-10%.
Post-tax ROIC (MTY Filings, Author’s Analysis)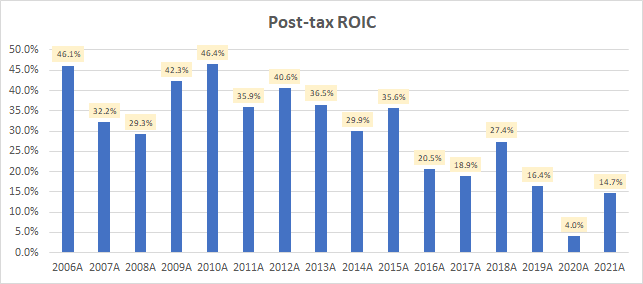
Now some may argue that the post-tax ROICs have been decreasing and therefore this is a bad sign for the business. I disagree with this perspective; ultimately, what matters for value creation is whether a business can grow by making returns above the cost of capital. Sometimes, as is the case here, the valuation math proves that it is indeed the right decision to sacrifice a bit of return margins to continue growth, so long the returns yield economically positive returns.
Total YoY revenue growth (MTY Filings, Author’s Analysis)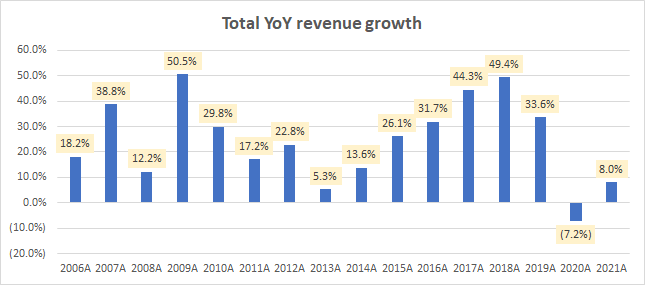
That said, it is clear that the lower return profile began when MTY started its expansion into the US. There is one more critical check to do before confirming whether or not management is making incremental return-accretive decisions:
Is the return on capital for the ex-Canada business above the cost of capital?
Based on my calculations, and assuming a cost of capital of 8%, yes it is:
Pre-tax ROIC for the US and International Segment (MTY Filings, Author’s Analysis)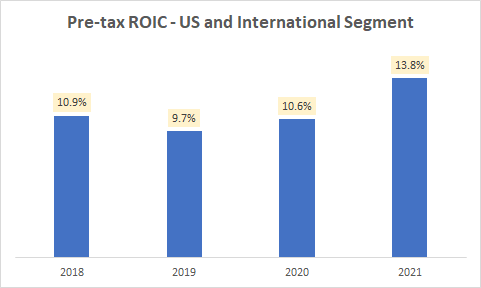
Thus, I can confirm management’s claims that the following claim from MTY’s April 2022 Investor Presentation holds true:
Proven consolidator with disciplined acquisition strategy
Clearly, the MTY business can be looked at from multiple perspectives and slices. Management would have particular growth strategies for each geography, business model, and restaurant genre. But for investors, what is the most important driver of returns? This is what I discuss below:
Franchise Growth is the Most Important Driver
With so many different splits of a diversified business, it is important to identify the few factors that drive future performance of the MTY stock. In my view, the greatest value accretion for MTY comes from growth in the franchising business:
As seen earlier, MTY has proven its ability to deliver vastly superior margins compared to the corporate stores model. This combination of better margins on the higher asset turn nature of the franchise model economics automatically implies higher return on invested capital (ROIC).
As a bonus, the franchise model can be highly resilient to inflation if royalties track CPI, but cost inflation pressures are passed onto the franchisees. This is playing out to benefit Restaurant Brands International (QSR).
If you’re wondering what about different restaurant types (genres) and geographies…
Restaurant Genres and Geographies Matter Less
No Specific Advantage to Any Geography
As both Canada and the United States are developed countries with competitive industry dynamics, it is unlikely that a restaurant business would have materially superior ROIC due to its operational geography. This is evidenced by market share gains of world renowned foreign brands against many local competitors in new markets.
No Specific Advantage to Any Restaurant Genre
Regarding preferences towards particular restaurant genres, although fast casual and casual dining restaurant types make materially higher margins than that of QSRs…
MTY’s Annual per store Revenues (MTY Filings, Author’s Analysis)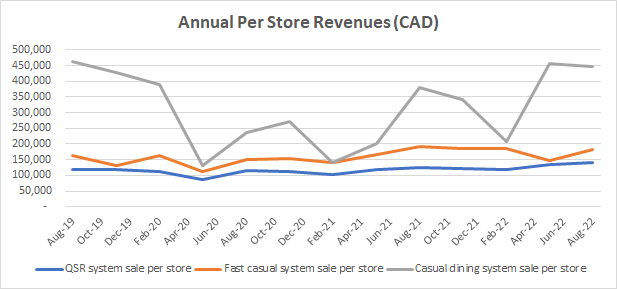
Peer-wide evidence indicates that the higher asset turns of QSR-type models dramatically offset the margins advantage of more full-service restaurants:
Return on Capital Characteristics for Different Restaurant Genres (Company Filings, Author’s Analysis)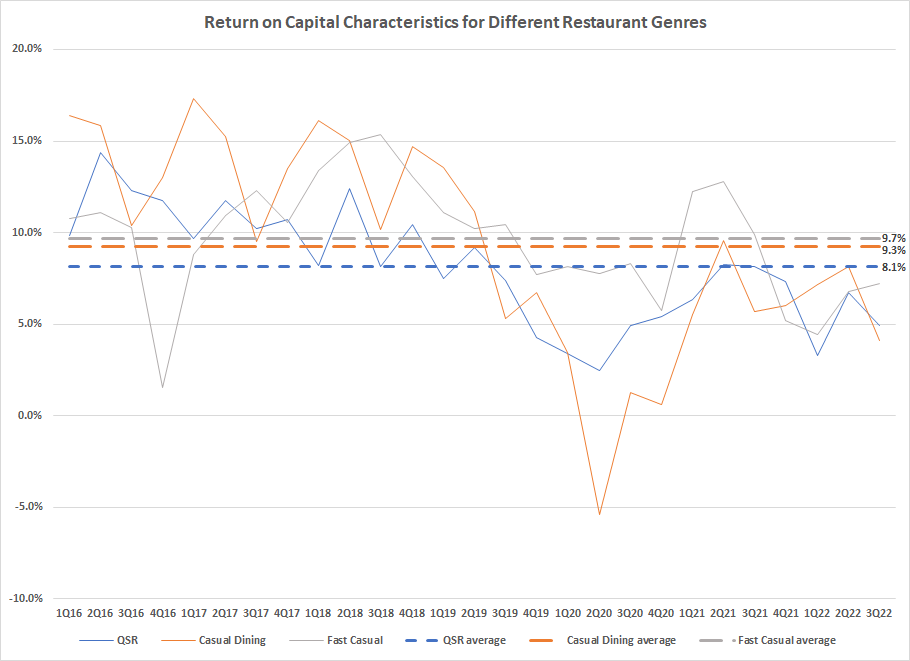
The companies considered in this peer-wide analysis include the following:
Restaurant Genres for Listed Restaurant Companies (Company Filings, Author’s Analysis)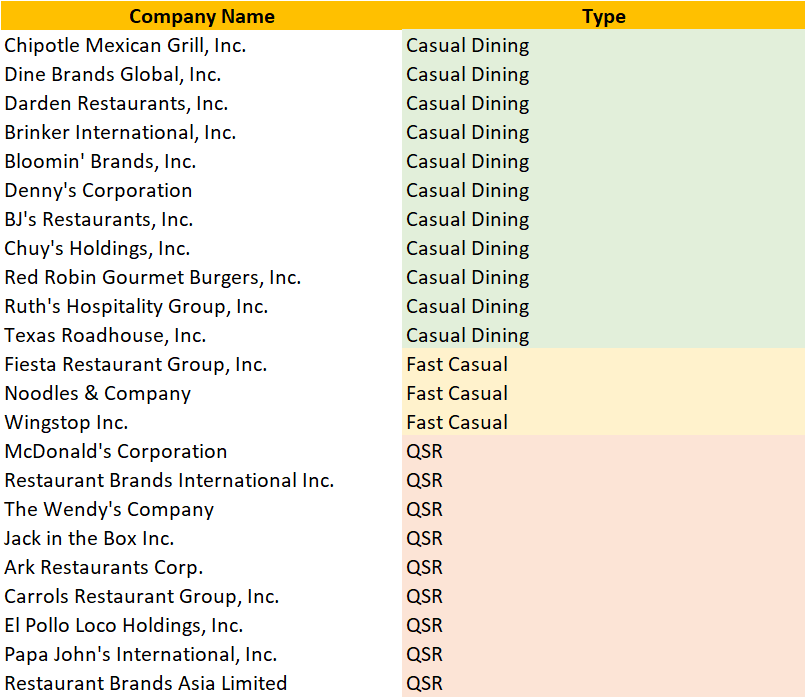
List of peerset companies: (CMG), (DIN), (DRI), (EAT), (BLMN), (DENN), (BJRI), (CHUY), (RRGB), (RUTH), (TXRH), (FRGI), (NDLS), (WING), (MCD), (QSR), (WEN), (JACK), (ARKR), (TAST), (LOCO), (PZZA)
The Bull Case for MTY
I am bullish MTY for two key reasons:
- Acquisition of Wetzel’s Pretzels will drive value accretion via franchise growth
- Management has a high degree of alignment with increasing stake
I’ll now explain this in more depth below:
Acquisition of Wetzel’s Pretzels will drive value accretion via franchise growth
On November 2 2022, it was announced that MTY is buying Wetzel’s Pretzels, a QSR in the snacks category, for US$207 million. Given LTM sales of US$245 million, and assuming a 50% EBITDA margin (consistent with the current franchise economics), I get an implied EV/EBITDA transaction multiple of 1.7x:
Wetzel’s Pretzel Transaction Valuation Workings (MTY Filings, Author’s Analysis)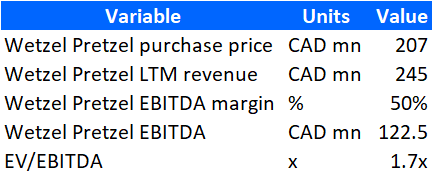
In return, MTY will dramatically increase its presence to 4,200 locations in the US and increase its franchised business mix. More specifically, overall system-wide sales mix from the US is expected to jump up to 70% from the current level of 56%.
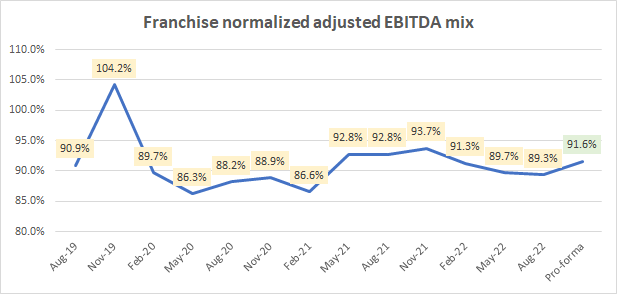
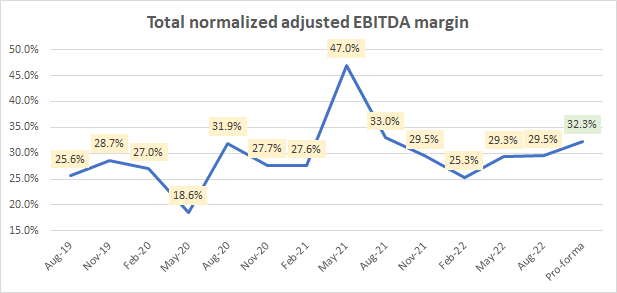
The kicker is that Wetzel’s Pretzels is a 90% franchisee-operated business. Assuming a franchise EBITDA margin of 50% and a royalty rate of 5.25% – which is in-line with historical norms – the incremental impact would result in franchise sales mix increasing from 49% to 56%, the franchise EBITDA mix jumping from 89.3% to 91.6% and the overall EBITDA margin profile jumping from 29.5% to 32.1%:
Franchise Sales Mix (MTY Filings, Author’s Analysis) Franchise EBITDA mix (MTY Filings, Author’s Analysis) EBITDA Margins (MTY Filings, Author’s Analysis)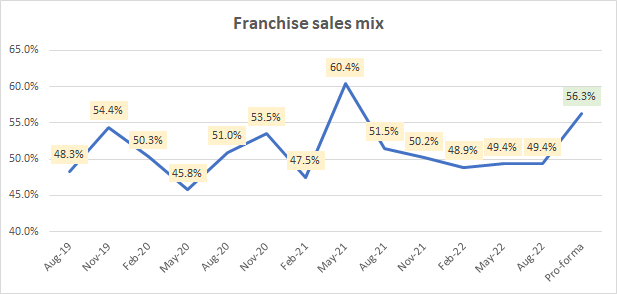
This aligns with management’s expectations that the acquisition will be:
..Immediately accretive to MTY’s earnings, EBITDA and free cash flow per share.
Overall, I believe management has paid a good price for this acquisition given the value accretion it would deliver to the overall business profile. I am confident that given management can continue creating their magic to drive healthy double-digit revenue and margins growth in the teens, if not the twenties.
Management has a high degree of alignment with increasing stake
Stanley Ma, who is the founder, former CEO and current Chairman and President of MTY Food Group tops the shareholding list with a 16.41% stake in the company:
MTY Ownership Summary (Capital IQ)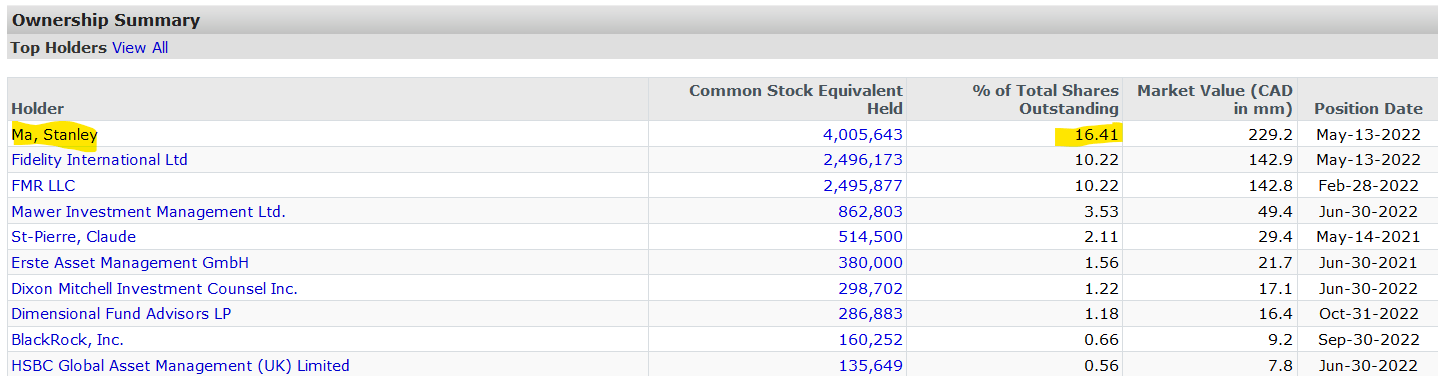
Altogether, insiders hold a 19.46% stake in the business. Clearly, this depicts a high degree of shareholder alignment.
Moreover, the insider stakes have been increasing in the past year via open market acquisitions. CEO Eric Lefebvre bought CAD$53,768 worth of MTY stock in February 2022. This corresponds to almost 9% of his annual compensation package of CAD$602,829. Around the same time, CFO Renée St-Onge bought CAD$21,123 worth of MTY stock. This corresponds to 4.5% of her annual compensation of CAD$471,857. I think it’s fair to say these are material purchases for these individuals.
Lastly, I highlight what GS Investing, another Seeking Alpha noted in his article:
..Management compensation is now tied to EBITDA organic growth
Indeed this is true, as the Lefebvre himself notes in a Q3 FY19 earnings call:
Compensation linked to organic EBITDA growth (MTY Q3 FY19 Earnings Call Transcript)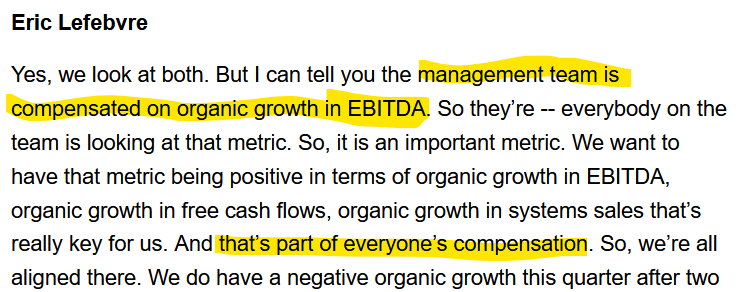
Altogether, this gives me confidence that there is strong shareholder alignment in MTY. This is a very important and reassuring factor since there is little institutional coverage on this stock. Generally, the chances of poor corporate governance is less when there are many institutional eyes watching a stock.
Valuation
These are my key assumptions for a simple DCF valuation of MTY:
Total YoY Revenue Growth (MTY Filings, Author’s Analysis)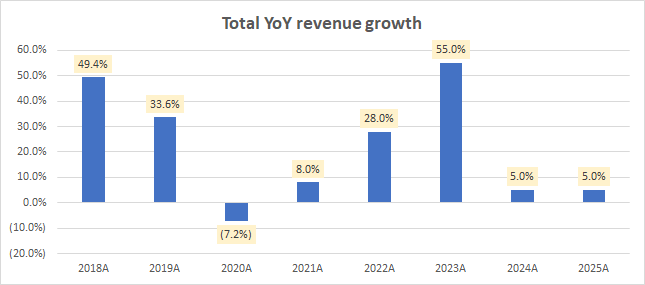
My FY22 and FY23 revenue growth estimates take into account a $CAD64 million revenue addition impact from the BBQ acquisition in Q4 FY22 and a CAD$257 million revenue addition impact from the Wetzel’s Pretzels acquisition. After 2023, I have assumed organic growth. This may not be likely, but it is simply a best-practice modelling convenience as acquisitions are hard to predict.
EBITDA margin (MTY Filings, Author’s Analysis)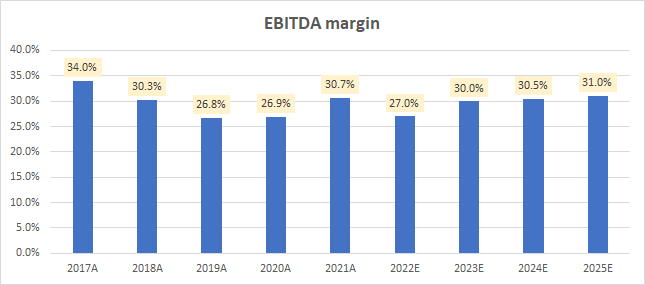
The BBQ acquisition has a 67/33 franchise/corporate store split. Assuming historical margin profiles, and impact of BBQ to start flowing in from Q4 FY22, I see a temporary margin drop to 27%. In 2023, I expect the Wetzel’s Pretzels business’ superior margin profile to flow in the numbers and lead to a 300bps margin uptick. For FY24 and FY25, I have assumed a modest amount of operating leverage from SG&A efficiencies.
Net operating working capital days (MTY Filings, Author’s Analysis)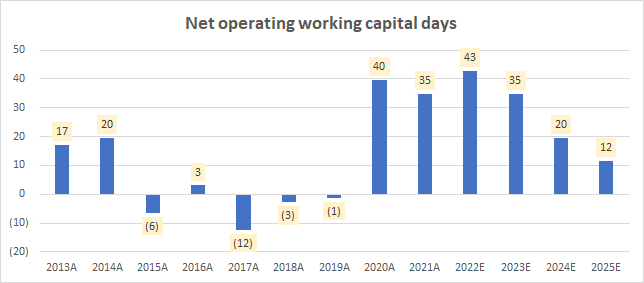
I have moderated working capital back towards longer term average levels, reflecting easing supply chains.
Gross asset turns (MTY Filings, Author’s Analysis)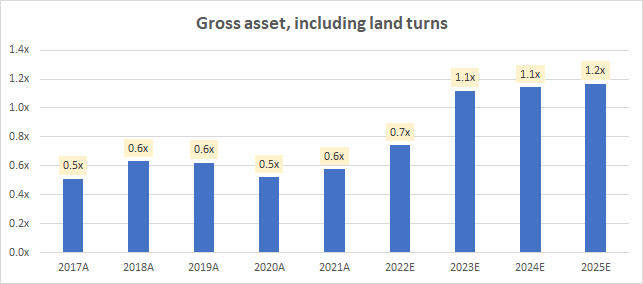
Gross asset turns are expected to rise as the business shifts towards a higher franchising mix.
Post-tax ROIC (MTY Filings, Author’s Analysis)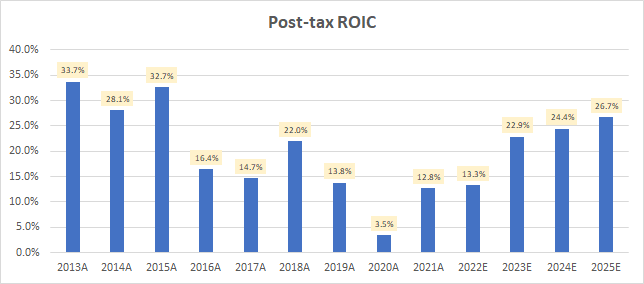
I anticipate value accretions from a higher franchising mix, incentivized efforts to boost organic EBITDA growth, and gradual operational efficiencies to result in an ROIC uptick. Here, I halved assumed a Canadian marginal corporate tax rate of 26.5%.
Operating cash flow/EBITDA (MTY Filings, Author’s Analysis)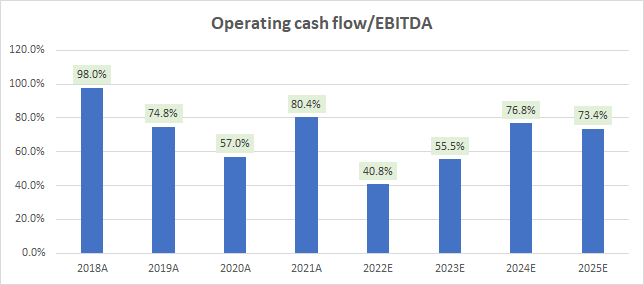
My operating assumptions result in a return to mid-70s operating cash flow conversion of EBITDA. Incidentally, this is consistent with management’s expectations. In the Q3 FY22 earnings call, management highlighted that they expect cash flows to be 70-80% of EBITDA.
MTY Valuation Summary (MTY Filings, Author’s Analysis)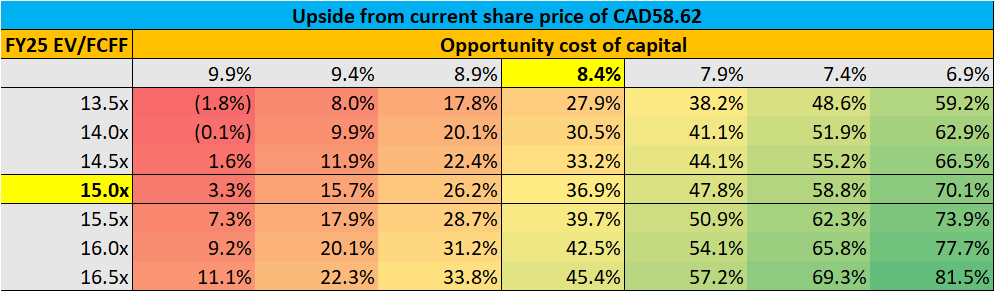
Canada’s cost of equity is estimated to be 4.2% according to the datasets prepared by the “Dean of Valuation” Professor Aswath Damodaran. The 5-year beta for MTY is 1.84 according to Capital IQ datasets. Based on this, I conservatively assume an opportunity cost of capital twice that of the cost of equity; 8.4%.
For ascribing a terminal value, I use enterprise value to free cash flow to firm (EV/FCFF) terminal value multiples as this allows for explicit input of my terminal year (2025) operating assumption views. This Twitter thread on valuation multiples explains how to use and interpret EV/FCFF multiples.
In this case, a 15.0x FY25 EV/FCFF multiple corresponds to a 9.1x FY25 EV/EBITDA multiple. The stock is currently trading at a 1-yr forward EV/EBITDA of 9.6x:
MTY 1-yr forward EV/EBITDA timeseries (Capital IQ)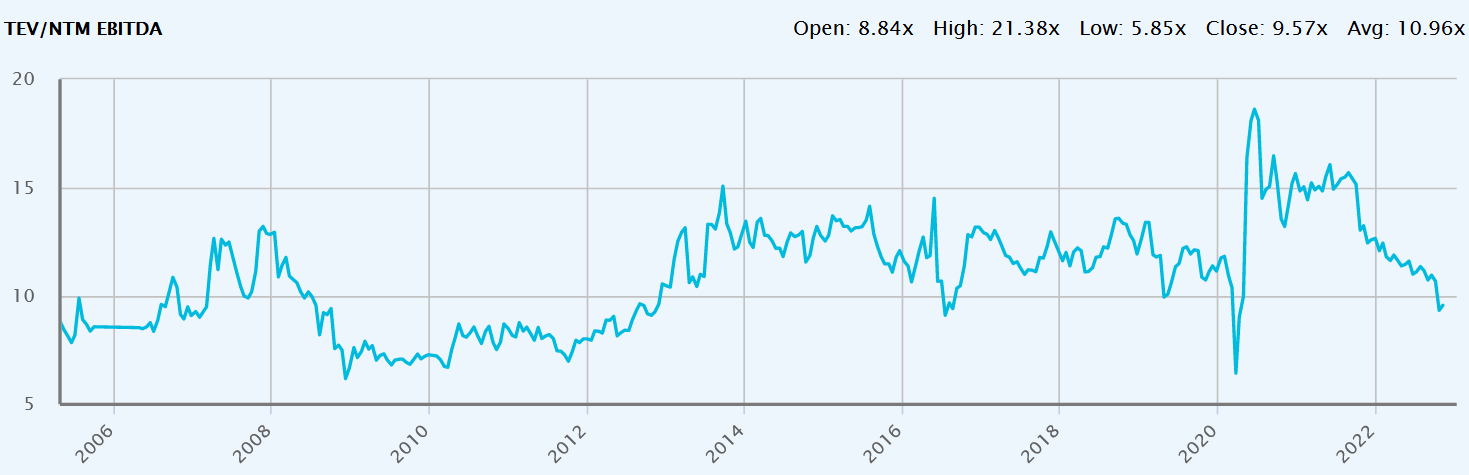
Thus, I am not assuming any re-rating of the stock at all. Rather, I am conservatively baking in a slight de-rating. Overall, I get an upside of 36.9% from the current share price of CAD$58.62, resulting in a target price of CAD$79.60.
Key Performance Metrics including Forecast (MTY Filings, Author’s Analysis)
I think this is quite reasonable. Compared to history, the 3-year forward outlook suggests a faster growth rate, bolstered by 2 acquisitions which together add on an additional 91% of the FY21 revenue base. The return to normalcy, focus on organic EBITDA growth and operational efficiencies are expected to result in only a small deterioration in ROICs compared to long term averages.
Technical Analysis
MTY Technical Analysis (TradingView, Own Analysis)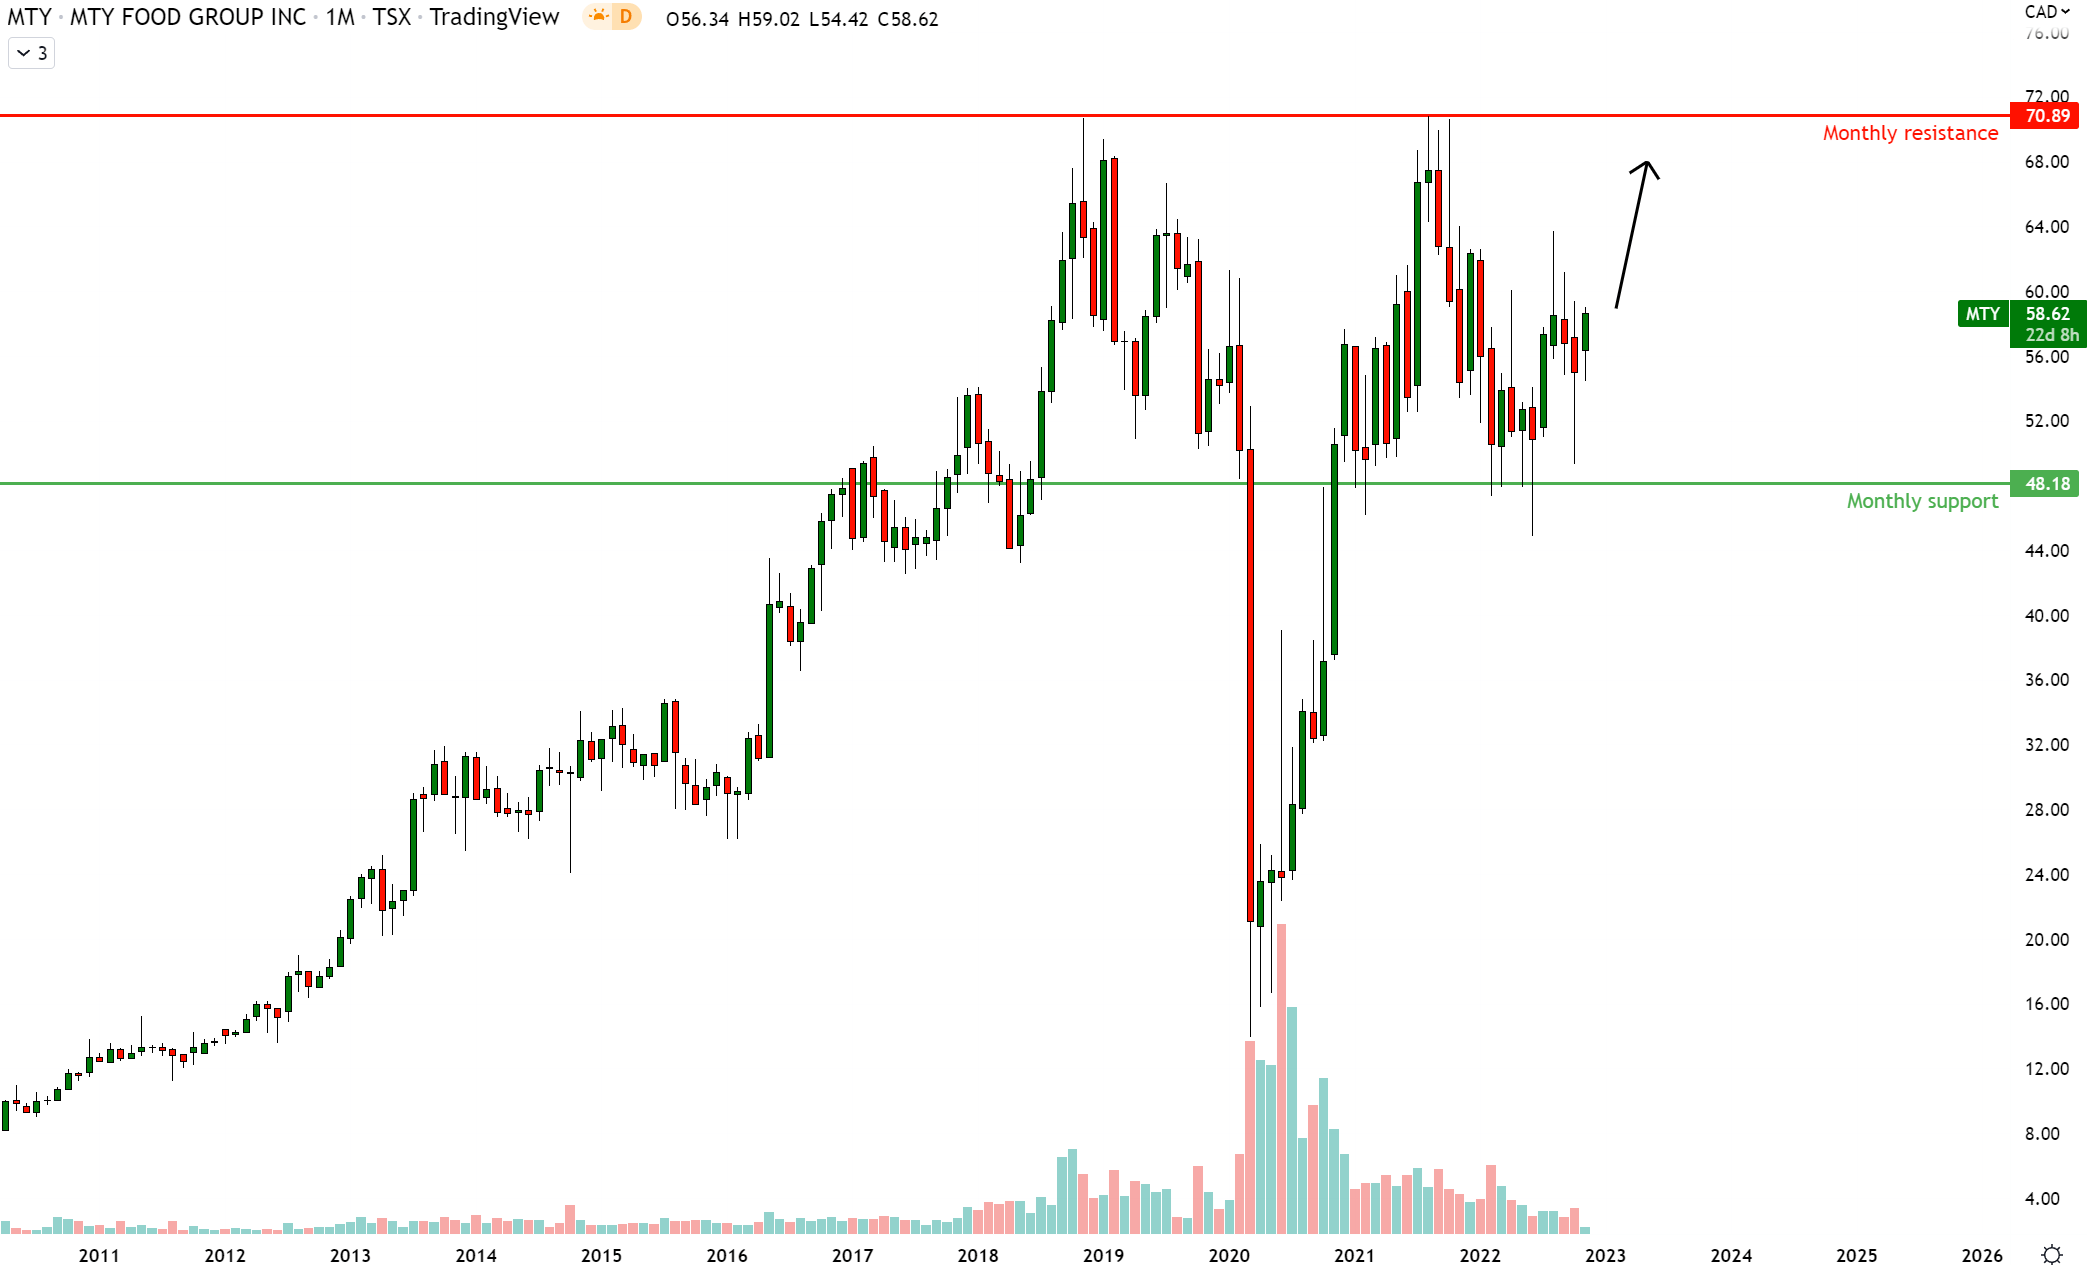
MTY has formed a base and reacted off monthly support at CAD$48.18. It looks like price is consolidating and gearing up for a move north towards the monthly resistance at CAD$70.89. Hence, my read of the standalone MTY chart is bullish.
MTY vs S&P500 Technical Analysis (TradingView, Own Analysis)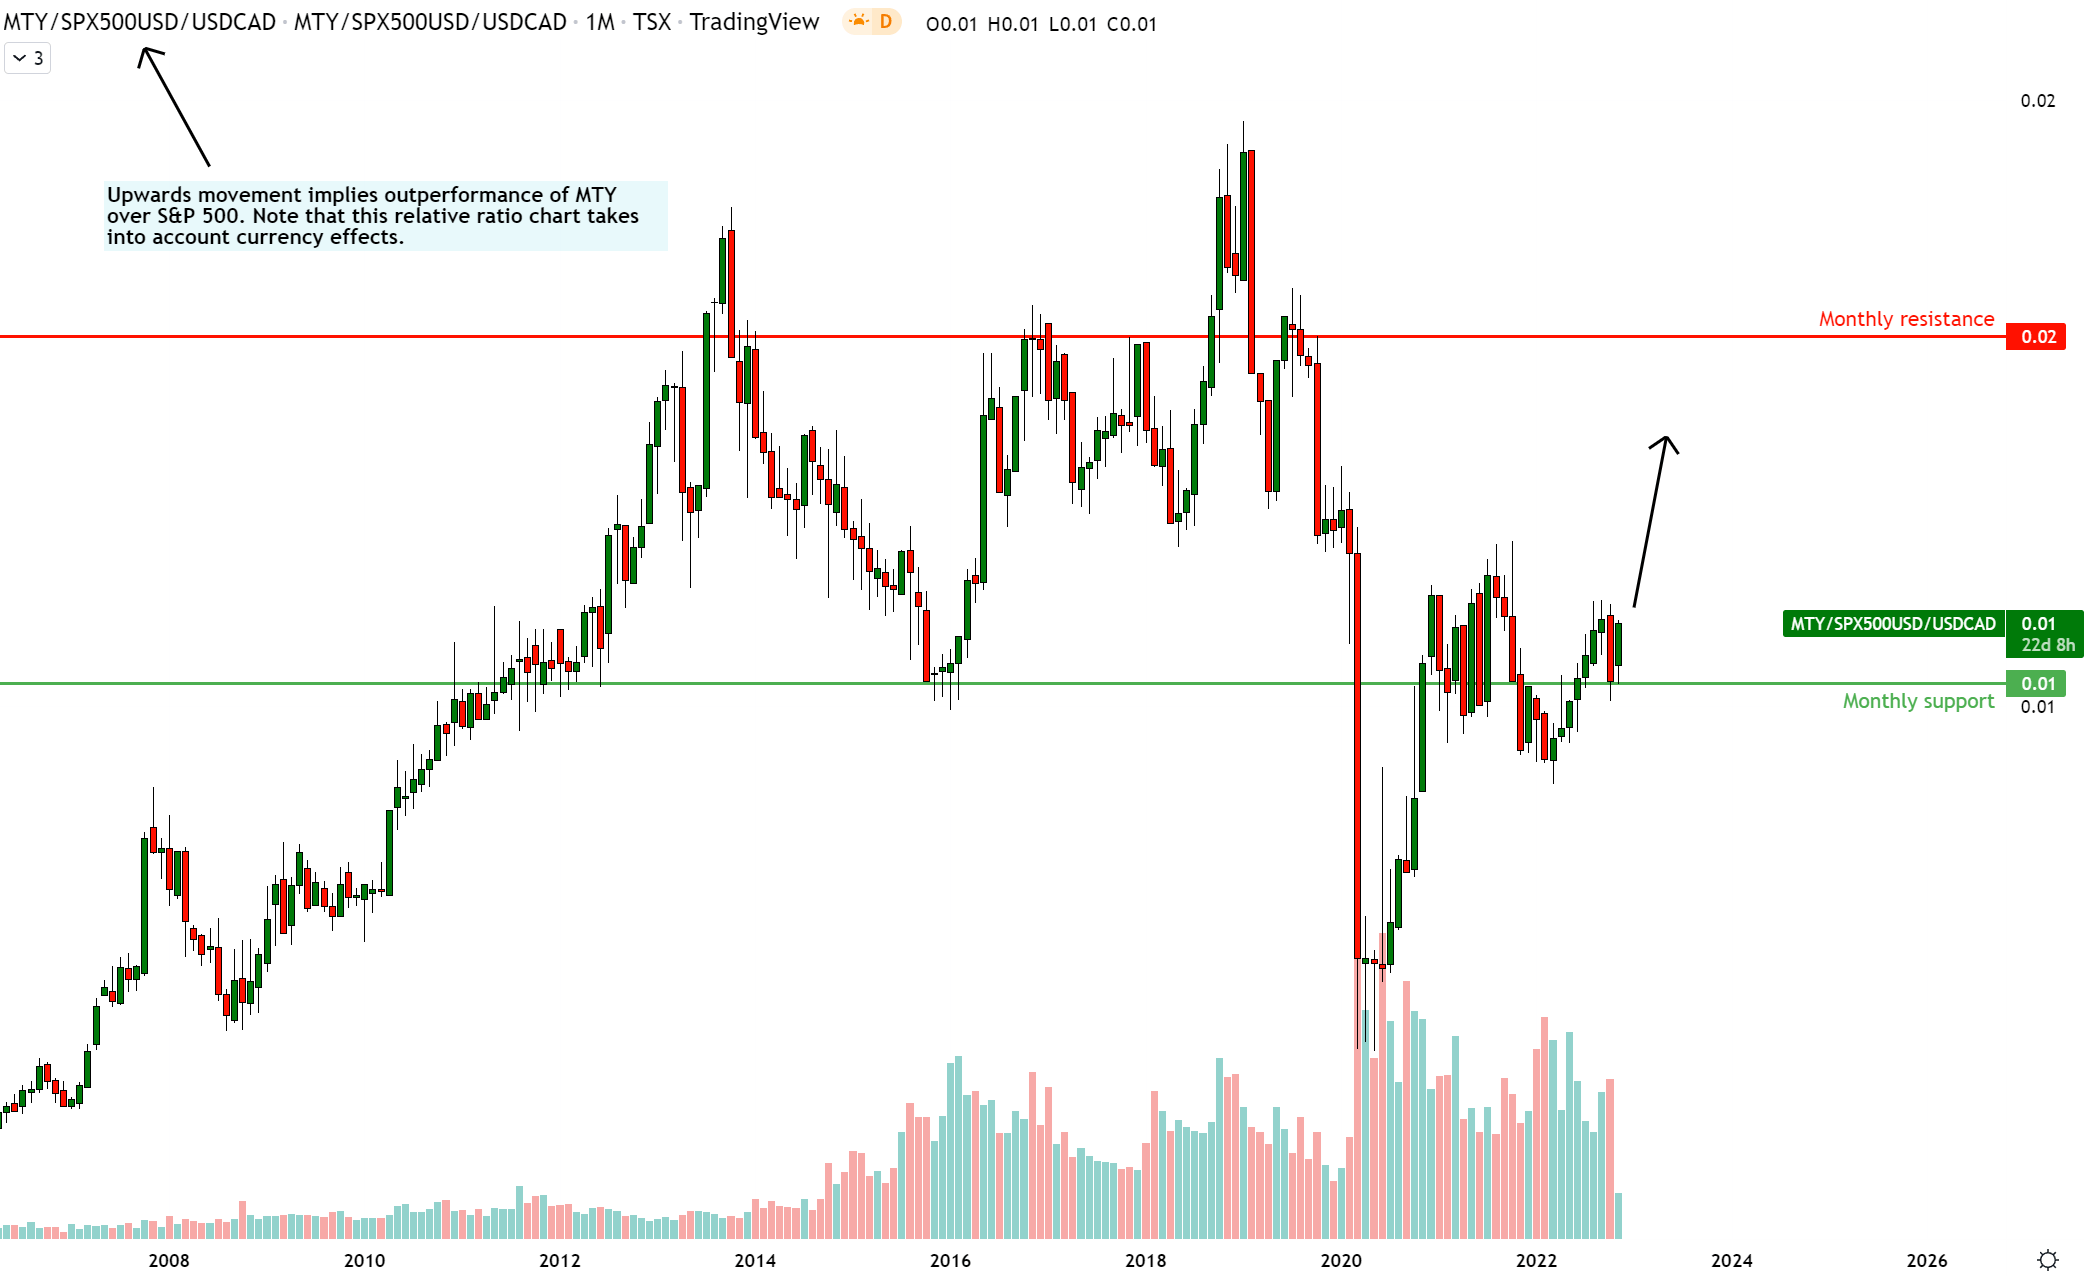
On the relative chart of MTY vs S&P 500 (SPY), corrected for the USD/CAD currency movements, I see prices consolidating just above a monthly support. In my read of this situation, a blast upwards is due soon towards the monthly resistance, initiating a period of alpha performance for MTY.
Overall, my read of the price action in the absolute and relative charts of MTY indicate bullishness and alpha potential over the medium term.
Key Monitorables
Management has recently made 2 big acquisitions that almost double the company’s FY21 revenue base. This may make some a bit queasy. I note that Lefebvre, the current CEO of the company, was formerly the CFO. So he clearly has vast amounts of experience in successfully playing the M&A game. Yet, every new M&A is a challenge for business operators. Hence, the integration of BBQ Holdings and Wetzel’s Pretzels is a key monitorable.
Additionally, I have assumed margin resiliency and improvement coming from the higher franchise share mix. This is leading to minimal reductions in ROICs compared to historical levels. I will be keeping a close eye on these metrics to see if my view here plays out as expected.
Positioning
I look at this story as betting on growth with aligned insiders. The strong, value-accretive track record of the company and their vested interests give me confidence in MTY despite its serially acquisitive nature. Regarding timing, my read is that the stock is ready to blast up anytime soon, so it is best to get in as soon as possible. I am already in the stock as of last week. I think the clouds are clearing and since the Q3 FY22 earnings report is already behind us, I do not realistically foresee many events that can lead to some nasty surprises on the share prices, especially relative to the S&P 500.
Editor’s Note: This article was submitted as part of Seeking Alpha’s Top Ex-US Stock Pick competition, which runs through November 7. This competition is open to all users and contributors; click here to find out more and submit your article today!
Be the first to comment