

Jonathan Kitchen
iShares Edge MSCI USA Momentum Factor ETF (BATS:MTUM) is an exchange-traded fund whose investment mandate is to allocate capital to mid- and large-cap U.S. stocks that are demonstrating strong price momentum. The fund basically seeks to pursue a momentum trading strategy that is automated for investors.
Momentum is one of the most simplest quantitative strategies, and it typically works best during bull markets. The fund carries a net expense ratio of 0.15%, which is low-cost, and this is supported by the fund’s high popularity and scale; net assets under management were $12.31 billion as of November 9, 2022. That follows negative net fund flows of about -$1.45 billion over the past year.
ETFDB.com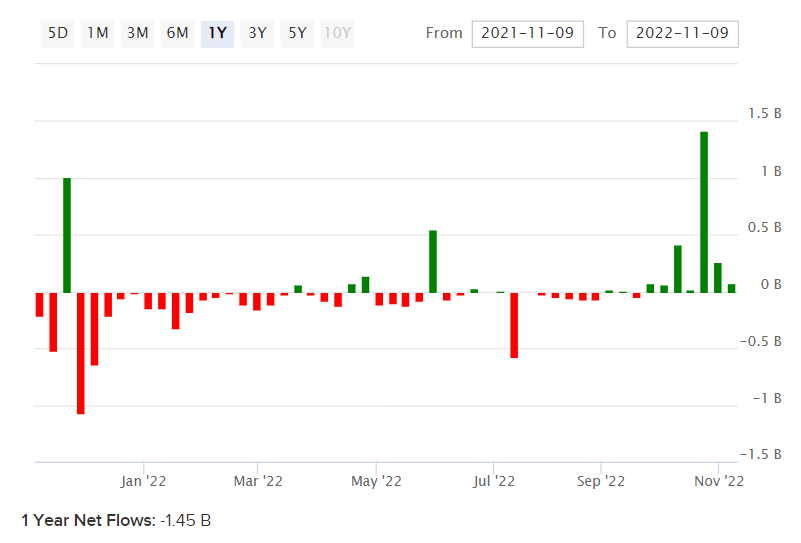
Somewhat surprisingly, the fund has some significant exposure to healthcare stocks; over 30% of the fund as of November 8, 2022. Healthcare stocks are traditionally viewed as defensive.
Morningstar.com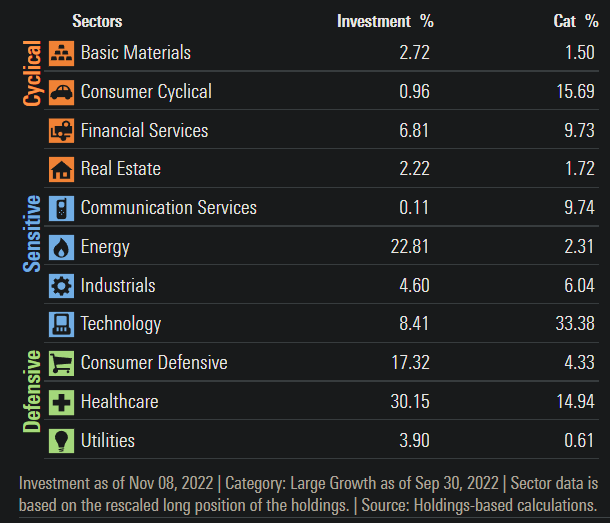
The fund also has a circa 17% exposure to consumer staples/defensive stocks. Energy is also a significant portion of the fund at 23% as of recent, but that does perhaps present a risk, as energy stocks have shown great momentum off the back of a potentially short-term cyclical rebound in energy prices this year. Still, MTUM has performed well this year. A popular tech stock fund is Invesco QQQ Trust (QQQ); the chart below shows the ratio between MTUM’s share price and the QQQ share price. MTUM has clearly out-performed QQQ during 2022 by about 16% on a price-only basis at the time of writing.
TradingVIew.com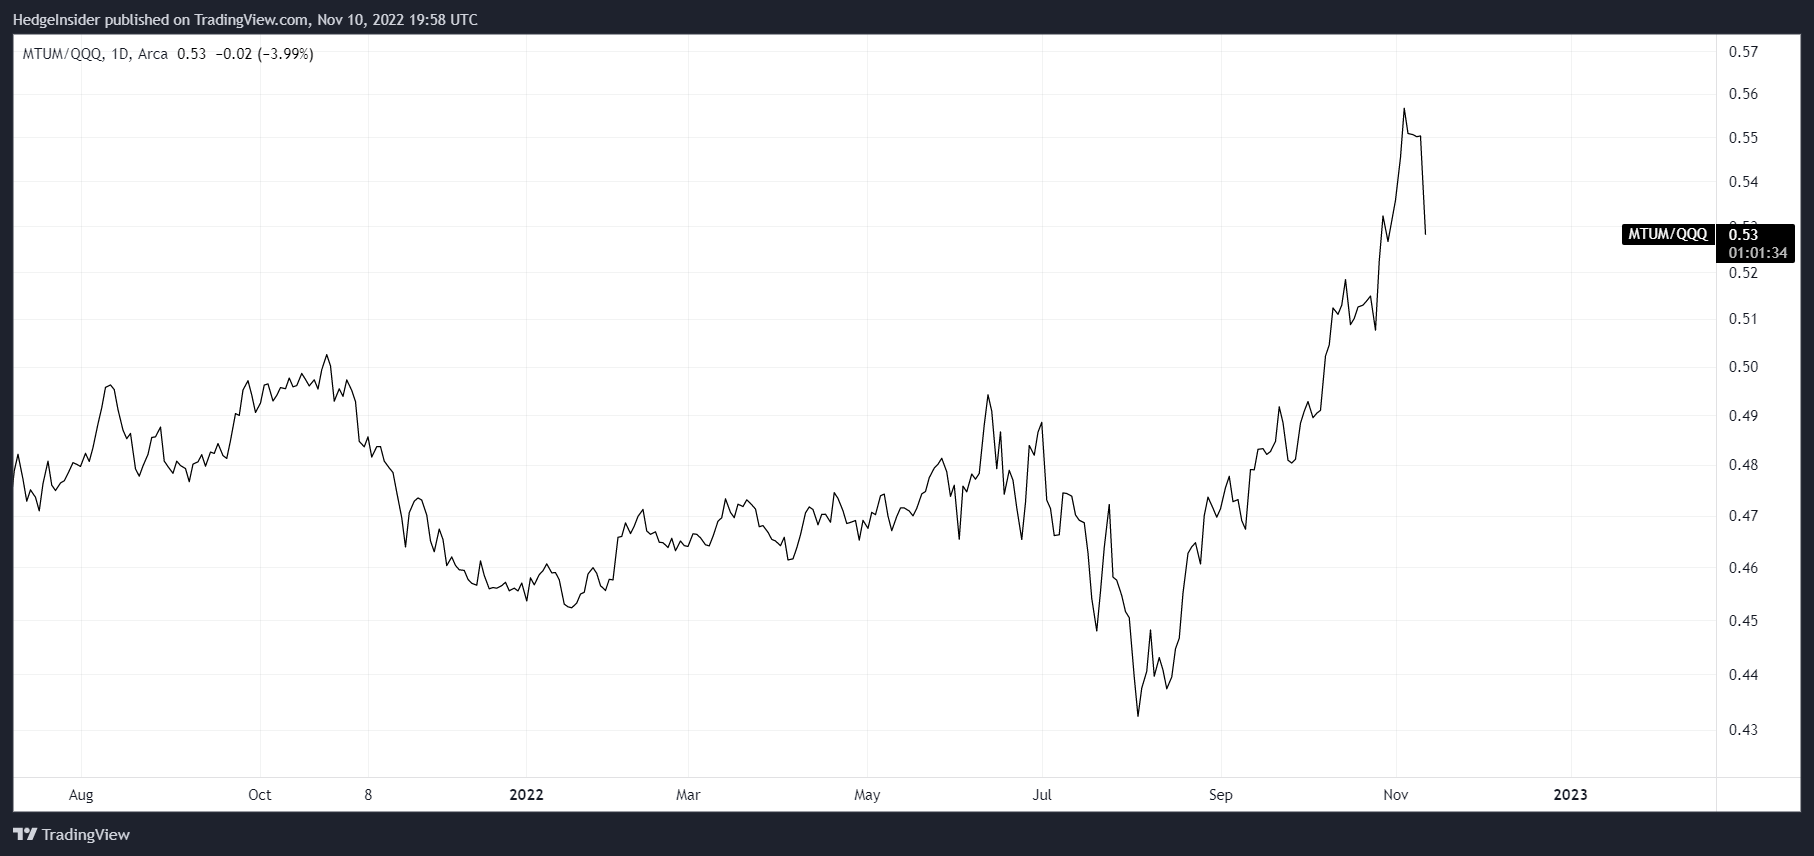
MTUM is a difficult portfolio to value since its methodology is such that rebalancings could potentially restructure the portfolio in a significant way. Having said that, you could argue that if the fund’s underlying portfolio is undervalued, it could benefit from further inflows and thus higher prices, and vice versa, and thus value may well be a significant underlying factor.
MTUM seeks to track the performance of its chosen benchmark index, which is the MSCI USA Momentum SR Variant Index. The most recent factsheet for the index, as of October 31, 2022, suggests that (by extension) MTUM’s underlying trailing and forward price/earnings ratios were 17.49x and 14.57x, respectively, with a price/book ratio of 4.02x. That also implies a forward return on equity of 27.59%, which is high, and a forward earnings yield of 6.86%. That creates a wide range of potential with respect to longer-term performance. Nevertheless, we can start making estimates, even in spite of the potential for large rebalancings.
The fact that MTUM only invests in U.S. stocks makes valuing the fund as at a particular date, in my case October 31, 2022, much simpler. The current U.S. 10-year yield is 3.83% at the time of writing. If we add a U.S. equity risk premium of 4.2-5.5%, that takes our cost of equity to 8.03-9.33%. Assuming a minimum 2% long-term earnings growth rate, that would mean that our long-term forward price/earnings ratio should be at least 13.64-16.58x. The current multiple of 14.57x is therefore within range of acceptability.
A more granular look is below, which assumes a falling return on equity to about 22% in year six. My three- to five-year average earnings growth comes to about 14% in this case, which is close to the consensus of 13.37% per figures from Morningstar. The implied headline IRR is some 18% assuming a constant forward earnings multiple at about 14.5x.
Author’s Calculations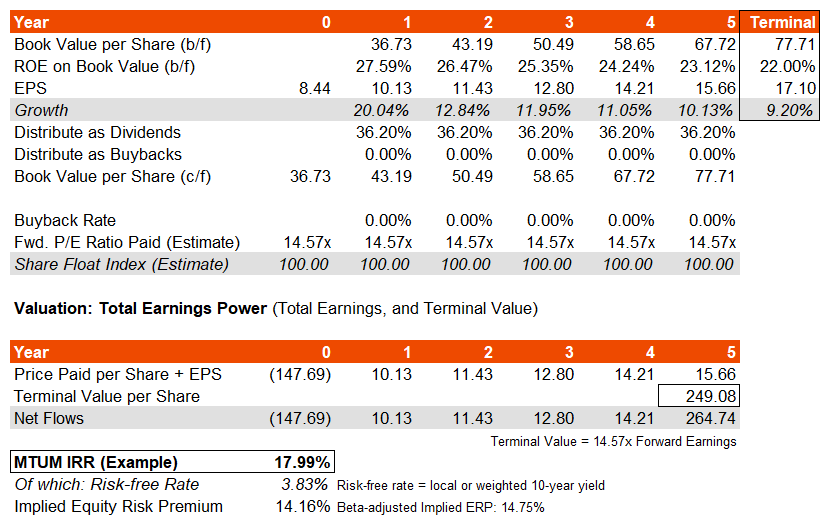
However, this assumes the high return on equity is possible without buybacks. Assuming that a large, profitable and energy-heavy portfolio buys back stocks on average using at least 50% of annual retained profit, the headline IRR would fall back to as little as 9%. This would however result in a much lower average earnings growth rate of 5-8%, which would be below consensus; that is because a lower book value (or using another word “book equity”, due to stock buybacks draining retained funds) would generate lower annual profits at a relatively constant return on (book) equity.
Therefore, it would seem like consensus earnings growth figures are not assuming large buybacks. In any case, whether MTUM’s fund is offering an 8% IRR or an 18% IRR, the underlying equity risk premium is high, and the fund’s five-year historical beta is somewhat surprisingly sub-1.00x. That means that the underlying ERP is likely to be very healthy, between 5-15%.
Undervaluation is not necessarily a sign that MTUM’s portfolio will continue to out-perform, but it is a significant and welcome tailwind for MTUM investors. Furthermore, with the U.S. possibly heading into a contractionary phase in its business cycle, it is more than possible that MTUM may have already bottomed in this year, and will surge into the next business cycle (as markets tend to lead the real economy by up to 12 months). I am therefore bullish on MTUM in all key respects at this current juncture.
Be the first to comment