

wildpixel
The investment thesis
MSCI Inc. (NYSE:MSCI) is about to report Q4 FY2022 earnings on January 31st and the stock has gained nearly 30% since the October 2022 lows. The business has significant competitive advantages and it is likely that double-digit growth will continue in the mid-term, driven by the ongoing shift to passive investments and momentum in ESG investing. However, shares are trading at such a high valuation that there is no room for errors. Based on a DCF analysis, I estimated that the stock has around 37% downside to be attractive for my personal required rate of return. I therefore give a ‘Sell’ rating to MSCI.
Business overview
MSCI has a long history of providing decision support tools and services to the investment community. Asset managers are considered the most important clients of MSCI based on the subscription run rate, but its products are also used by banks, trading companies, asset owners, consultants, and hedge funds. The largest client by revenue is BlackRock, Inc. (BLK) which accounted for nearly 13% of MSCI’s total revenue in FY2021.
Business segments
Reported revenue is divided across four different segments:
- Index
- Analytics
- ESG & Climate
- All Other – Private Assets
Index is by far the largest segment accounting for 58% of total operating revenue at the end of Q3 FY2022. Next, 26% of revenue is generated through the Analytics segment, 10% through the ESG & Climate segment, and finally 6% through All Other – Private Assets.
Through the Index segment, MSCI offers a broad range of indices used by clients for different purposes. They can be used to create indexed products (e.g. ETFs, mutual funds, futures, options), act as a benchmark to track performance, construct and rebalance investment portfolios, and asset allocation. Indices can be market cap weighted (e.g. MSCI World, MSCI Emerging Markets), aimed at ESG & Climate (e.g. MSCI Climate Change, MSCI ESG Leaders), factor-based (using momentum, volatility, dividend yield, value, etc.), or based on themes and global trends (e.g. mobility, robotics, health, circular economy).
Most investors are directly or indirectly invested in one or more ETFs which are linked to MSCI equity indices. Currently, $13.5 trillion in AUM is benchmarked to MSCI. According to a publication from PwC, global ETF AUM is expected to grow at a 17% CAGR through 2026. Equity indices are the core focus of MSCI, which makes this company a great play to benefit from the ongoing shift to passive investments.
Over the first nine months of FY2022, 55% of Index revenue was attributable to recurring subscriptions and 41% to asset-based fees. MSCI considers asset-based fees as recurring revenue, despite the dependency on market volatility. Index revenue through asset-based fees actually declined with 0.4% from the prior year. On the other hand, AUM is expected to increase over the long-term driven by cash inflows in MSCI-linked ETFs and market appreciation. The following figure shows that, even during the global financial crisis, ETFs linked to MSCI equity indices experienced cash inflows.
MSCI-linked equity ETF AUM (MSCI Investor Relations)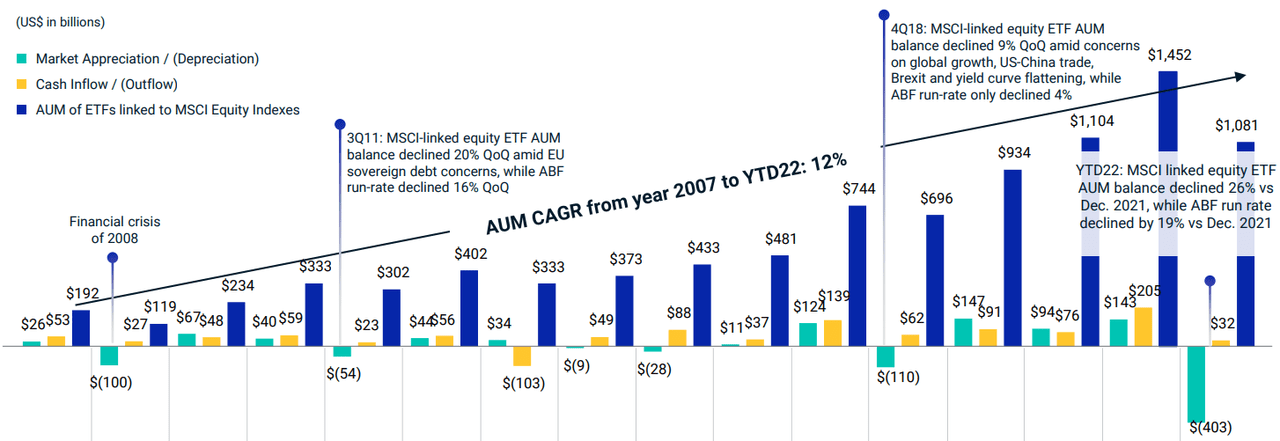
The Analytics segment comprises of tools for different purposes, such as factor-based analysis, portfolio optimization, multi-asset class risk analysis, monitoring climate exposure, and constructing asset allocation policies. Currently, more and more investors want to focus on ESG, climate, or other specific investing themes. One of the Analytics offerings, Climate Lab Enterprise, aggregates climate data across client portfolios and asset classes, enabling clients to understand whether their asset allocation matches their climate goals. Nearly all revenue from Analytics is generated through subscriptions (99% over the first nine months of FY2022).
ESG & Climate took off in the past few years as these themes have become mainstream in the investing community. ESG and climate-related revenue growth is well in the double-digits, as shown in the following figure.
Firmwide ESG & Climate Run Rate (MSCI Investor Relations)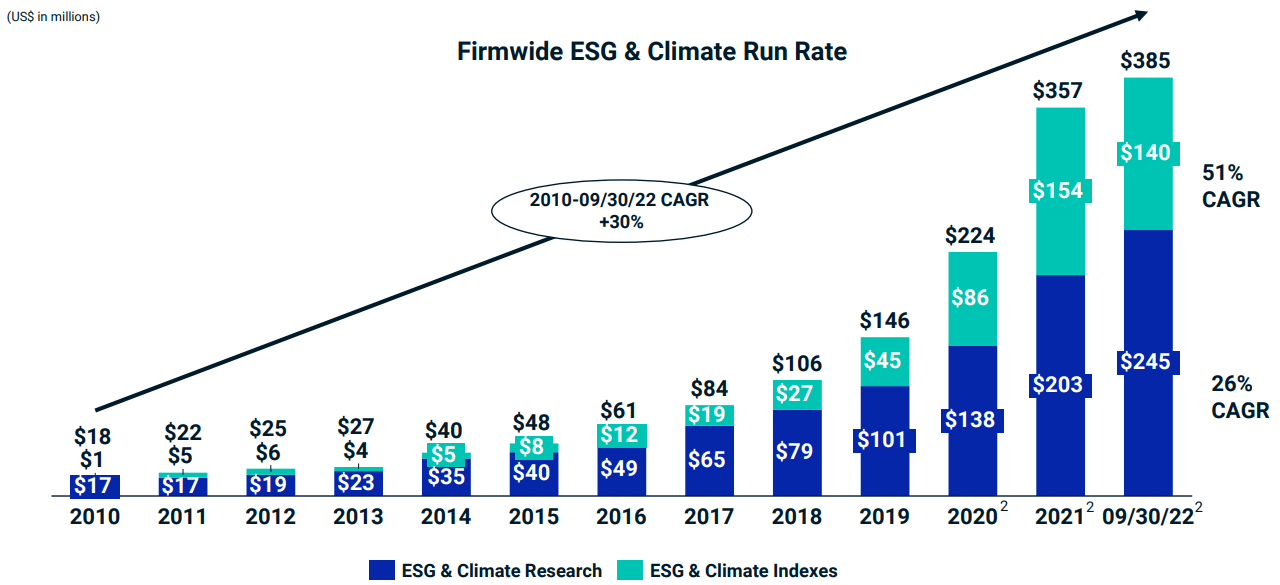
The ESG & Climate segment includes MSCI ESG Ratings which analyse and score businesses on the key ESG issues (e.g. geopolitical risks, social and environmental impact). Asset managers could choose to only offer securities that have a certain ESG rating, which gives companies an incentive to improve their rating. Other solutions provide clients with ESG and climate data to manage potential ESG portfolio risks, measure climate exposure, and support their investment decision-making. Also for this segment the majority of revenue is generated through subscriptions (98% over the first nine months of FY2022).
The final and fourth segment, All Other – Private Assets reflects the Real Estate operating segment which offers real estate transaction data, property benchmarks, return analytics, and market insights. Operating revenues doubled over the first nine months of FY2022, mainly driven by the acquisition of Real Capital Analytics, a platform that aggregates real estate transaction data across 170+ countries to deliver intelligence on market pricing, capital flows, and investment trends. Subscription-based revenue accounts for 99% of total revenue in this segment.
Competitive advantages
MSCI has a significant MOAT that will guarantee growing cash flows in the foreseeable future. The main competitive advantages can be found in the Index and ESG & Climate segments.
I already mentioned that BlackRock is MSCI’s most important client in terms of revenue. BlackRock is the largest asset management firm in the world and its ETF business is closely tied to MSCI’s Index segment. In FY2021, it accounted for 20.4% of the Index segment’s operating revenues, respectively. The partnership between BlackRock and MSCI will offer a strong position for MSCI to benefit from growth in the global ETF market. Moreover, many investors consider indices such as MSCI World, MSCI Emerging Markets, and MSCI ACWI as the key benchmarks. It is critical for fund managers to benchmark their portfolios and I don’t think it is likely that they will switch to a competitor once they have chosen a certain MSCI index.
The ESG & Climate segment also boasts competitive advantages. First of all, MSCI has built a lot of knowledge about ESG as it was the first to offer ESG services. This first mover advantage has resulted in a growing global coverage and data base which are hard to compete with. Regarding ESG ratings and data, all of the 50 asset managers in the world use MSCI ESG Research Products. It currently covers 16,650+ issuers and 791,500+ securities. MSCI’s climate data is used by 46 of the top 50 asset managers in the world, it currently covers 1000+ climate change metrics and 11,000+ issuers.
Best-in-class financials
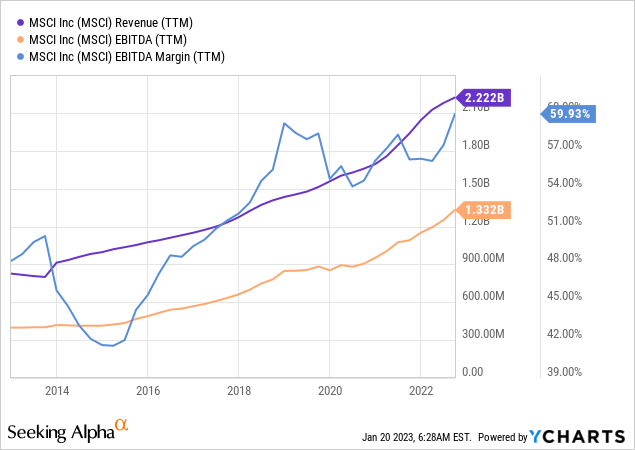
MSCI’s financial track record over the past ten years is truly impressive. Between FY2012 and FY2021, revenue has grown with a 10.6% CAGR. EBITDA has grown with a 12.7% CAGR driven by margin expansion. The EBITDA margin of nearly 60% is among the highest of large cap financial companies. Top-line growth is very reliable as 97% of total revenue is recurring (subscription-based or asset-based fees).
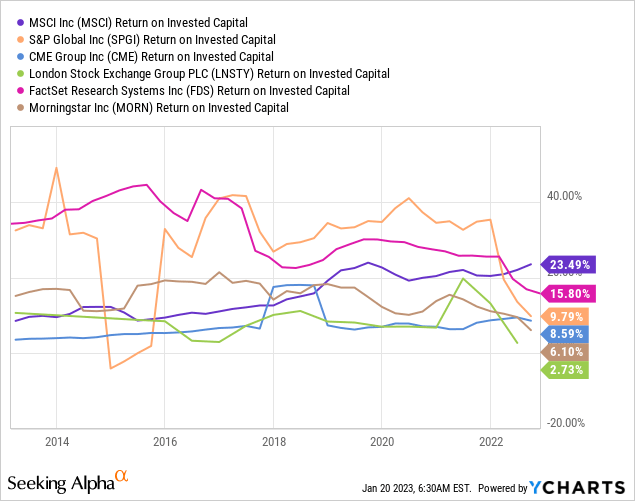
MSCI also drives great returns on invested capital. In the following graph, I plotted the ROIC of MSCI and other companies that compete with MSCI in one or more business segments. MSCI has not always had the highest ROIC, but I think investors should really appreciate the consistency over the past ten years. Especially in 2022, ROIC has increased slightly for MSCI while its peers are showing less resilience.
The balance sheet is manageable but not great
While there is a lot to like about MSCI, I have some concerns about the balance sheet. Personally, I like companies with low leverage (preferably < 1.0) as it gives them more financial flexibility. The following table includes the net debt position and net leverage for MSCI since 2017.
|
2017 |
2018 |
2019 |
2020 |
2021 |
2022 9M |
|
|
Cash & Cash equivalents ($ billion) |
$0.9 |
$0.9 |
$1.5 |
$1.3 |
$1.4 |
$0.9 |
|
Short-term & current debt ($ billion) |
– |
– |
– |
– |
– |
– |
|
Long-term debt ($ billion) |
$2.1 |
$2.6 |
$3.1 |
$3.4 |
$4.2 |
$4.5 |
|
Net debt ($ billion) |
$1.2 |
$1.7 |
$1.6 |
$2.1 |
$2.8 |
$3.6 |
|
EBITDA ($ billion) |
$0.7 |
$0.8 |
$0.9 |
$1.0 |
$1.2 |
$1.3 |
|
Net leverage |
1.7x |
2.1x |
1.8x |
2.1x |
2.3x |
2.8x |
Source: Seeking Alpha
Leverage has been trending around 2.0x. A bit too high for my personal preference, but still manageable given the predictable cash flows. In 2022, we saw a significant increase as net leverage was 2.8x at the end of Q3 FY2022. The question is: why?
Well, the answer can be found in the next graph. I plotted free cash flow versus capital returned to shareholders since 2017. Capital returned to shareholders includes share buybacks as well as dividends. It can be seen that in FY2018, FY2020, and the first nine months of FY2022 capital returned to shareholders exceeded free cash flow. This is mainly due to opportunistic share repurchases and it explains the increase in net debt over the years. Again, this is not a big problem as cash flows are growing rapidly, but I would prefer management to be a bit less aggressive.
Free cash flow versus capital returned for MSCI (MSCI Investor Relations; Author)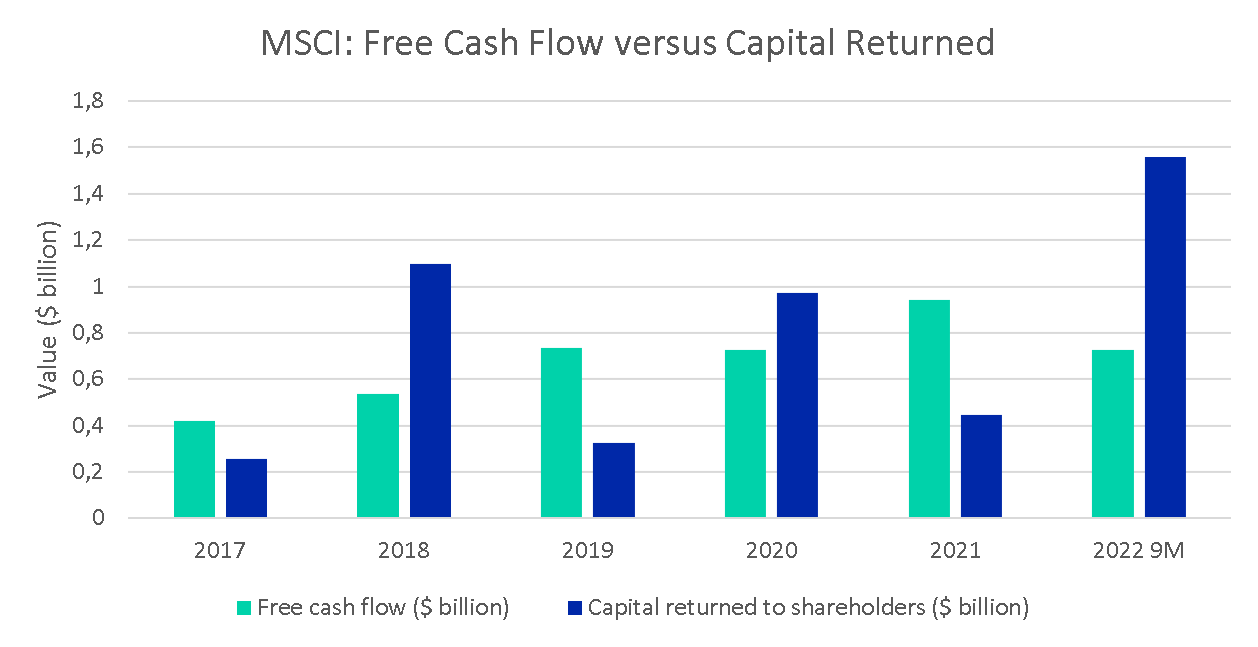
Growth outlook
The most recent investor presentation shows some long-term targets for revenue growth, EBITDA growth, and EBITDA margin (see figure below).
Revenue is expected to grow with low double-digits, mainly driven by the Index and ESG & Climate segments. The revenue growth rates per segment are comparable with performance over recent years, and I think that these are realistic considering the strong competitive position of MSCI. Management also estimates that the EBITDA margin will further expand driven by slower than revenue growing EBITDA expenses. The EBITDA margin was 58.6% in FY2021 which is already at the upper end of long-term guidance. If the company is able to control expenses, it is definitely possible that margins will keep expanding at a steady pace over the coming years.
MSCI Long-term Targets (MSCI Investor Relations)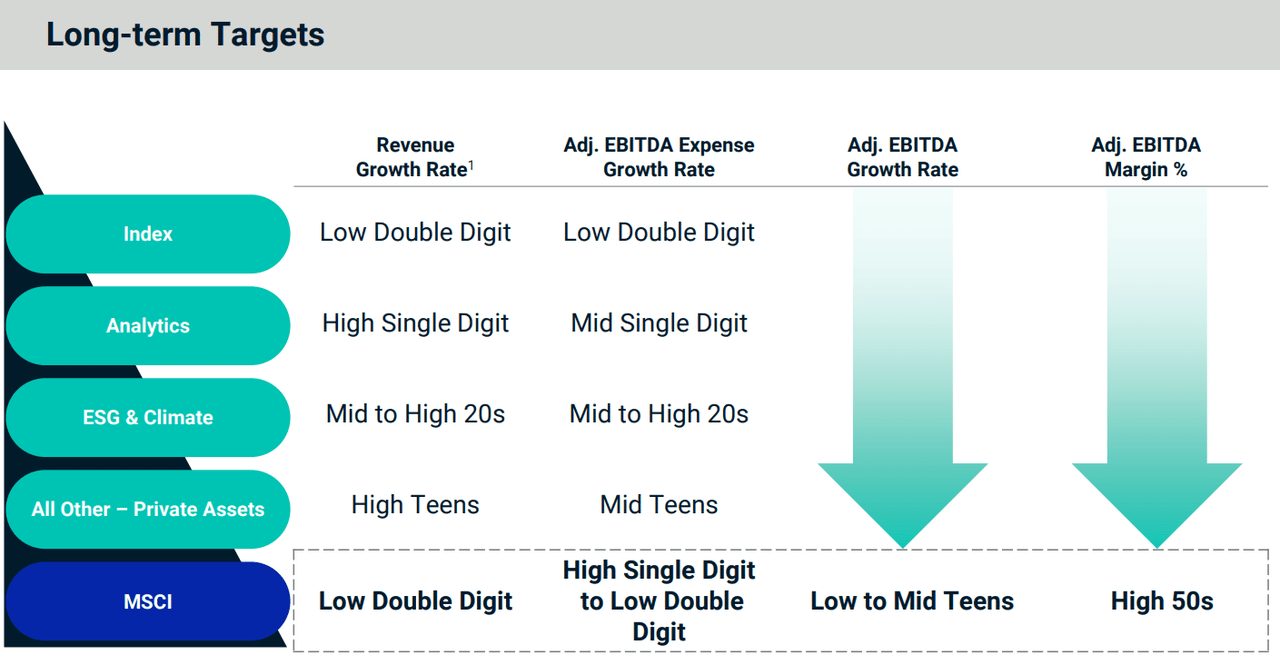
Sky-high valuations
It is safe to say the MSCI is a great company with a long growth runway ahead. The key is to buy such companies at or below fair value.
An often used method to calculate the fair value of a company is the discounted cash flow analysis. I will use this method to calculate the intrinsic value of MSCI. The following figure shows my key assumptions.
DCF inputs (Seeking Alpha; Author)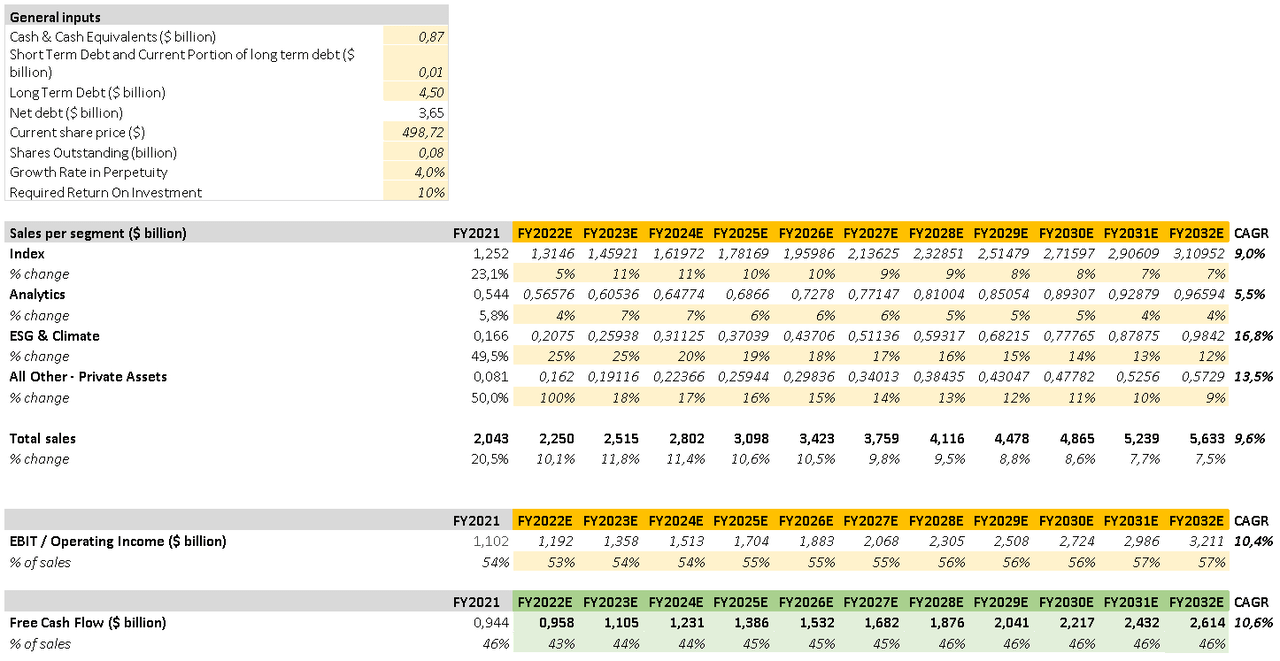
For the historical and current financial data I used Seeking Alpha. Note that I include the $3.65 billion net debt position in my calculation. The projected revenue per segment for FY2022 is in-line with reported revenue over the first nine months of 2022. After FY2022, I assume growth rates per segment which are in-line with the long-term growth outlook, gradually decreasing as the company grows more and more mature. Moreover, I assume a gradually increasing EBIT margin.
The income tax expense, D&A, capital expenditures, and change in working capital are excluded from the figure, but I made historically conservative assumptions for all them. Next, I calculated the free cash flow for every fiscal year by using the formula shown on this page. The resulting projected free cash flows are shown in the green cells.
The output is a table with the fair value per share for different combinations between the required rate of return and perpetuity growth rate. At the current share price ($495.79), MSCI stock is overpriced for most scenarios. For me it only makes sense to buy individual companies if they have the potential to outperform the index. My personal required rate of return is therefore 10% or higher. Assuming a required rate of return of 10% and perpetuity growth rate of 4%, I would be interested to buy MSCI around $314.00 per share. This implies that for me MSCI stock is currently around 37% overvalued.
DCF outputs (Author)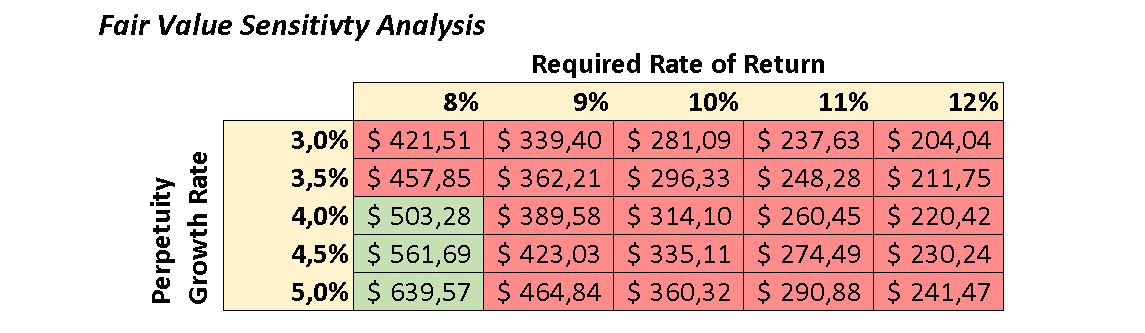
Final thoughts
We can all agree that MSCI is a great business. MSCI is well positioned to benefit from the ongoing shift to passive investments and momentum in ESG investing. Especially the Index and ESG & Climate segments have significant competitive advantages through intangible assets. Top-line growth, margins, return on invested capital – MSCI’s performance is simply outstanding. I personally do not like the debt position, but they can manage due to the rapidly growing cash flows.
The thing is that MSCI stock is just too expensive. I agree that great businesses deserve a premium, but I am looking for stocks that have potential to outperform the overall market. An expected annual return of 7% to 8% is too low for me as I could also buy an index fund for similar returns. Given the extreme overvaluation, I have no other option but to rate MSCI a ‘Sell’. I do recommend to keep this one on your watchlist, but for now investors should avoid MSCI.
Be the first to comment