

David Gyung
If this is your first time reading a Hunting Alpha article using Technical Analysis, you may want to read this post, which explains how and why I read the charts the way I do, utilizing principles of Flow, Location and Trap.
Introduction
A lot of investment and trading ideas can be generated by asking ourselves short questions such as:
Do I think the difference between long term interest rates and short term interest rates will expand, contract or stay around the same?
Such questions help us build mental models and playbooks in our mind for us to efficiently filter out the noise in our world and hone in on the essence of good investment or trading ideas. There is a certain elegant simplicity in that the best ideas really hone down to just one to three core drivers.
For instance, my answer to the question above is “contract further”. And based on that, I believe mortgage REITs (mREITs) are likely due for a decline and underperformance vs the S&P 500 (SPY). And therefore, it is:
Time to Sell MORT
The VanEck Vectors Mortgage REIT Income ETF (NYSEARCA:MORT) tracks the US mREIT sector.
Read of Relative Money Flow
MORT vs SPX500 Technical Analysis (TradingView, Author’s Analysis)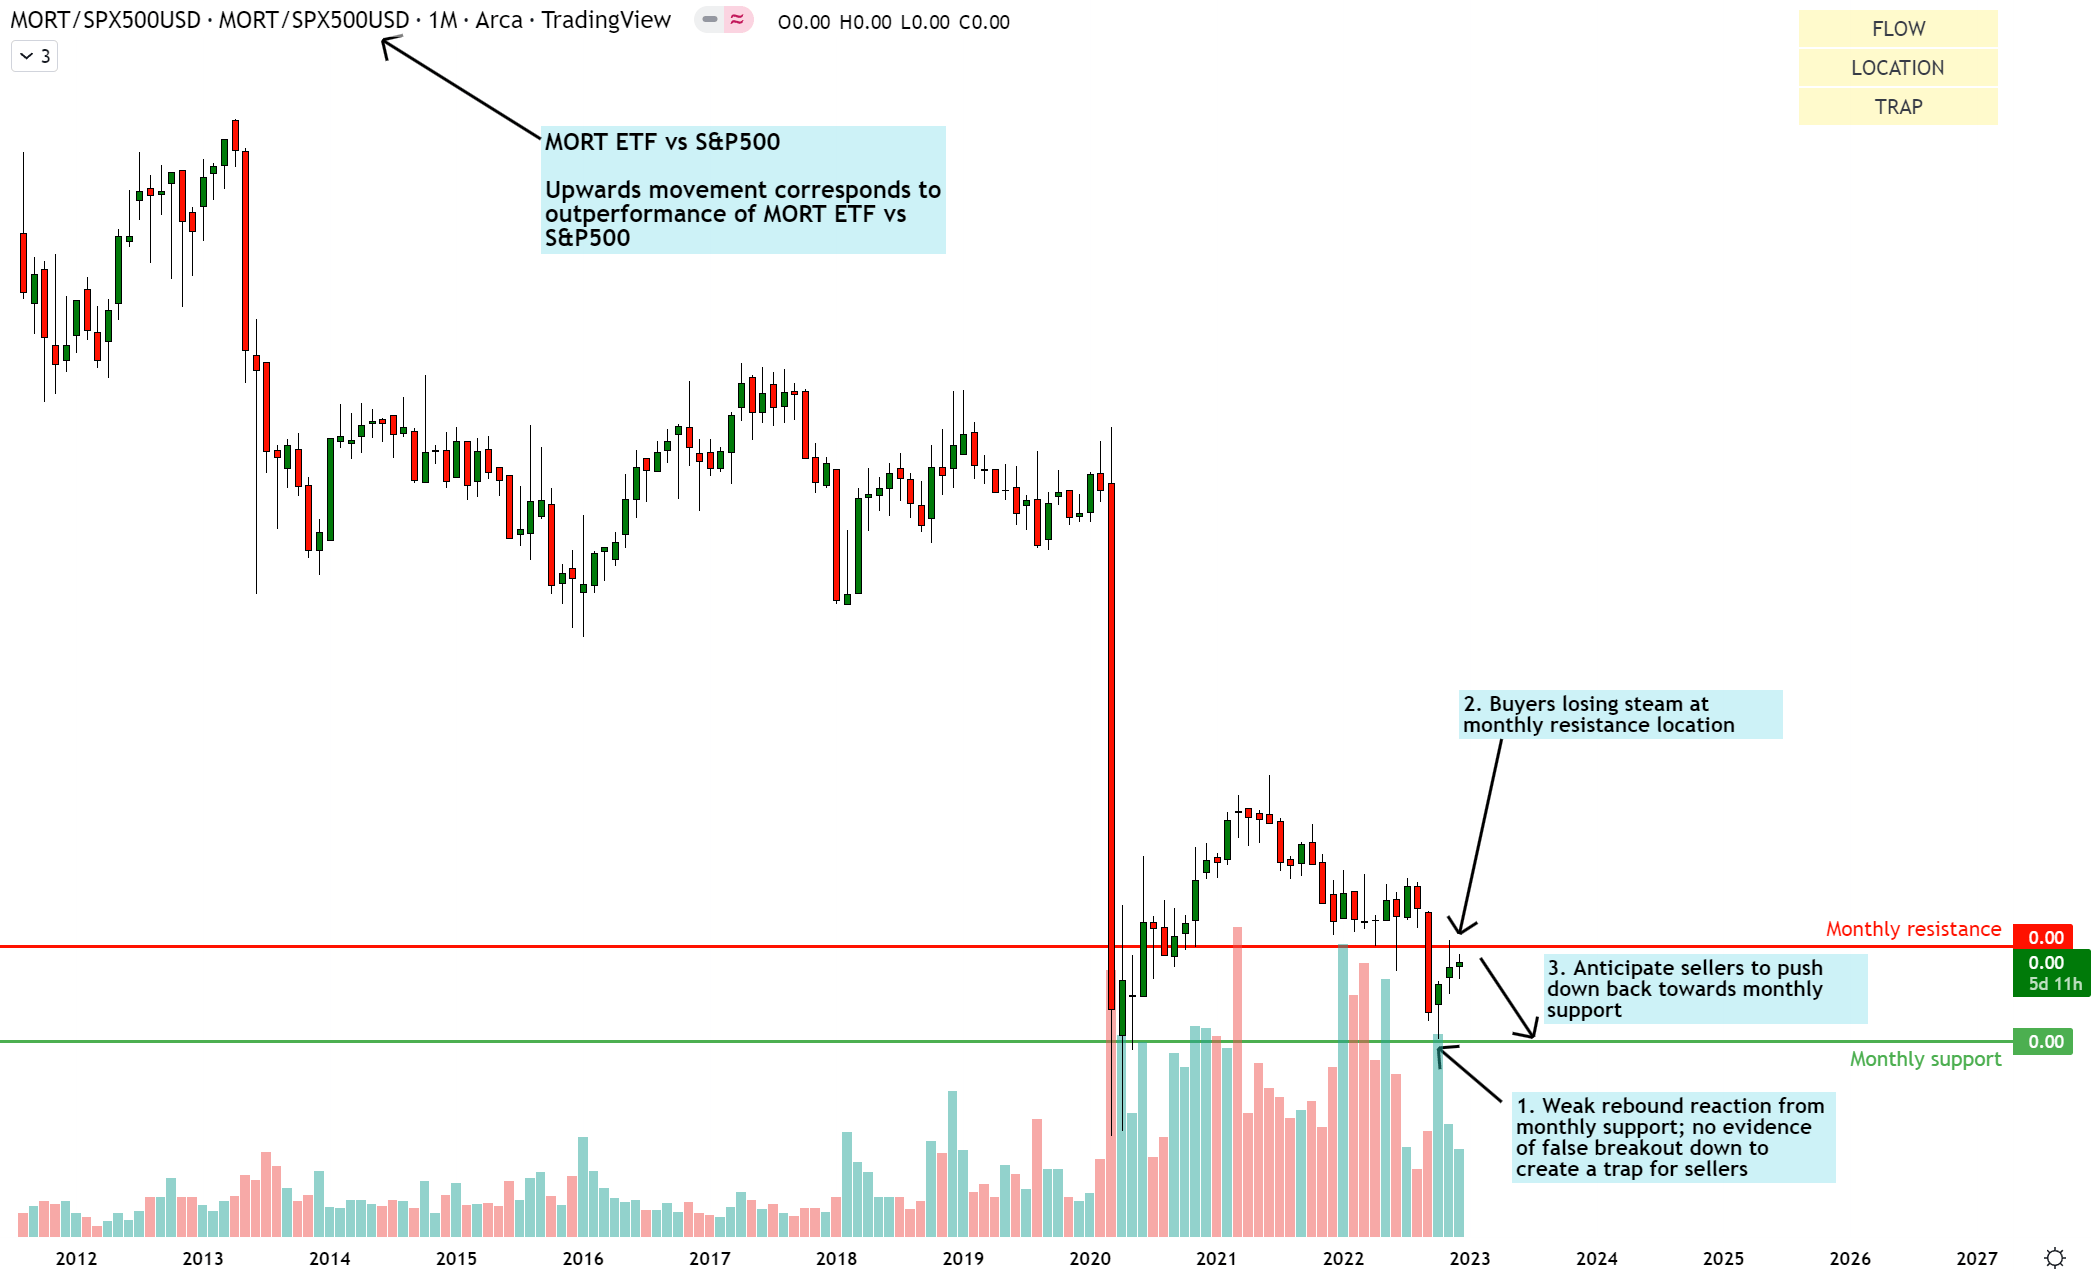
An upward movement on the relative chart of MORT/SPX500 means MORT is outperforming the S&P500. Conversely, a downward movement means the DBC is underperforming the S&P 500.
Currently, MORT/SPX500 is in a downward flow. Buyers have attempted to stage a rebound over the past 3 months, however there is no sign of any trap such as a false breakout to the downside. This suggests to me that the final low before the next bull run has not been printed yet.
As buyers lose steam near the monthly resistance, I anticipate sellers to return and push down back towards the monthly support location.
Read of Absolute Money Flow
MORT Technical Analysis (TradingView, Author’s Analysis)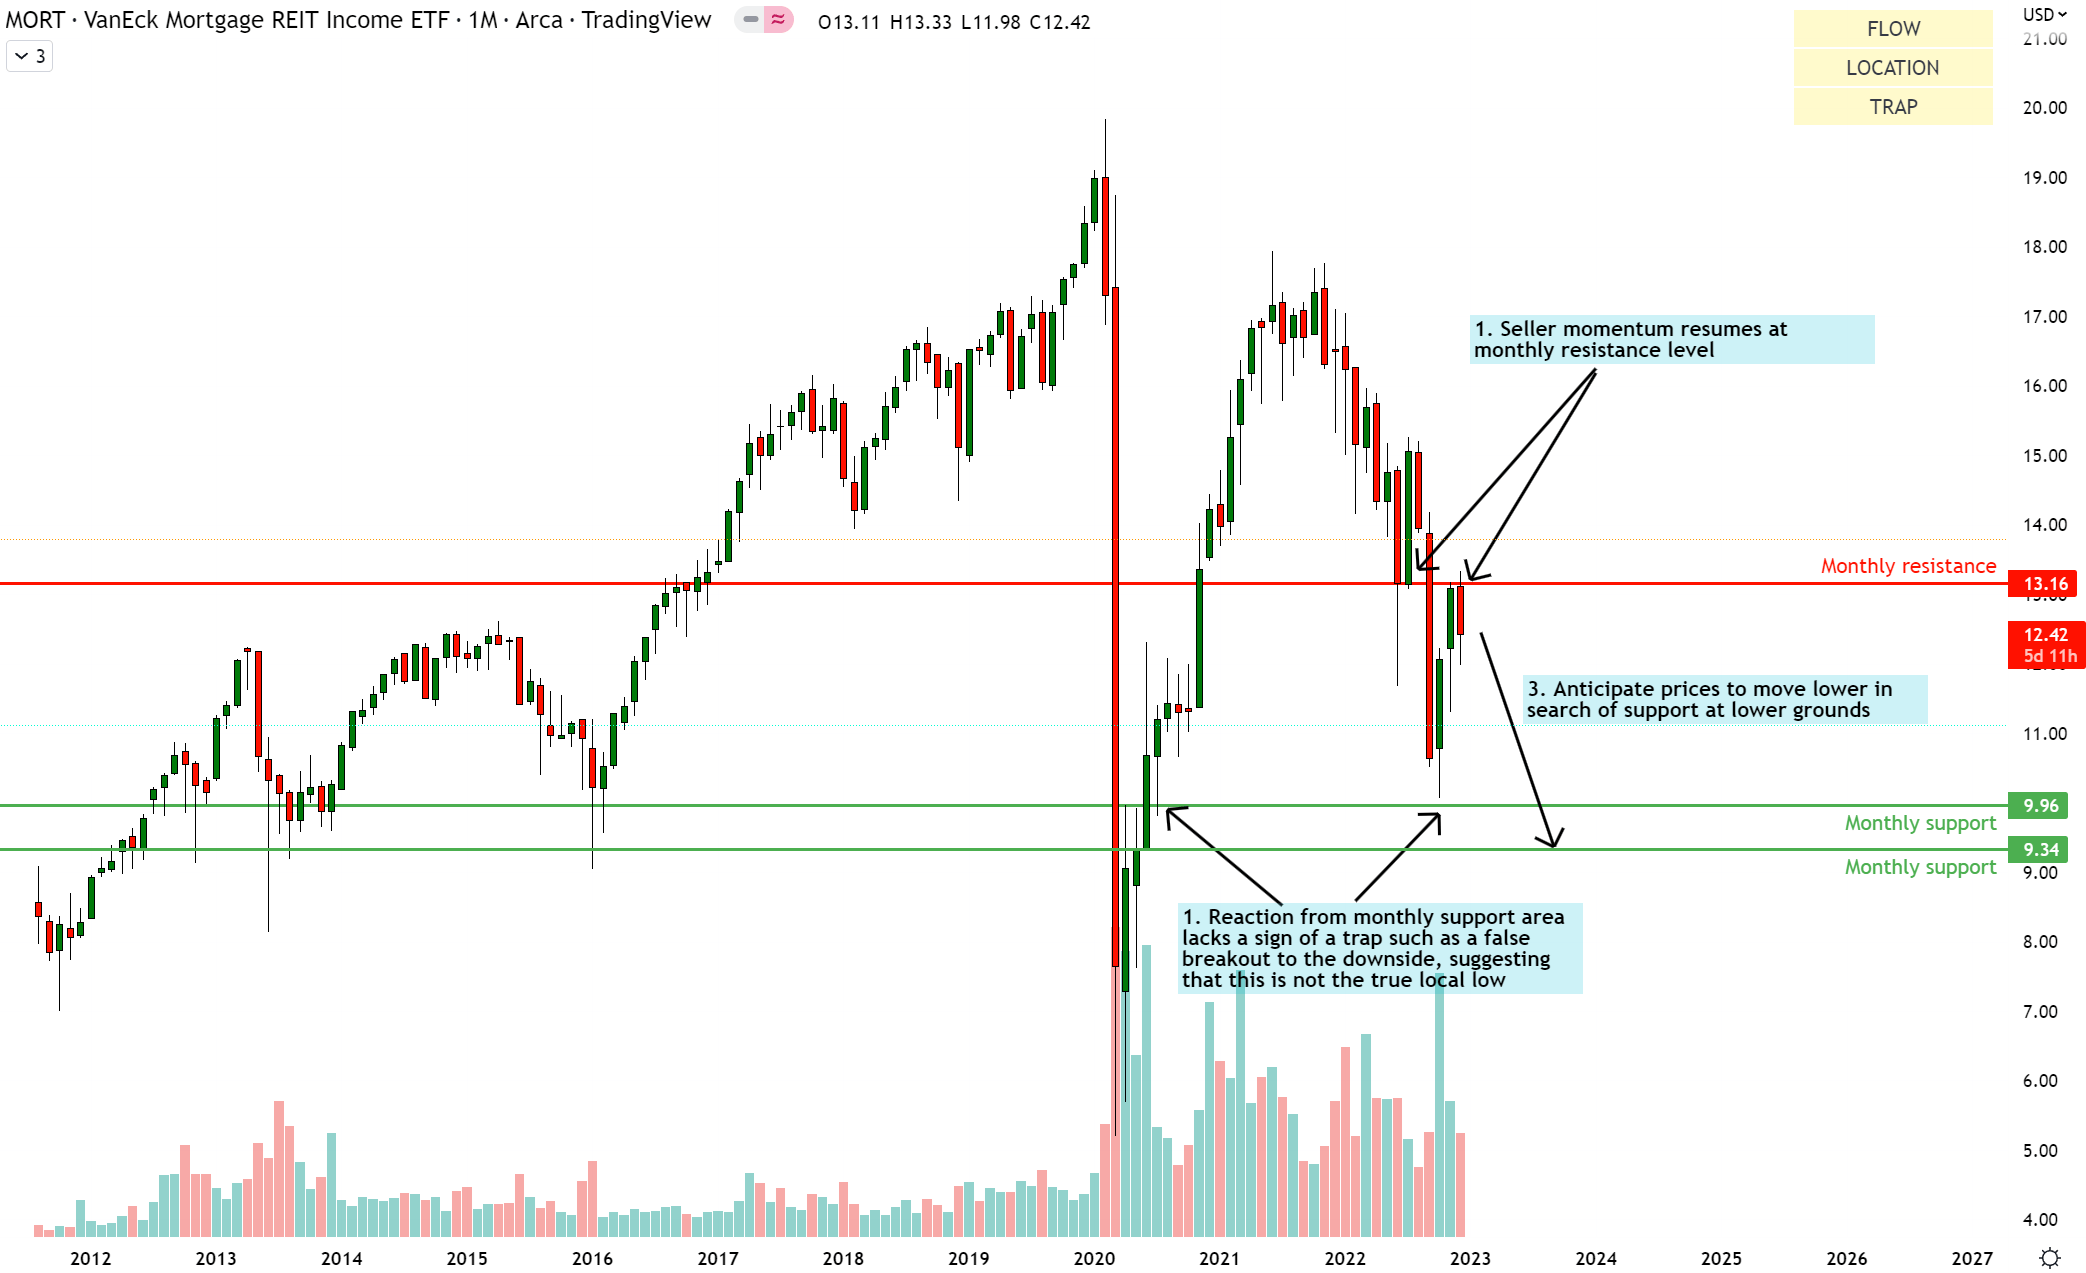
Similar to the relative chart, buyers have made an attempt at the $9.96 monthly support. However, I don’t believe this reaction has trapped any players on the wrong side. Hence, I think the local low for the current downtrend lies further down. I believe the sellers at the monthly resistance of $13.16 are likely to push down back towards the monthly supports at $9.96 or perhaps lower at $9.34.
MORT ETF Composition
MORT is a concentrated ETF of mREITs:
MORT ETF Top 5 Holdings (MORT ETF Website, Author’s Analysis)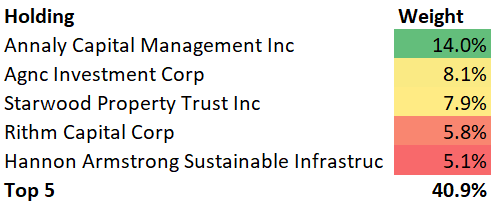
Annaly (NLY) makes up 14% of the overall index as the top holding. It is the largest mREIT player in the US. AGNC (AGNC), Starwood Property Trust (STWD), Rithm (RITM) and Hannon Armstrong Sustainable Infrastructure Capital (HASI) are other members of the top 5 holdings. Altogether, almost 41% of the overall index is made up of these components.
Key Fundamental Drivers for MORT
Generally, if you invest in mREITs, you are buying a long term asset’s interest income streams from the underlying mortgage holders and financing that with interest expense from short term debt. Thus, your return profile is determined by the long term interest rates that accrue to you and the short-term interest rates that you have to pay your lenders.
In even simpler terms, you make money on the spread between long-term and short-term interest rates. A good barometer of this is the difference between the US 10yr yield and the US 2yr yield, which is also called a credit spread:
US 10yr Yield – US 2yr Yield (TradingView, Author’s Analysis)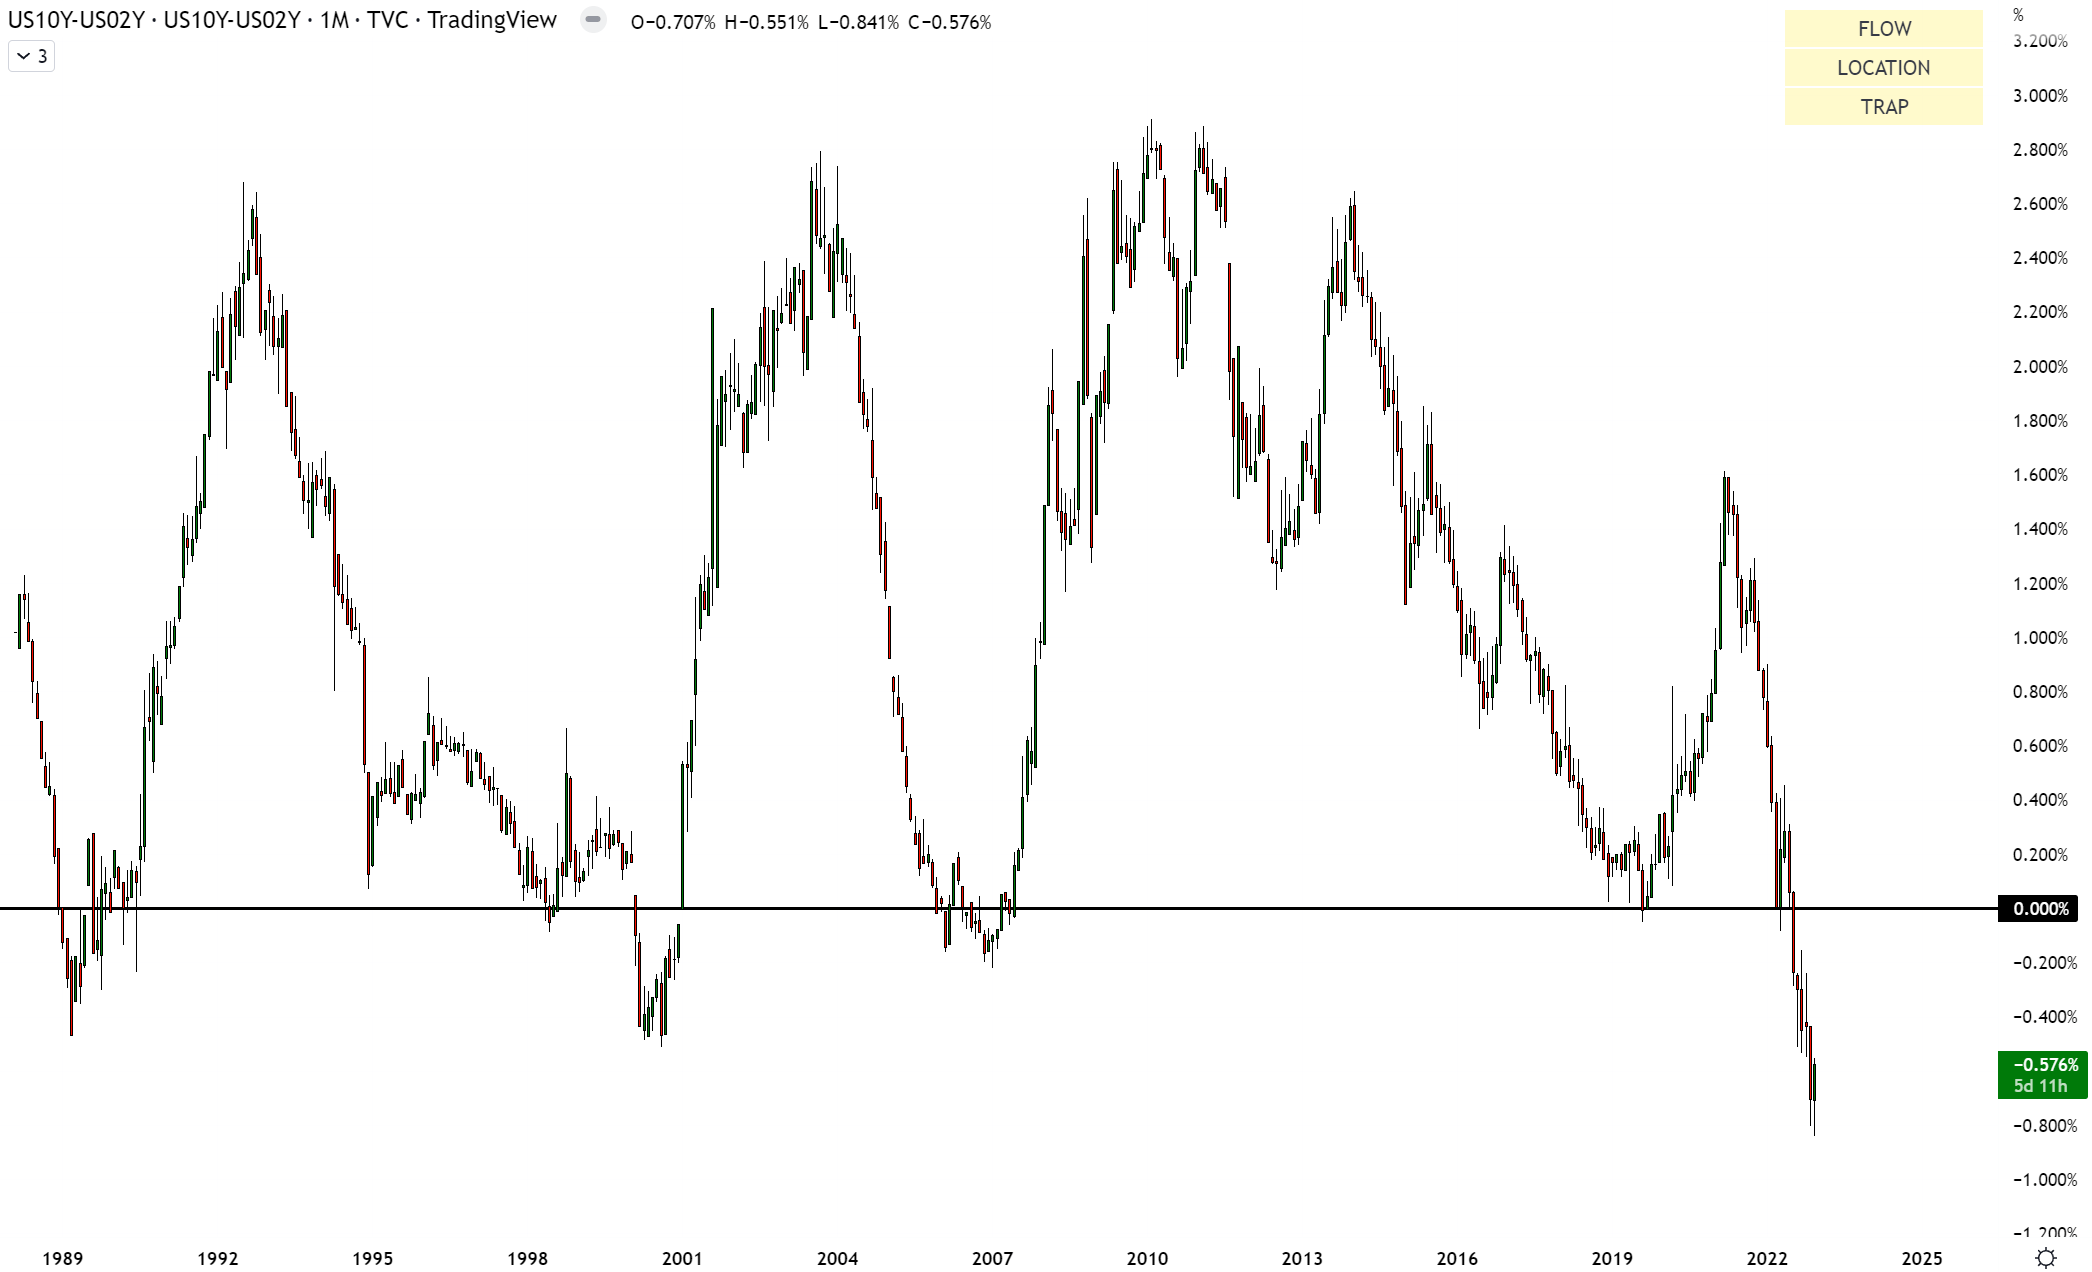
Some people may notice that the spread in the above chart is negative, correctly label this as inversion in the yield curve and based upon this, make an argument for bearishness in MORT.
However, I differ in this approach. According to how I view it, it does not matter so much at what point in the yield curve we are. The only thing that matters is whether incrementally, this spread is going up, down or sideways.
If the long-term credit yield – short term credit yield spread goes up, then mREIT investors make incrementally more money on their longer-term assets compared to what they have to pay in their shorter-term liabilities. Hence, this benefits mREIT holders.
The converse applies if the long-term credit yield – short term credit yield spread goes down. In this case, this is bad news for mREIT holders.
So then the question is, is the spread going up or down or sideways? I believe we can use ideas behind technical analysis, and hence the wisdom of the crowds to determine a bias:
US 10yr Yield – US 2yr Yield Outlook (TradingView, Author’s Analysis)
Downwards trends such as the one below doesn’t just reverse suddenly in the absence of a high-volatility trap. Typically, some sideways consolidation and rollover is required. Thus, I believe the spread is likely to halt its march up at the monthly resistance and move back down towards the monthly support.
This implies a bearish outlook on the underlying fundamental drivers of the mREITs industry and hence MORT. Note, however, that there may still be some room for upward movement as the credit spread has not yet hit monthly resistance. For this reason, I believe MORT is a sell, but not a short; that is too dangerous currently.
Summary
All the key signs point towards bearishness on MORT; technical analysis of its charts and of the credit spreads. Due to the credit spread potentially having some more room up before it hits the monthly resistance, I have a cautionary ‘sell’ view on MORT but not anything more like a short. That is too dangerous currently.
That said, I do see short opportunities in some components of the MORT ETF, such as PennyMac Mortgage Investment Trust (PMT). I have written my take on the PMT mREIT here.
Be the first to comment