NicoElNino
Dear clients and fellow shareholders:
The S&P 500’s almost 20% decline last year was the stock market’s third worst year since 1937 and the largest annual drop since the Great Recession decline in 2008 (-38.5%.)
While we are never pleased with losses, our focus on valuation helped us sidestep much of the market’s 2022 decline. Our stock portfolio declined approximately 7% last year, buoyed by our positions in healthcare (McKesson (MCK), Cigna (CI), AbbVie (ABV), DaVita (DVA) and CVS) and homebuilder Green Brick Partners (GRBK). (Your actual equity portfolio return may differ because of legacy positions or cash flows in/out of your portfolio.)
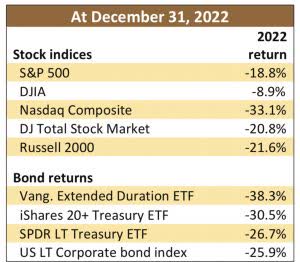
For many investors, the year’s most surprising shock was that the supposed safe assets in their portfolio – the bonds – weren’t as safe as they assumed or had been led to believe. Until recently, the question of whether bonds are a ‘safe investment’ was rarely asked.
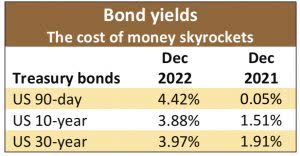
Bonds are contractual obligations for a stream of interest payments. When that cash flow stream is near zero (that is, interest rates are near zero), bonds can be just as overpriced as highly speculative equities. Even bonds with minimal default risk still carry interest rate and inflation risk, despite not having experienced the downside of those risks in decades. Now that investors expect higher yields, the only way to convince them to purchase existing, lower interest rate bonds is to reduce the price on those bonds – and in many cases dramatically.
In an extreme example, 100-year maturity Austrian bonds issued at par only two years ago currently trade for ten cents on the dollar. The bonds carry essentially no knowable default risk but have suffered a 90% price drop in 20 months.
In the U.S., the market price of a 30-year U.S. Treasury bond declined 33% in 2022. Even the presumed “safe” benchmark 10-year Treasury bond suffered a 16% price decline last year, its worst yearly decline ever.
It turns out that when bonds are behaving in ways never witnessed in recorded history, investors should pay attention.
It is possible, of course, that this massive jump in rates is temporary – you know, transitory.
But there is always some possibility that 2021 marked a shift in the long-term trend, even if we may have already experienced the worst of this inflationary cycle. If so, there are a lot of assumptions about cheap money that people have used over the past 40 years that simply will no longer hold true.
We have never subscribed to the permanent zero percent rates or QE infinity schools of monetary policy, although we expected higher rates and inflation much sooner than actually occurred. The price of money is set by interest rates, the artificial suppression of which creates all types of malinvestment.
When capital costs are essentially zero, risk-free returns become too low, enticing investors to pursue things that are increasingly speculative. A zero interest rate policy is a major reason that presumably sophisticated investors poured money into black holes such as Sam Bankman-Fried’s FTX and a host of other newfangled gambling products that serve little purpose other than to offer people an opportunity to expose their poor decision-making skills.
Regardless of interest rates or the stupid investment de jour, we try very hard not to own companies selling at prices in excess of the values of the underlying businesses. These are the stocks most vulnerable to sharp price declines when overall market valuations contract.
The risk of ignoring valuation was evidenced by the 2022 returns of the overall S&P 500 index and of many large components of the index. Huge price declines in a number of stocks were completely disjointed from the companies’ earnings – not because earnings suddenly don’t matter, but because if you overpay for a dollar’s worth of earnings, you expose yourself to potential capital losses – sometimes substantial – when prices eventually correct.
And while the timing is impossible to predict, prices always correct.
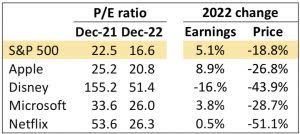
In December 2021, the S&P 500 traded at a P/E of 22.5 times earnings, more than a full standard deviation in excess of the 25-year average P/E of 16.8. Approximately two-thirds of the time, the index has traded at a P/E between 13.5 and 20. In the two instances in the past quarter century when the market P/E multiple exceeded its long-term average by more than one standard deviation, significant market corrections ensued. (See A and B in the chart below.)
In the two periods when the market’s P/E fell more than one standard deviation below its 25-year average, significant market gains followed. (See C.)
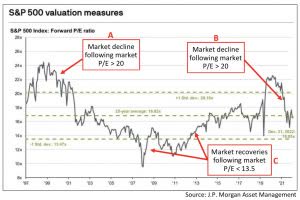
Currently the S&P 500 is trading at 16.6 times its expected 2023 earnings, its average P/E over the past 25, 50 and 100 years.
From this average valuation level, the historical average one and five-year subsequent S&P 500 return has been approximately 10%. We certainly aren’t predicting a 10% return in 2023, but history tells us that optimism is more justified at this valuation level than when stocks are trading at twice their current P/Es.
Of course, history also tells us that markets usually overreact, vacillating between being overpriced and underpriced, seldom stopping at the Goldilocks valuation of 16 times earnings. Investors tend to overshoot these things, both on the upside and the downside.
Inflation leads and lags
Stock investors aren’t the only ones who tend to over and undershoot targets. Central bank officials have a history of doing the same. We aren’t yet ready to congratulate the Federal Reserve for a decisive victory over inflation, but it is likely that the actual inflation picture is better than the current official statistics suggest. We estimate that because of some serious flaws in the calculation of the Consumer Price Index (CPI), actual consumer price increases in the past month or so are very close to a reasonably sustainable level.
Certain items in the CPI calculation, including the cost of shelter, generally lag real market data by many months. Because of this lag, a year ago consumers were experiencing price increases well above the reported government statistics. This same lagging effect has created a situation where the reported inflation figures are higher than most individuals are experiencing at the grocery store, gas station or in the housing market.
Inflation has likely peaked in the short term, even though the official CPI calculation doesn’t yet show it.
Shelter, which accounts for 35% of the CPI, adjusts much more rapidly in the real world than it does in the CPI calculation. According to the Bureau of Labor Statistics, the cost of shelter is continuing to increase each month, even though the most comprehensive measure of home prices (the Case-Shiller Home Price Index) and median rent prices have posted recent month-to-month declines.
Agricultural input prices (such as fertilizer) that typically lead food inflation have also come down significantly, which should help generate downward pressure on reported food inflation in the coming months.
When we adjust the CPI for real-time housing prices and rent, the three-month rolling inflation figure would be closing in on the Fed’s target of 2%, not the most recent year-over-year headline figure of 7.1%.
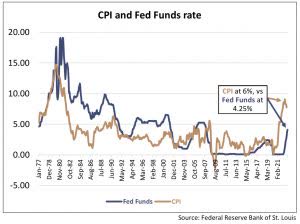
Declaring victory over inflation would be premature. Certain components of inflation, including wages, are inherently sticky, as price increases tend to become embedded based on inflation expectations. And as several pundits have pointed out: once inflation gets above 5%, it has never come down without the Fed Funds rate increasing to a level that exceeds the CPI. Core CPI still registers at 6%, while the Fed Funds rate continues to lag at only 4.25%. Given its desire to ensure that long-term inflation expectations don’t become unanchored, the Fed will not only continue with more rate hikes, but it will likely keep rates higher for longer in an attempt to prove to the American public that it has gotten the job done. That is, the Fed – which was slow and timid in beginning to address inflation – will almost certainly continue to “fight it,” even after having already won the short-term battle.
We will withhold any longer-term predictions about inflation and hope that the Fed doesn’t oversteer (once again) in its effort to tame it.
Housing and those who build it
For portfolio management reasons, we sold our stake in LGI Homes (LGIH) during the fourth quarter (at a loss.) We continue to hold our shares in another homebuilder, Green Brick Partners, a position in which we currently have an unrealized gain.
When we initially purchased LGI Homes in March 2022, the housing market was in the late stages of one of the most robust demand environments that we have seen in more than a decade. Although builders were very clearly overearning – and impending increases in mortgage rates would throttle growth and margins – we determined that the longer-term secular growth story would temper any short-term demand declines.
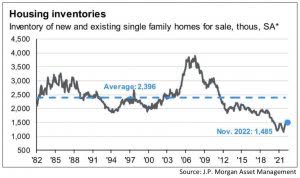
Since the housing collapse of 2008, there have been roughly 12 million new households formed in the U.S., compared to only 8 million newly built single-family homes. Irrespective of higher mortgage rates, there is still an undeniable shortage of housing inventory. On average, there are roughly 2.4 million homes for sale at any given time, a million units more than the current level of approximately 1.4 million houses.
Housing prices have increased about 50% since the beginning of 2019. This, combined with a 3.2 percentage point increase in mortgage rates, has resulted in an average 80% increase in house payment for the same home compared to four years ago.
These affordability strains make the case for investing in homebuilders less clear. Long-term prospects remain promising, but homebuilder balance sheets carry significant investments in raw land inventory, which can become impaired in the event of a material market correction. As we took a basket approach to our housing investment (our current profits in Green Brick roughly offset our losses in LGI), we decided to reduce our exposure to the sector, sell LGI and redeploy proceeds elsewhere.
The recent signs of what may be the early stages of a housing market downturn have many investors calling for a major housing correction on the order of that experienced in 2007. While there may be certain similarities to the last housing crisis as it relates to affordability, there are also some very major differences.
In 2007, the housing market had experienced years of construction in excess of both historical averages and new household formation – the exact opposite of conditions today. There are a host of other differences, as well. Consumers have much better balance sheets today than they did in 2006, with homeowner equity currently at an all-time high. Unlike the last housing bubble, delinquencies remain near all-time lows, so the forced credit sales that compounded the problem in the last bubble should be far less of an issue. Another material difference is the adjustable-rate mortgage (ARM). Towards the end of the last housing boom, ARMs accounted for well above 30% of all mortgages. This created a ticking time bomb as rate increases flowed into higher payments. Today ARMs account for less than 10% of the U.S. mortgage market.
Putting it all together, we think builders are in a much better position to ride out the near-term weakness in the housing market than they were during the previous cycle. At today’s prices, we continue to see opportunity in the homebuilding sector, despite the significant near-term headwinds. We also believe that the current housing correction is likely to be more regional in nature and that Green Brick, which operates largely in business-friendly, pro-growth markets, will significantly outperform its peers.
DaVita
During the fourth quarter, we purchased shares in DaVita (DVA), a dialysis center operator. For those unfamiliar, kidney dialysis involves the critical removal of toxins, fluids and salts from the blood by artificial means. Roughly 500,000 patients receive kidney dialysis in the U.S., which requires a 3.5-hour treatment three times a week. The only alternatives to the treatments are a kidney transplant or potential fatality. Given the critical nature of its services, demand has little correlation with the overall economy, resulting in a highly recession-resistant business.
The U.S. dialysis industry is highly concentrated, with two companies (DaVita and its competitor Fresenius) controlling a combined 80% of the $25 billion market. The dominance of this duopoly provides massive scale advantages, making it incredibly difficult for new entrants to gain profitable market share.
In the past, DaVita’s valuation has been penalized (we view unfairly) because the company generates a significant portion of its operating income from a small percentage of its patients. Of DaVita’s 200,000 patients, approximately 90% qualify for Medicare (or Medicaid), with the remaining 10% covered by a commercial insurance provider. While commercial insurers pay an average of $1,000 per treatment, the federal government’s pay rate for Medicare and Medicaid is only $275 – which is actually less than what it costs DVA to provide the treatment.
While this disparity in treatment costs could ostensibly be viewed as a form of price gouging on the commercial customer base, we tend to view the pricing structure as more of a symbiotic relationship between commercial insurers and the U.S. government. For its part, the federal government provides universal coverage for dialysis regardless of age or financial circumstances. Patients with commercial insurance are covered by their providers for 30 months, after which Medicare becomes the coverage entity. That is, while commercial outfits may initially overpay, after 2.5 years they are no longer responsible for the cost of their clients’ treatment. Importantly, while DaVita runs its business at relatively healthy low-teens operating margins, the independent providers in the industry operate on incredibly thin margins, meaning the higher commercial pay rates provide the critical support necessary for independents to remain in business.
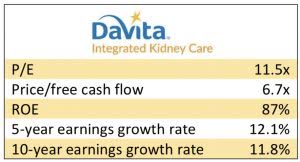
We purchased our stake in DaVita at roughly $72 per share, after the price had dropped from $130 following a reduction in the company’s 2023 earnings guidance. The company’s current EBITDA expectation for 2023 is $2.2 billion, a figure we believe will generate free cash flow of more than $1 billion. At our purchase price, we paid less than 7 times annualized free cash flow, which represents a multiple less than half of DaVita’s historical average.
If we assume no revenue growth, we estimate DVA’s fair value is close to $100 a share, 50% above our purchase price and near where the company was trading as recently as 7 months ago. As a recession-resistant cash generating machine with a free cash flow yield to equity of 14%, we suspect that this valuation may eventually prove conservative. In the wild, more zebras die from starvation than are killed by lions. The herd nature of zebras is an effective defense against predators, but there is little grass for a zebra to eat in the middle of a herd. The strongest, most well-nourished zebras are almost always those willing to stray from the others.
We were reminded of those zebras willing to eschew conventional zebra thinking when Mississippi State football coach Mike Leach passed away last month. Leach was never held hostage to conventional thinking, yet wasn’t a contrarian simply for the sake of being different. He understood the distinction between uncertainty and risk, something that is critical whether one is designing football plays, searching for edible grass or deciding how to allocate investment capital.

We suspect that Leach would have wholeheartedly agreed with Warren Buffett’s advice to be fearful when others are greedy, and greedy when others are fearful. Doing so can be hard, but the highest payoff activities are seldom easy.
Editor’s Note: The summary bullets for this article were chosen by Seeking Alpha editors.


Be the first to comment