

Thomas Barwick
Agribusiness is the industry, enterprises, and field of study of value chains in agriculture and the bioeconomy. According to the United Nations, the global population reached eight billion on November 15, 2022. I was born in 1959 when there were just under three billion inhabitants on our planet.
One of the many results of the exponential population growth over the past 63 years has been the ever-growing demand for nutrition. The demand side of the agricultural sector’s fundamental equation has been growing by leaps and bounds. While technological advances have increased output and improved efficiency, farmers need to produce more food each year to meet the growing demand.
Agribusiness not only feeds the world, but it increasingly fuels the planet as the use of biofuel is soaring. The VanEck Agribusiness ETF (NYSEARCA:MOO) has outperformed the stock market in 2022, which is likely to continue in 2023.
Feeding and fueling the world
Agricultural products feed the world. Meanwhile, grain and oilseed production must increase yearly to keep pace with the growing demand. The war in Europe’s breadbasket caused significant supply concerns as Ukraine became a battlefield and the Black Sea Ports, a crucial logistical hub, a warzone.
While people worldwide depend on corn, soybeans, and wheat for nutrition, they increasingly require more grains and oilseeds as they are primary ingredients in biofuel. Corn is the primary ingredient in U.S. ethanol production, and soybean oil is necessary for biodiesel. Three factors have pushed agricultural product prices higher in 2022:
- Increasing demand– The expanding demand for food and fuel is nothing new, as it is a function of population growth. While technological advances in farming and crop cultivation have increased annual output, the world continues to depend on more nutritional products each year. Moreover, since the weather across the leading growing areas is the primary determinant of prices, Mother Nature continues to play a leading role in supplies. Floods, droughts, and other acts of nature can cause supply shortages. As the demand grows, those shortages can intensify during years when markets move into deficits when the demand exceeds the available supplies.
- War and global bifurcation– In 2022, Russia’s invasion of Ukraine started the first major European conflict since WW II. Moreover, the “no-limits” alliance between China and Russia has caused relations with the U.S. and Europe to deteriorate. The war in Europe’s breadbasket and geopolitical bifurcation threatens supplies, as Russia and Ukraine produce and export significant quantities of wheat, corn, and other agricultural products. Moreover, China is the world’s leading consumer as a function of its population. While the war has turned farmlands into battlefields and logistical hubs into a warzone, the geopolitical tensions create trade barriers that can develop gluts in some regions and shortages in others. War also creates challenges for global supply chains.
- Retaliation– Sanctions on Russia and Russian reprisals have led to higher fertilizer prices and shortages. Fertilizers are critical farming inputs, and Russia is a leading supplier. Farmers are scrambling for supplies and are paying record-high costs. Moreover, Russia is a top fossil fuel-producing country and the most influential non-member of the international oil cartel. Higher oil, gas, and coal prices increase the demand for biofuel, which requires agricultural inputs. While Europe has put a $60 cap on Russian seaborne crude oil exports, Moscow is considering responding with a price floor for its petroleum.
Feeding and fueling the world has become more expensive in 2022.
Grain and agricultural prices have retreated but remain strong
Corn futures traded to the highest price since 2012, reaching $8.27 per bushel in April 2022.
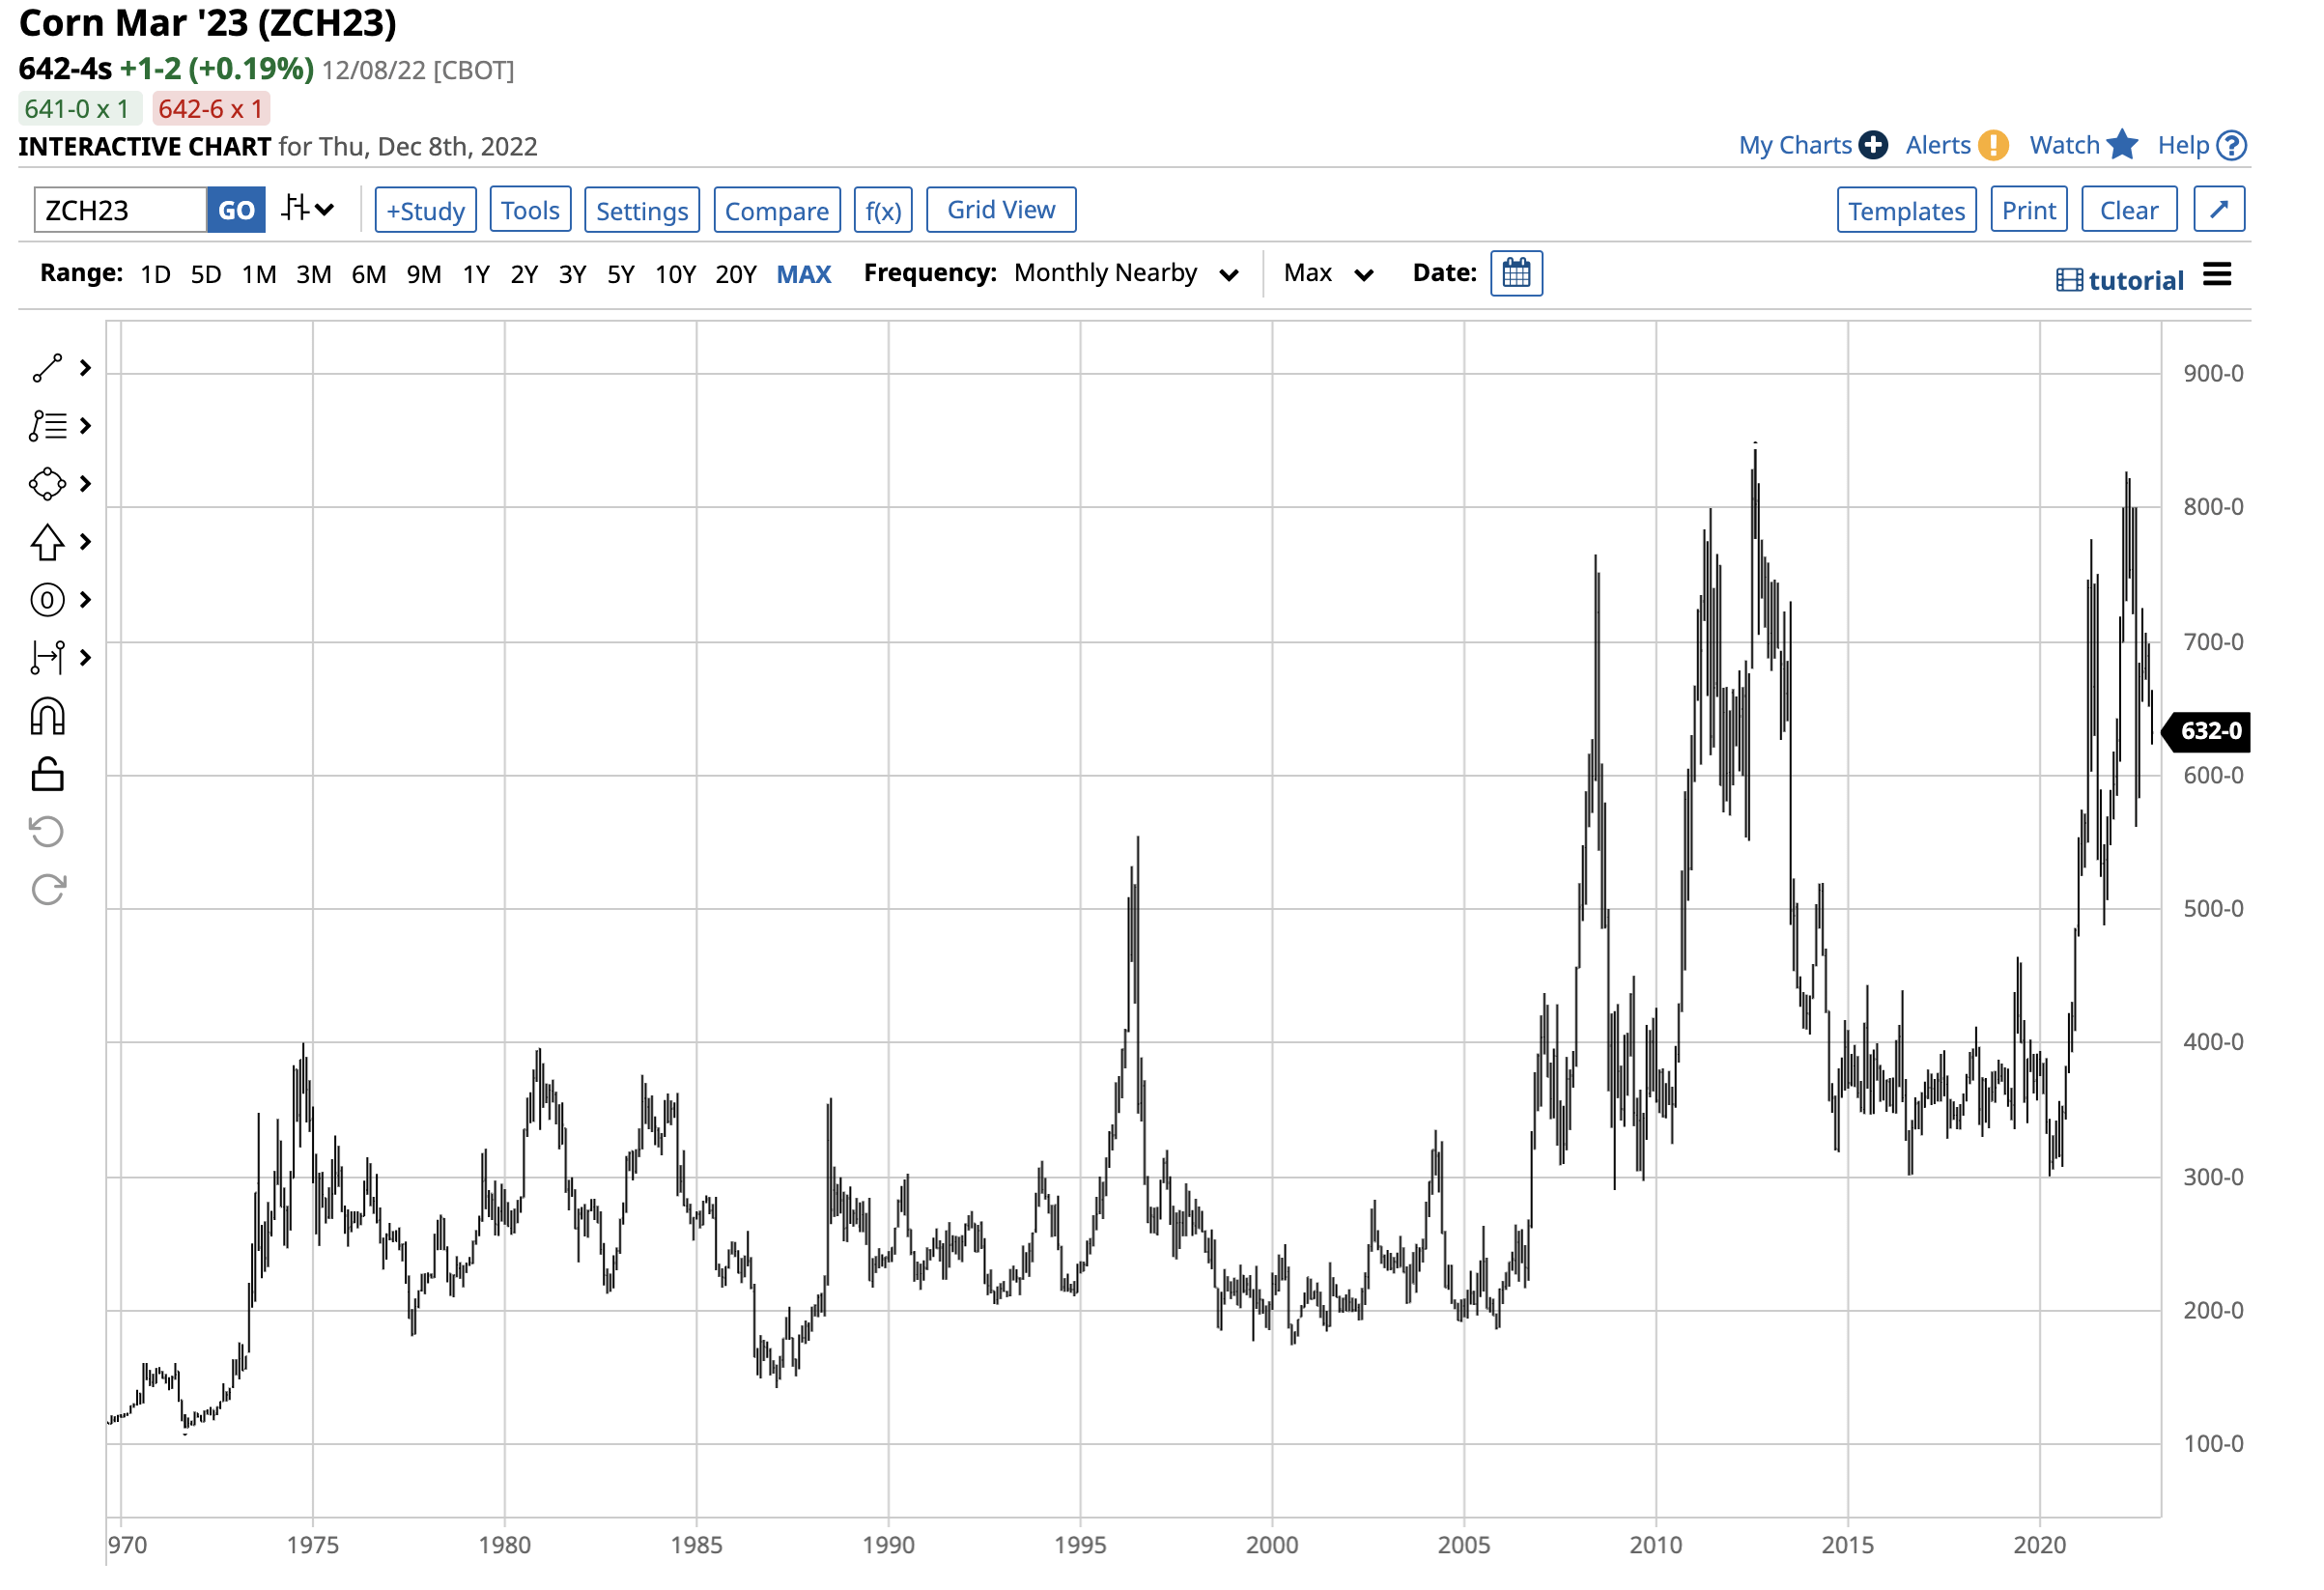
Long-term CBOT Corn Futures Chart (Barchart)
Corn futures peaked at only 16.75 cents below the 2012 all-time $8.4375 high in April. The chart shows the decline to below $6.50 on December 8, but corn remains at its highest price since 2013. Soybean futures rose to $17.84 per bushel in June 2022.
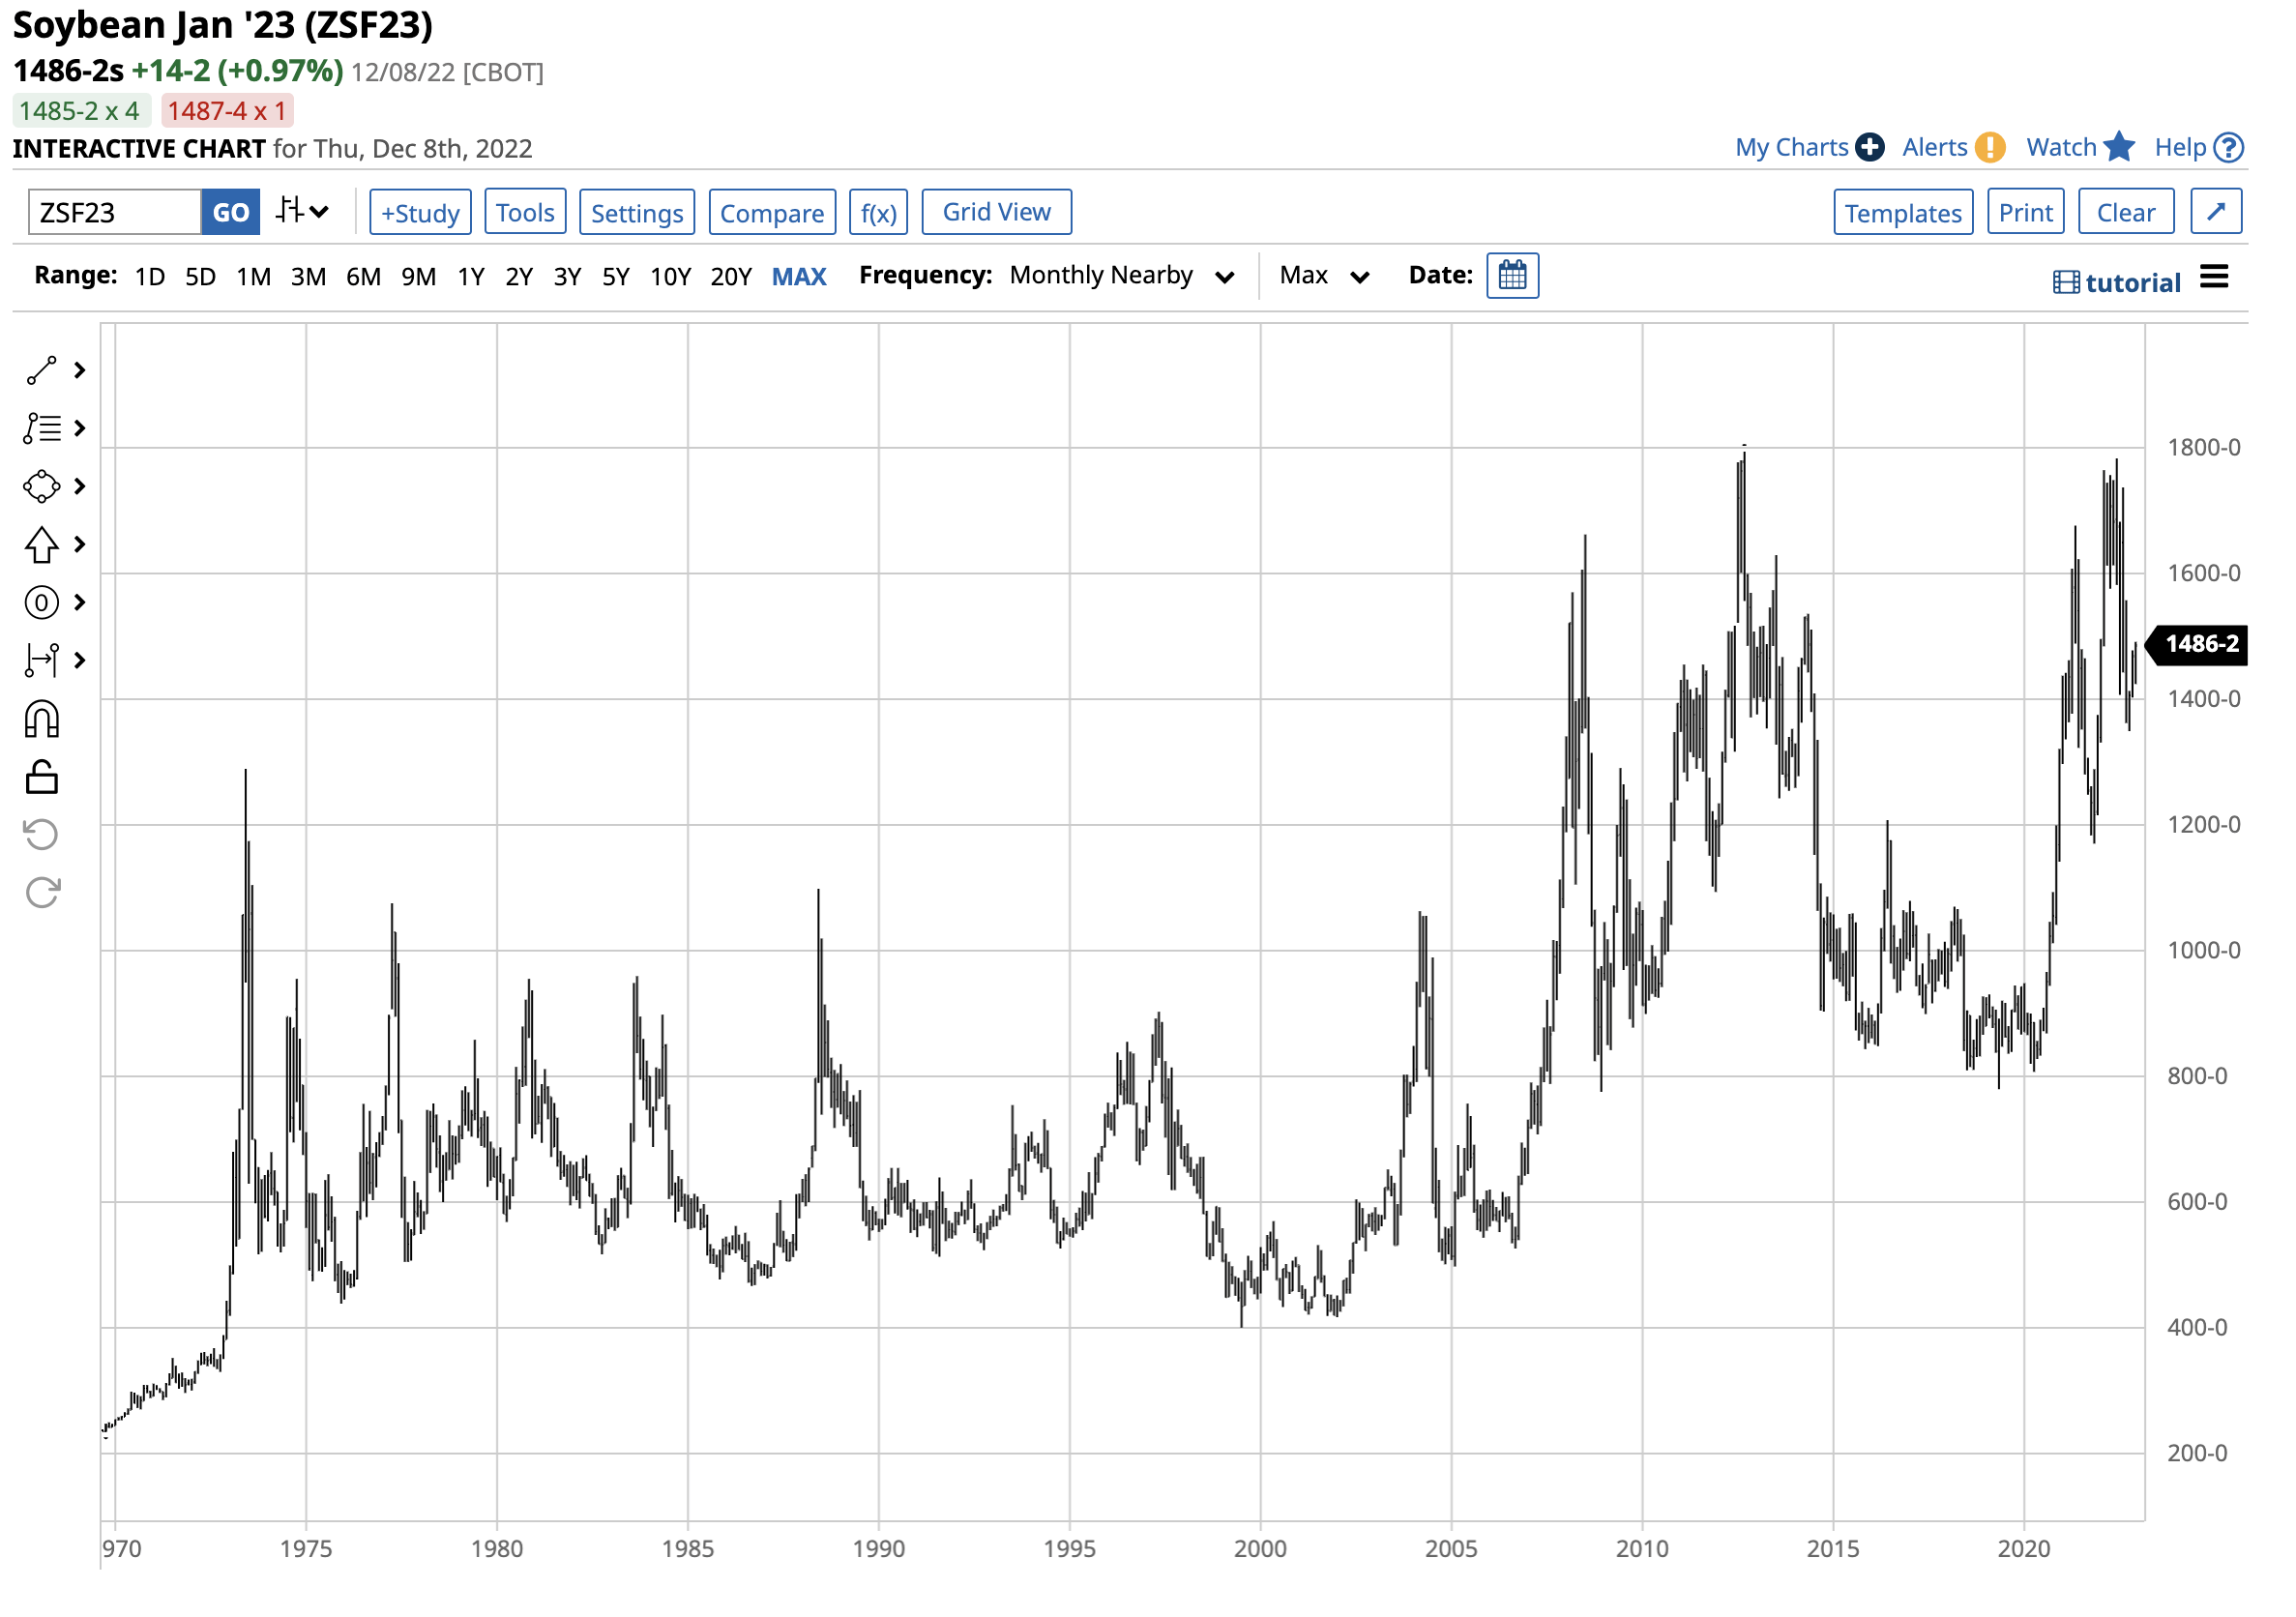
Long-term CBOT Soybean Futures Chart (Barchart)
Nearby CBOT soybean futures stopped only 9.75 cents shy of their 2012 record peak. At $14.8625 per bushel on December 8, soybean futures are at a level not seen since 2014. CBOT soft red winter wheat futures rose to record highs this year.
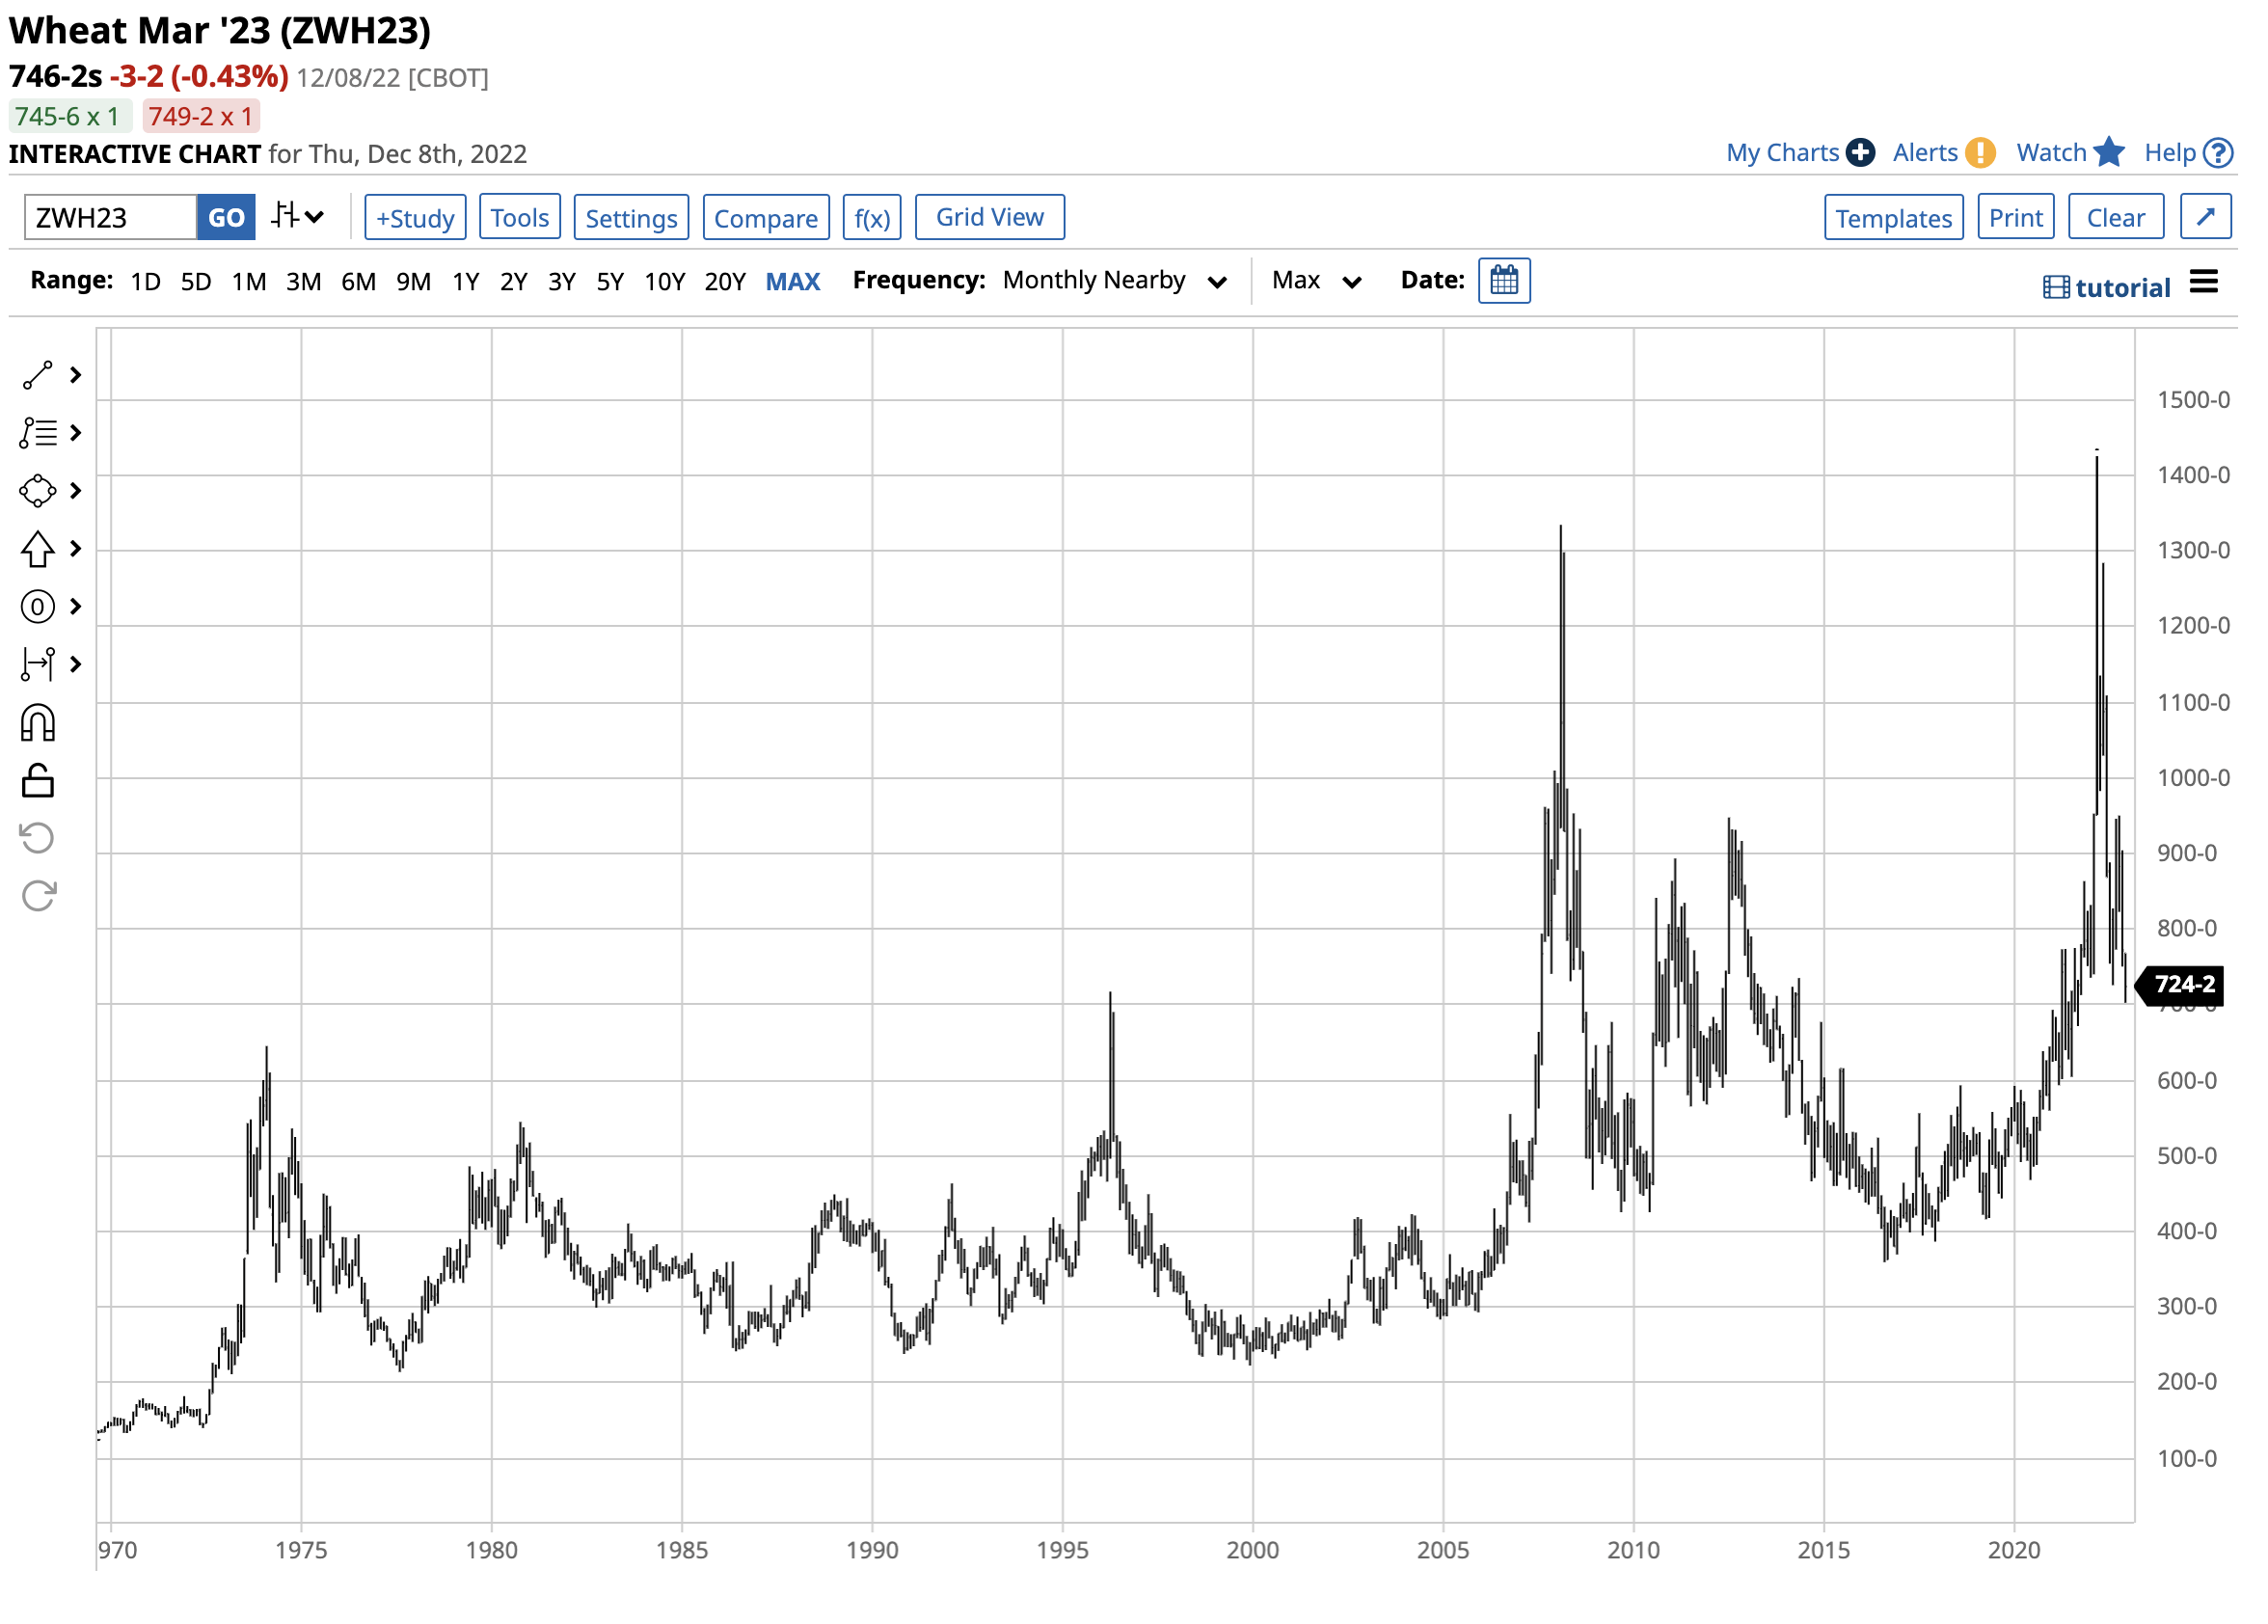
Long-term CBOT Wheat Futures Chart (Barchart)
The chart shows the benchmark wheat futures price eclipsed the 2008 $13.3450 high and traded to $14.2525 in March 2022. At just below the $7.50 per bushel level on December 8, March wheat futures are at the highest price since 2013.
The top grain and oilseed futures markets have declined from the 2022 highs but remain at high prices compared to the past years. The USDA will release its final 2022 World Agricultural Supply and Demand Estimates Report on Friday, December 9. While the monthly WASDE report is the gold standard for agricultural commodity fundamentals, the USDA cannot speculate and forecast trends effectively, given the ongoing war in Ukraine and geopolitical tensions.
Quality and processing spreads send signals
The quality and processing spreads are excellent real-time indicators of agricultural product demand. In the wheat market, the difference between prices for Kansas City hard red winter wheat and CBOT soft red winter wheat is a quality spread that sheds light on consumer sentiment and demand. Many U.S. bread manufacturers price their requirements based on the KCBT wheat contract. When KCBT wheat prices rise relative to CBOT wheat prices, it signifies increased demand and supply concerns that lead to more hedging activity.
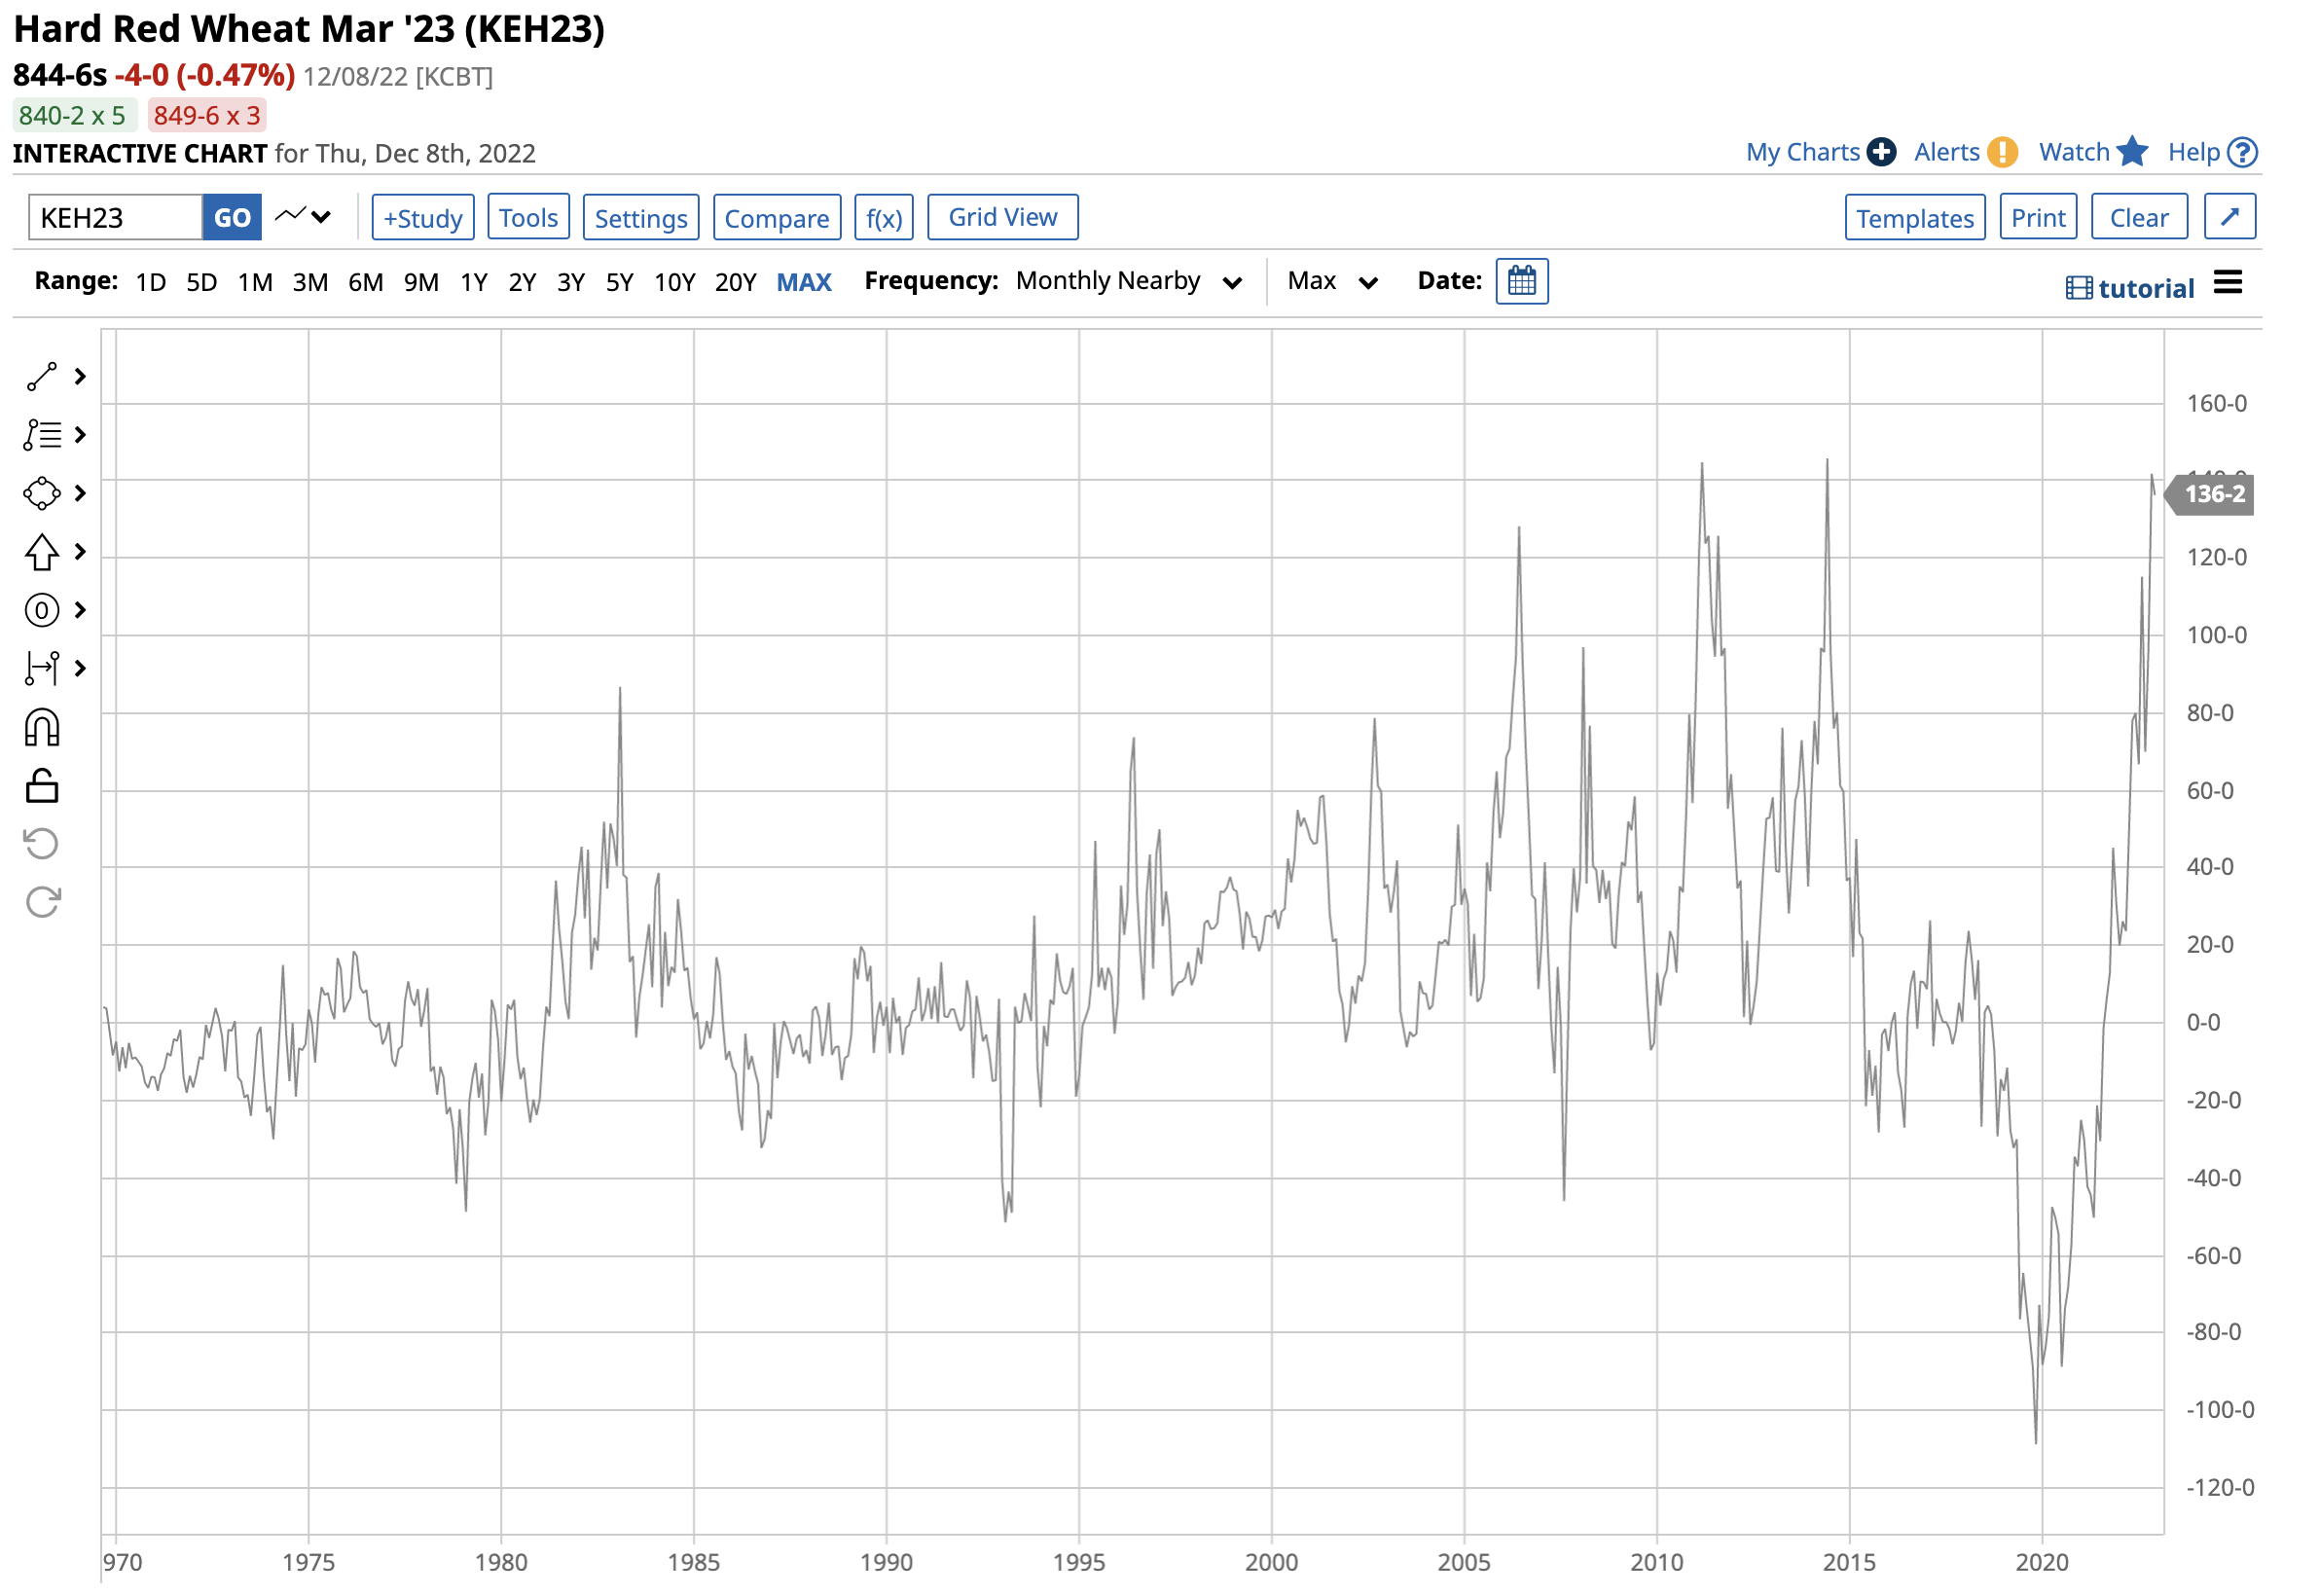
KCBT wheat minus CBOT wheat futures chart (Barchart)
The long-term chart of nearby KCBT hard minus CBOT soft red winter wheat futures shows that at a $1.3625 premium for the KCBT wheat, the spread remains near the historical high dating back to the late 1960s. The explosive move in KCBT vs. CBOT wheat reveals that many wholesale consumers are worried about higher prices and wheat availability going into 2023. The spread is a bullish sign for the wheat market.
Processors crush soybeans into two products: oil and meal. The oil has cooking applications and is found in salad dressing, mayonnaise, and other food products. Moreover, soybean oil is an ingredient in biodiesel. Soybean meal is an input in animal feeds and other food products. The crush is a processing or refining spread that is a real-time indicator of the demand for soybean products, translating to demand for raw oilseeds.
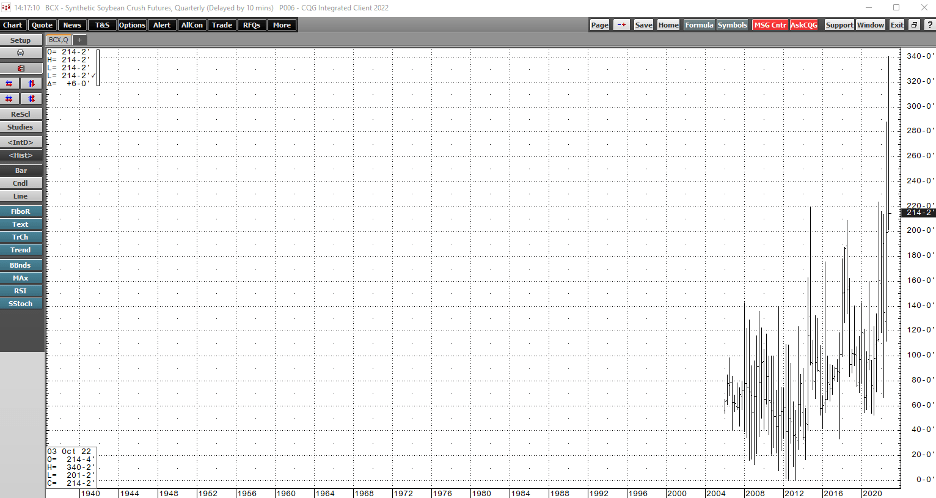
Quarterly Chart of Soybean Crush Spread (CQG)
The quarterly synthetic soybean crush spread chart dating back to early 2006 shows the processing spread reached a record $3.4025 high in October 2022. At the $2.1425 per bushel level on December 8, the spread remains near the previous all-time high from November 2021 at $2.2375. The price action in the crush spread signals robust demand for soybean products in late 2022.
Meanwhile, corn is the primary ingredient in U.S. ethanol production.
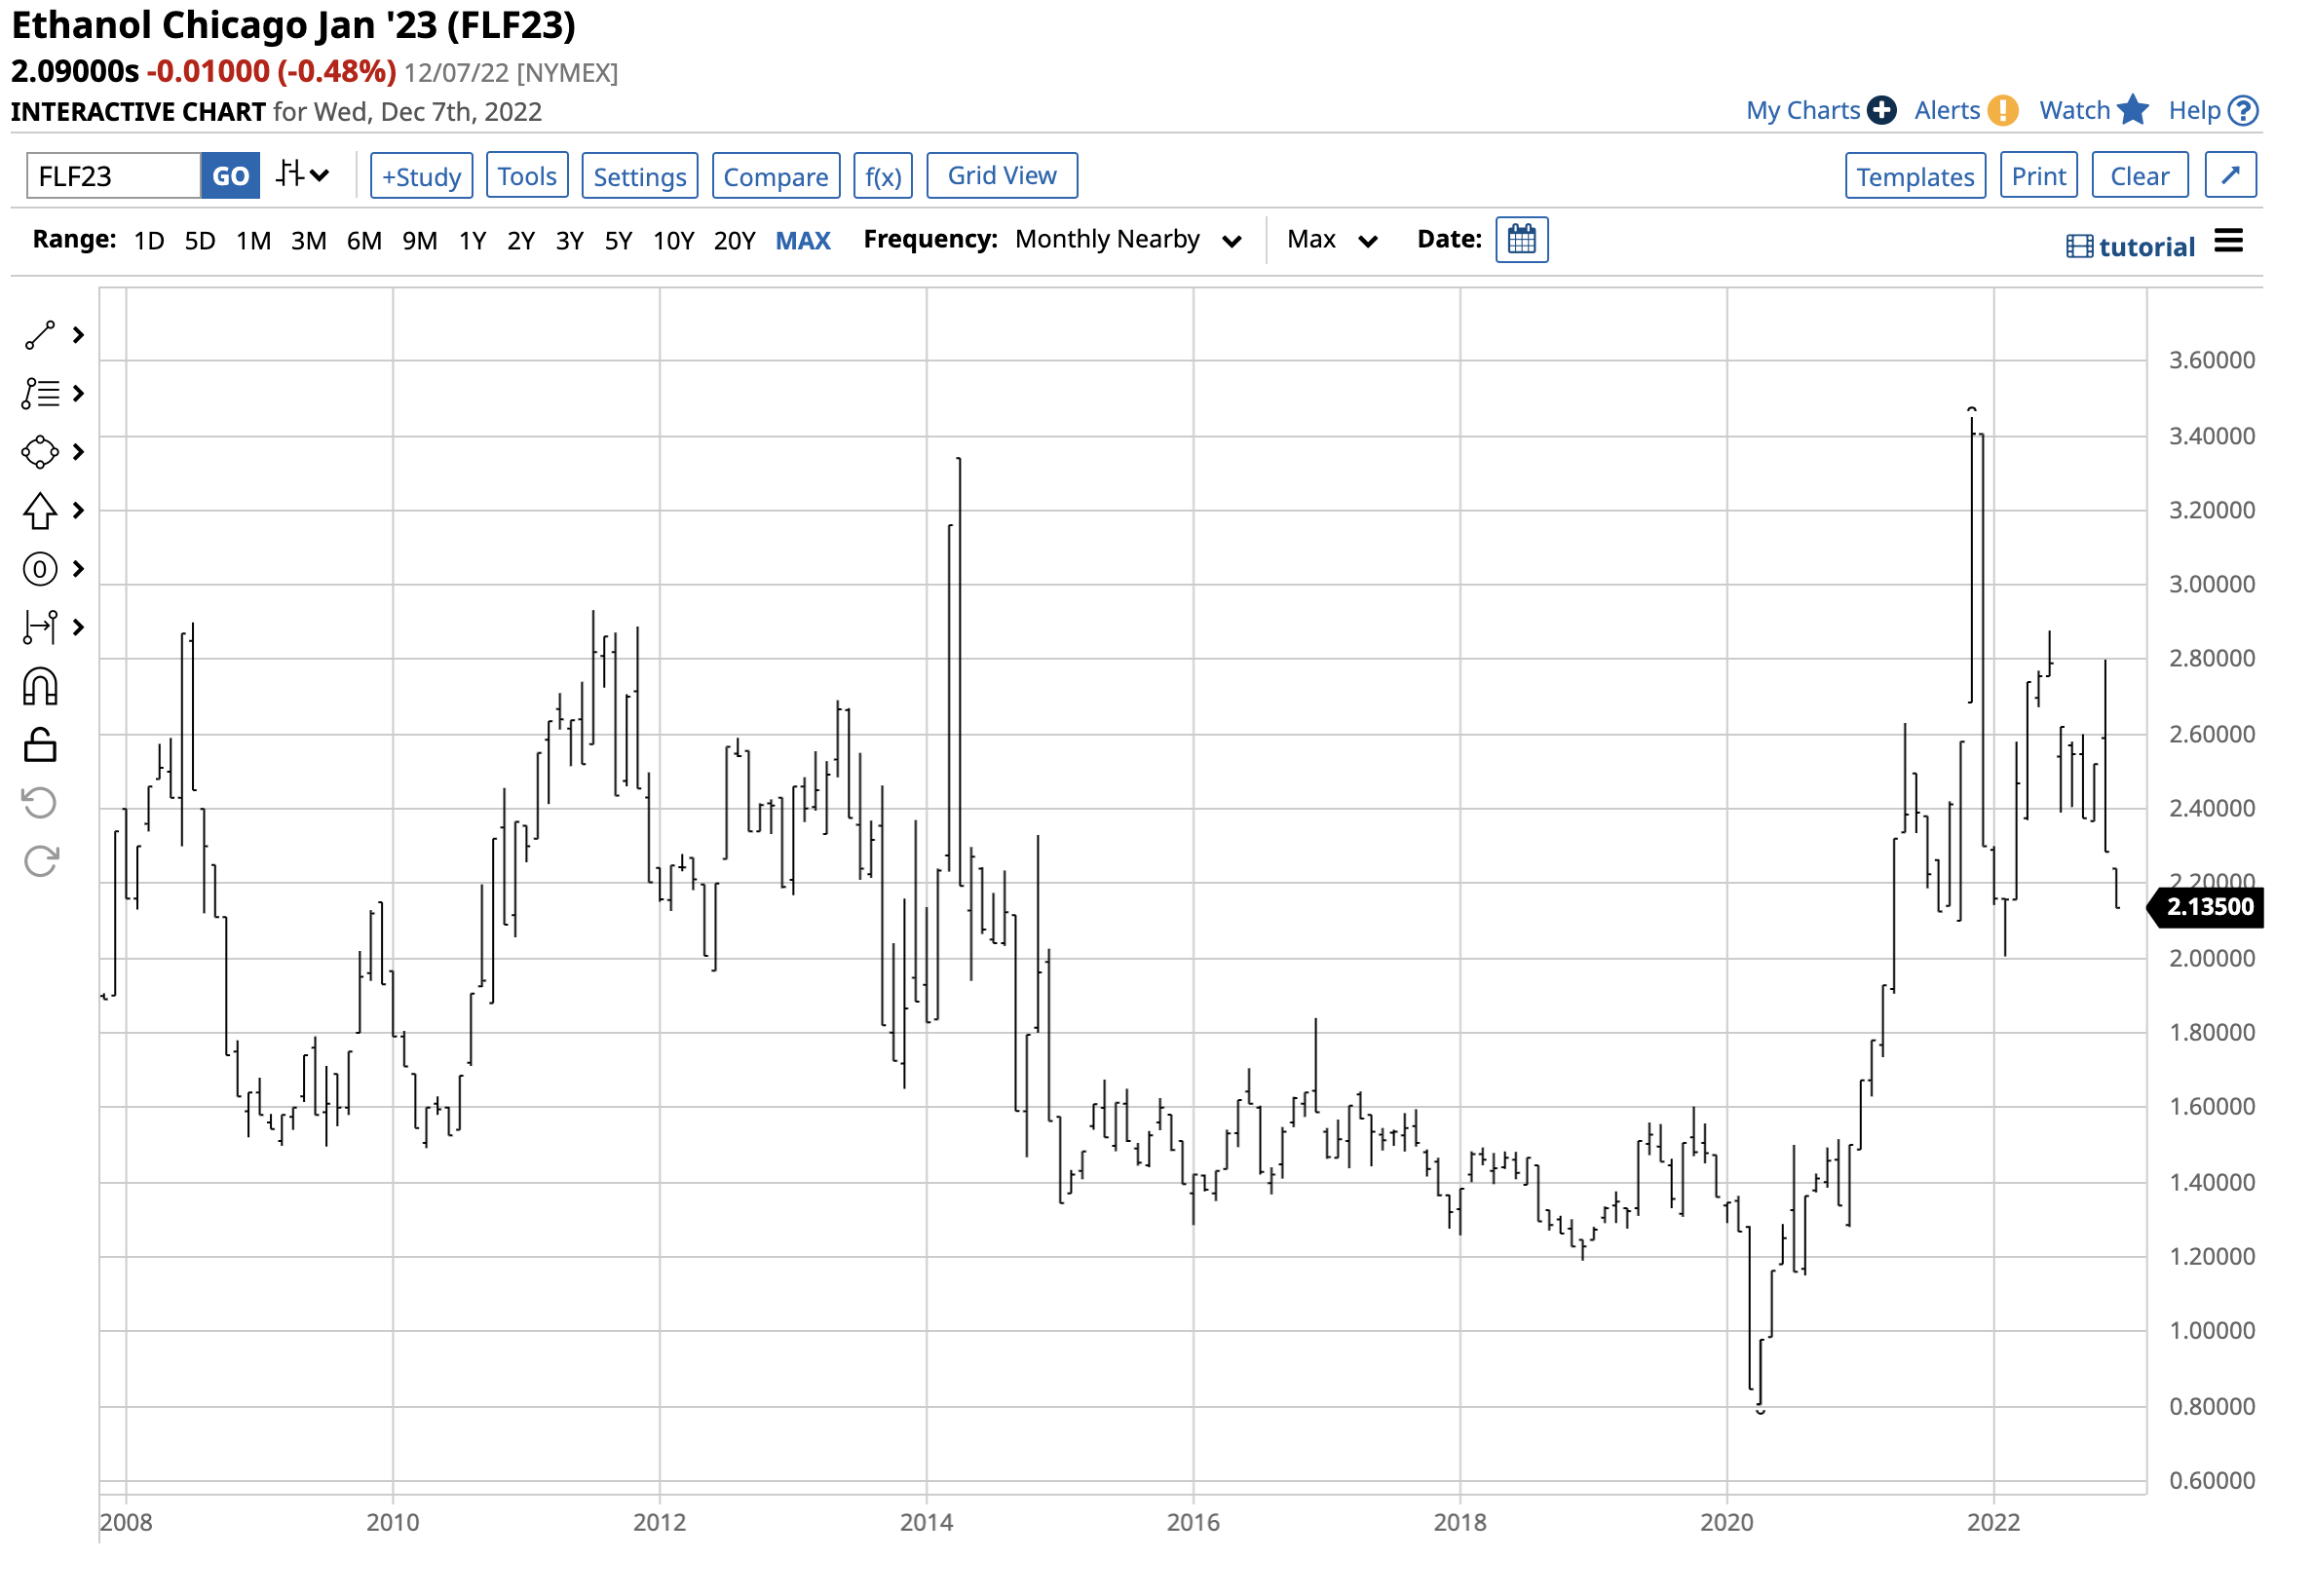
Long-term Ethanol Swaps Chart (Barchart)
The chart illustrates at the $2.09 per gallon wholesale level, corn-based ethanol futures are at the highest price since 2014. Ethanol is highly correlated with gasoline, a seasonal fuel, and rising gasoline in 2023 would put upward pressure on ethanol prices, pushing corn demand higher.
Companies involved in processing agricultural products make significant capital investments in refineries, crushing, and processing plants. When spreads widen, their earnings and share prices tend to rise. In 2022, the S&P 500, the most diversified U.S. stock market index, was around 17% lower on December 8. Archer Daniels Midland (ADM) and Bunge Limited (B.G.) are leading agricultural processing companies trading on the U.S. stock market. At $92.16 on December 8, ADM shares were 36.4% higher than the December 31, 2021, closing level. At $95.98 on December 8, B.G. shares were 2.80% higher this year, as the processing companies far outperformed the stock market in 2022. While the quality and processing spreads are a real-time indicator of the input demand, it is also a barometer for earnings for ADM, B.G., and other agricultural companies.
MOO is a diversified agribusiness ETF
The fund summary for the VanEck Vectors Agribusiness ETF states:
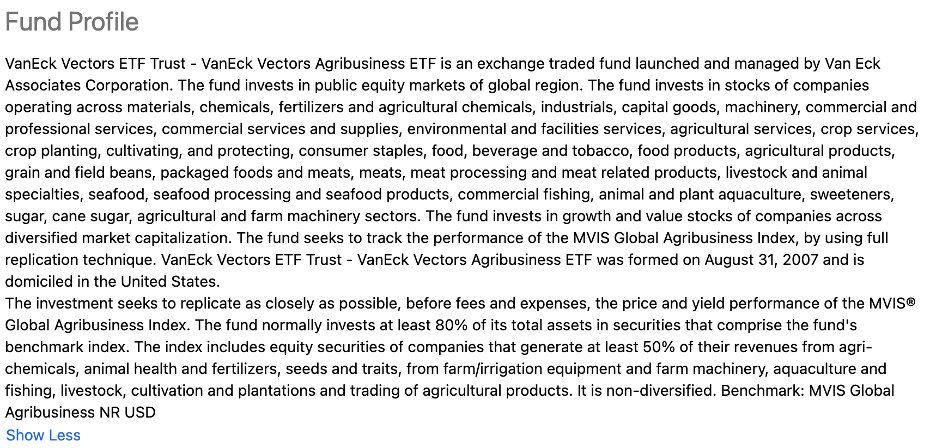
Fund Profile for the MOO ETF Product (Seeking Alpha)
The most recent top holdings include:
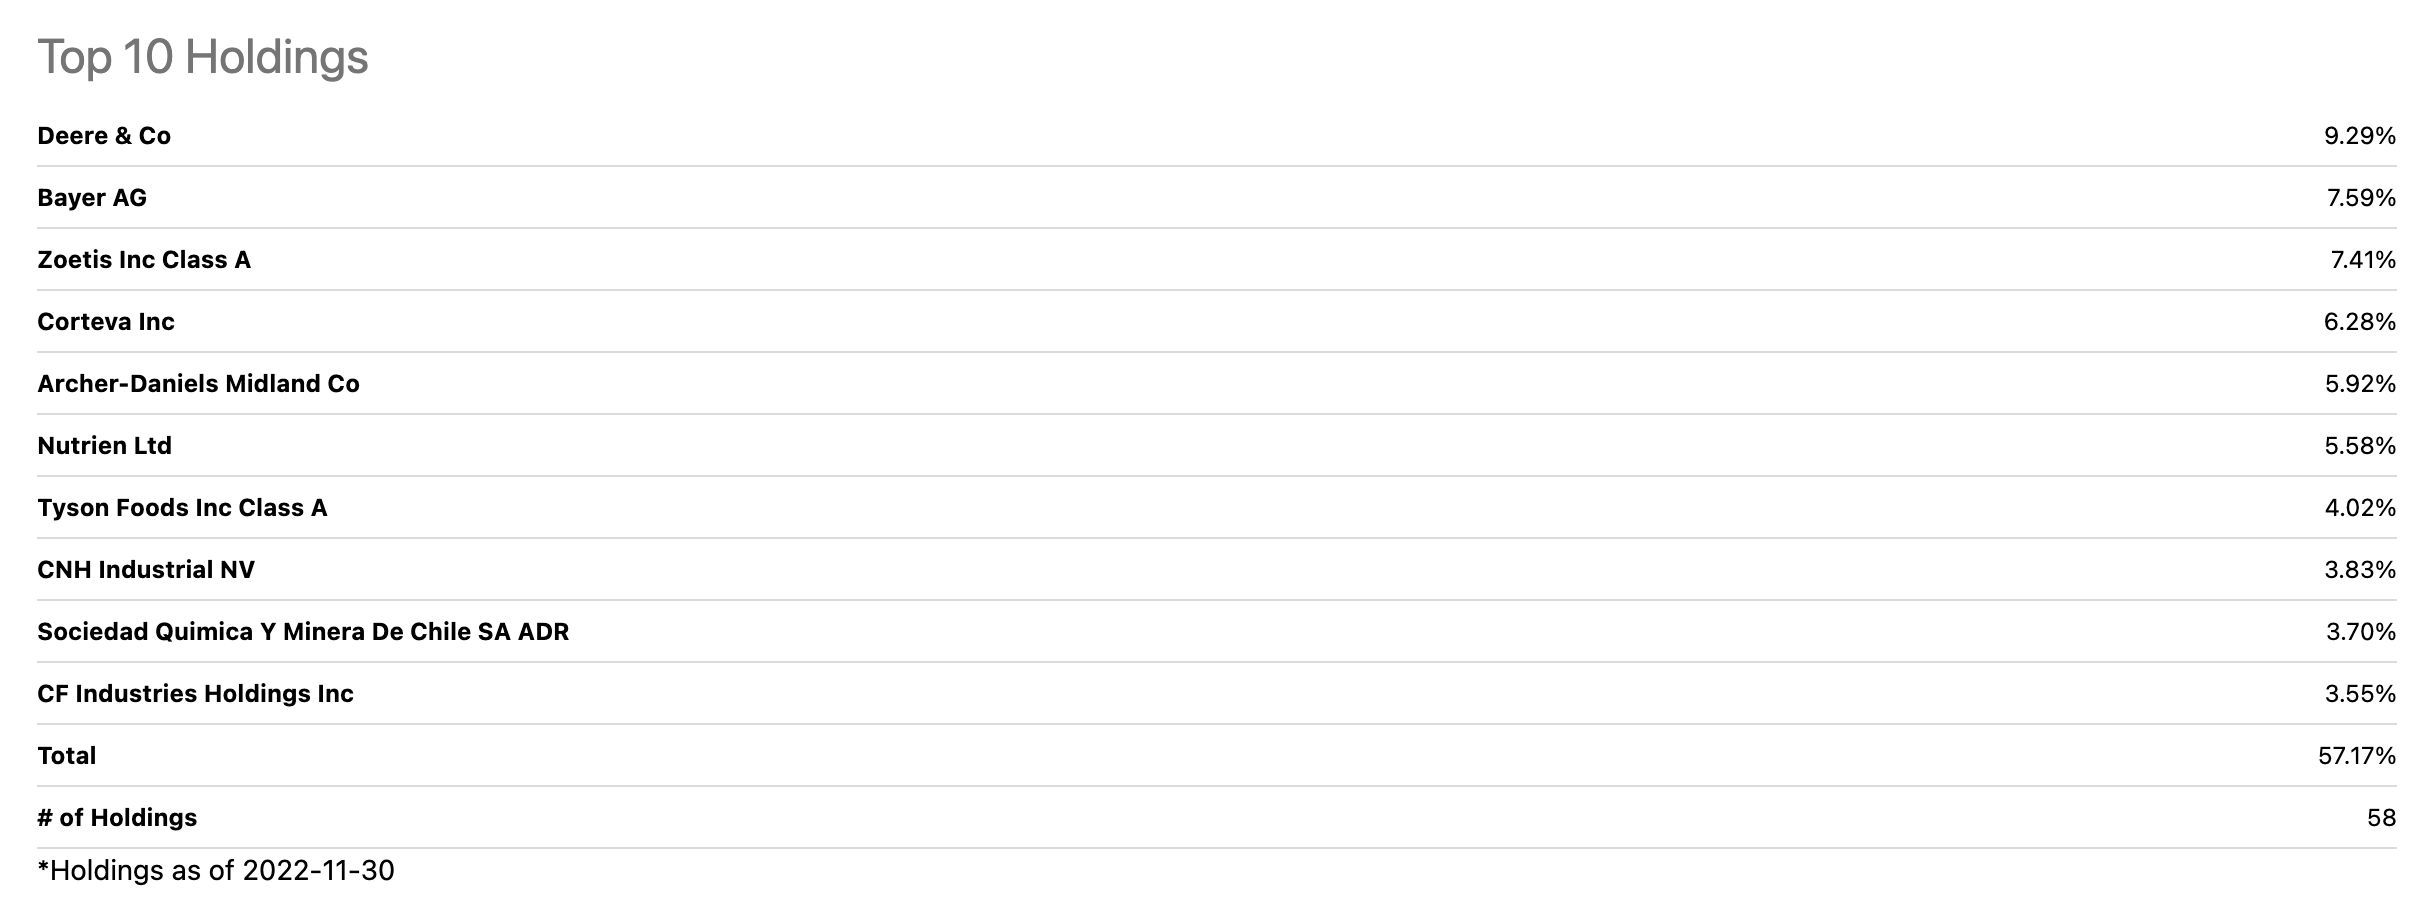
Top Holdings of the MOO ETF Product (Seeking Alpha)
At $90.23 per share on December 8, MOO had around $1.5 billion in assets under management. The ETF trades an average of 80,095 shares daily and charges a 0.52% management fee. The S&P 500 has declined by around 17% since the end of 2021.
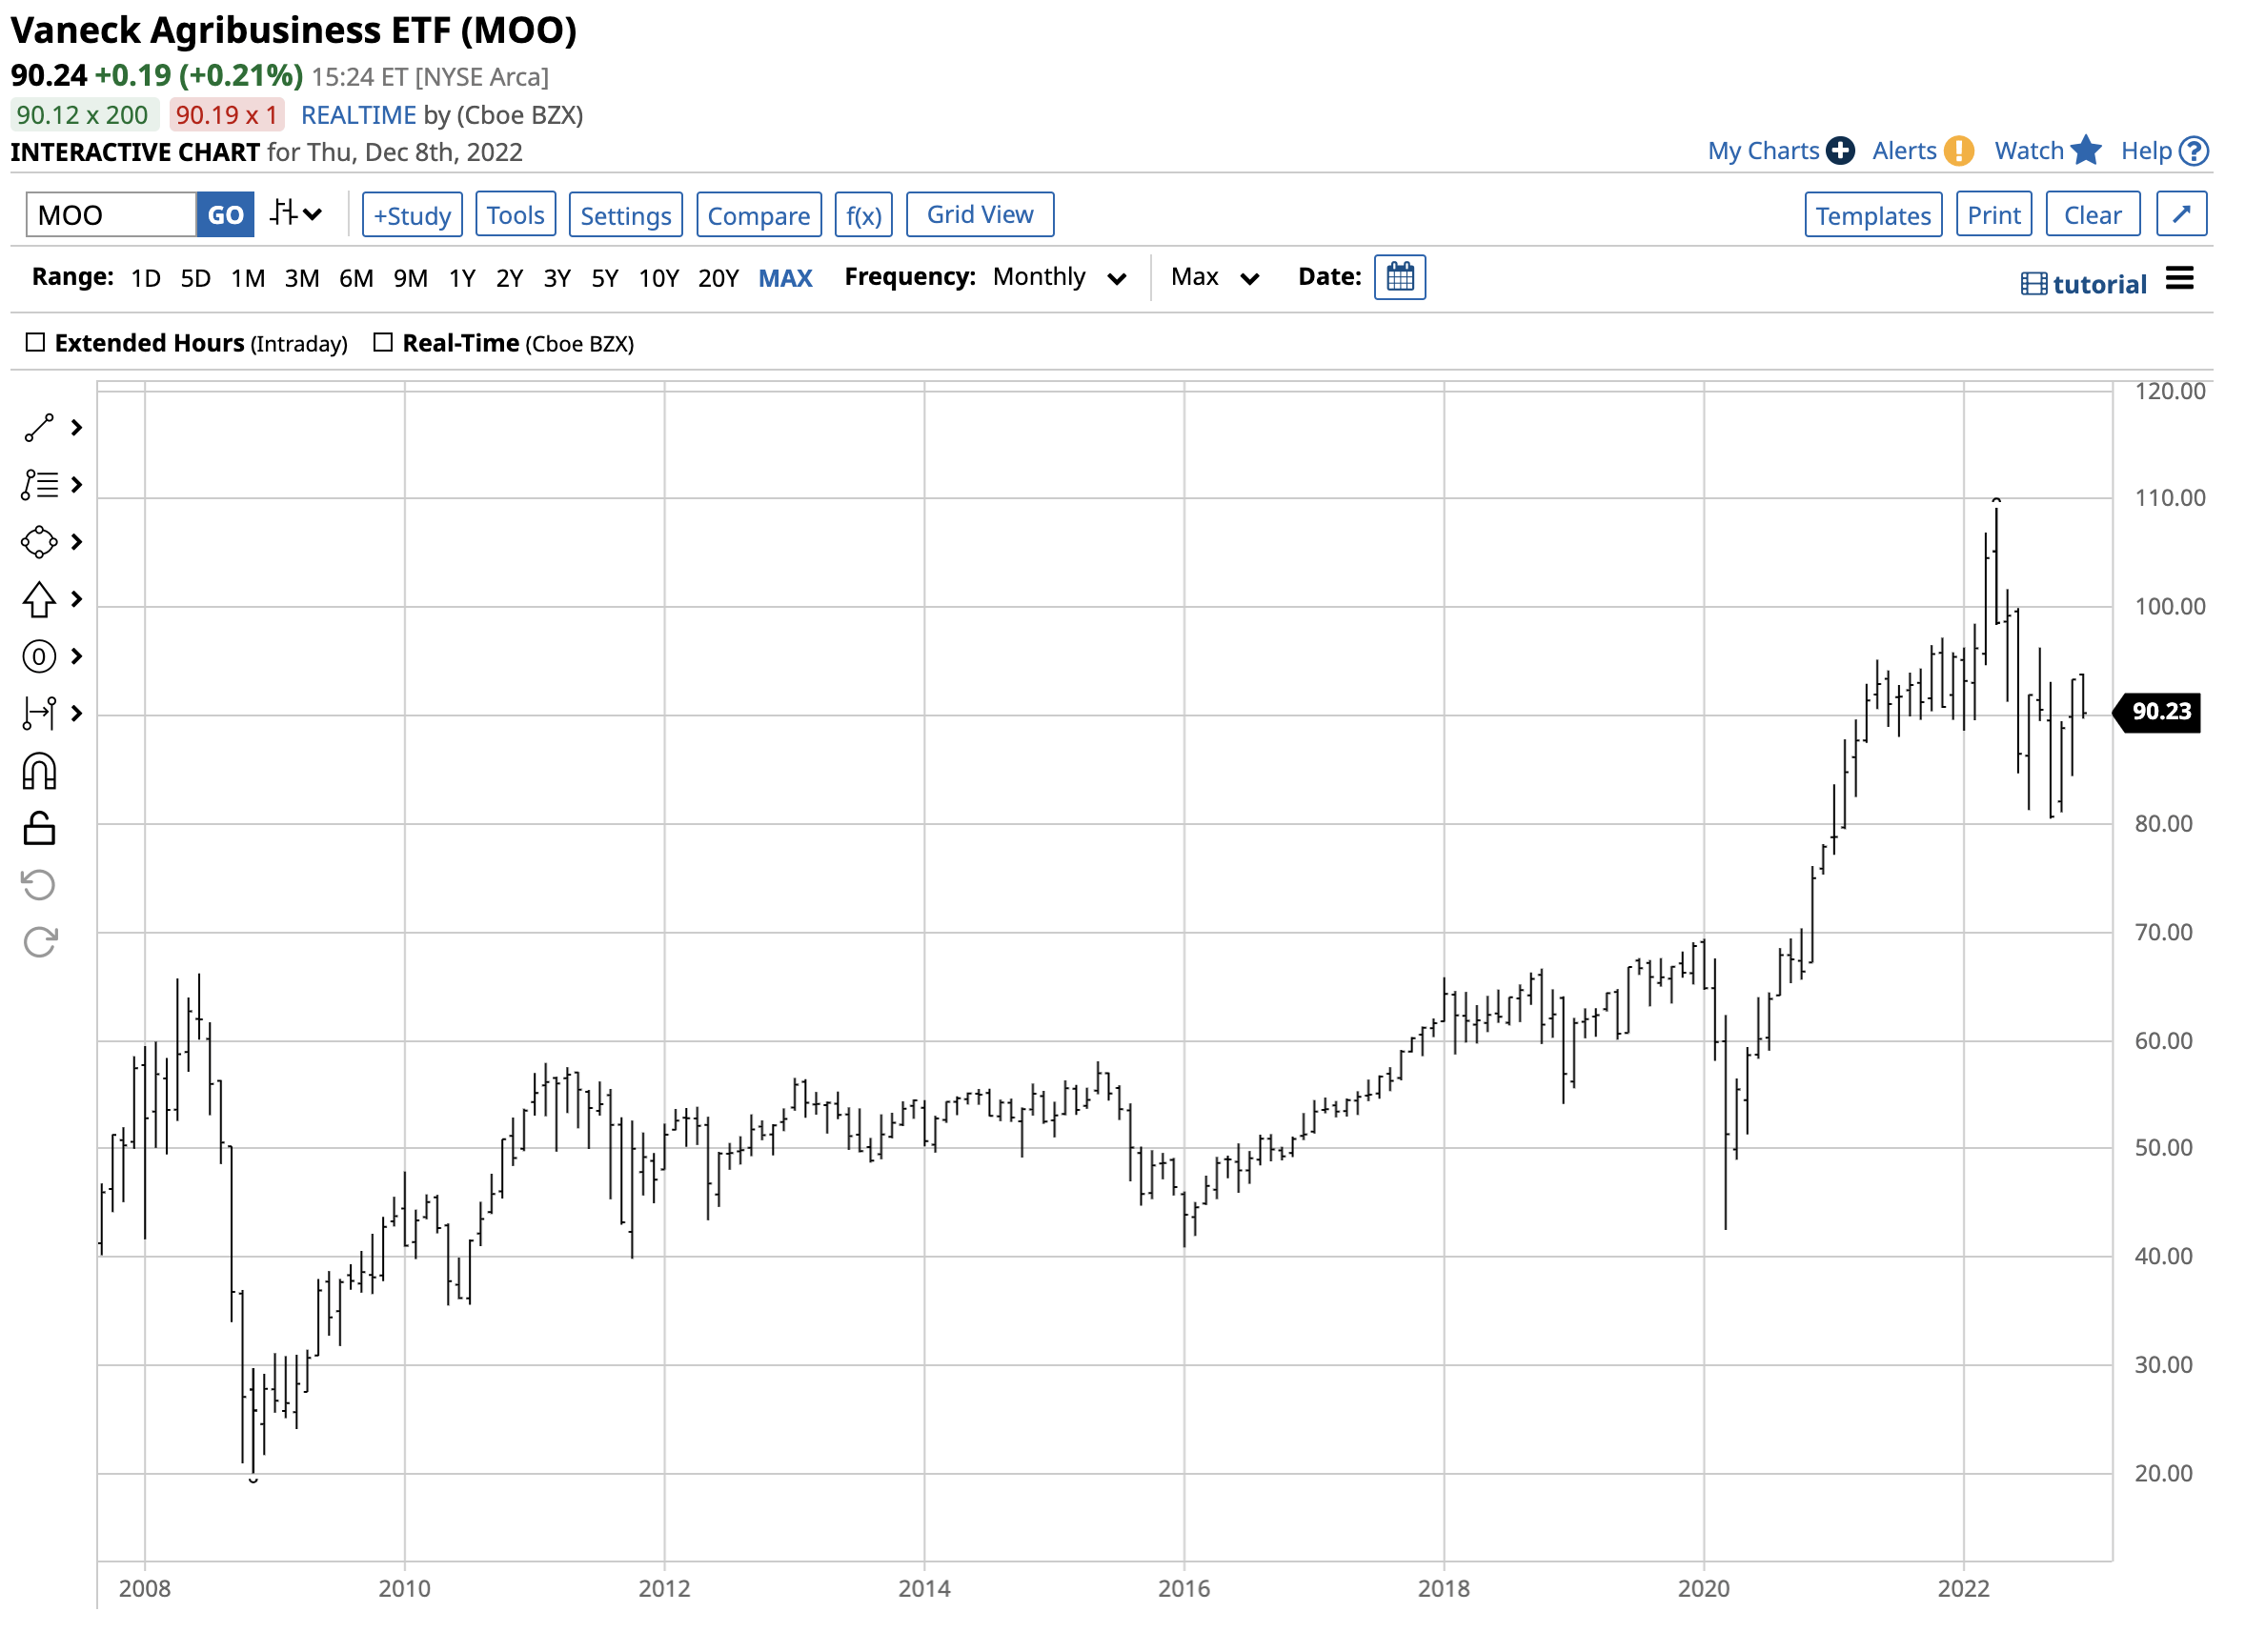
Chart of the MOO ETF Products (Barchart)
The chart shows the decline from $95.42 on December 31, 2021, to $90.24 per share on December 8, 2022, a 5.4% decrease. While the ETF has declined this year, it has far outperformed the benchmark S&P 500.
MOO could resume its upward trajectory in 2023
Agricultural products feed and fuel the world. The MOO ETF holds a wide range of agribusiness companies. While the ETF dropped 5.4% this year, it traded to a low of $42.52 per share in March 2020 and has more than doubled since the pandemic gripped markets across all asset classes. MOO is one of my favorite picks for 2023, as I view the decline from the end of 2021 as a compelling buying opportunity.
I suggest a scale-down buying approach to MOO, starting at the current price level and adding on further price weakness over the coming weeks. The war in Ukraine, geopolitical bifurcation, and ever-increasing mouths to feed and people to fuel suggest that agribusiness investment will shine in the coming year.
Editor’s Note: This article was submitted as part of Seeking Alpha’s Top Ex-US Stock Pick competition, which runs through November 7. This competition is open to all users and contributors; click here to find out more and submit your article today!”
Be the first to comment