


Foto Para Ti/iStock via Getty Images
Investment Thesis
As an alternative to S&P 500 Index funds, you may be considering the VanEck Morningstar Wide Moat ETF (BATS:MOAT). Since launching in April 2012, MOAT has outperformed the SPDR S&P 500 ETF (SPY) by an annualized 0.56% despite a high 0.47% expense ratio. The approach of only owning discounted moat stocks is appealing; it’s a play on quality, which usually works out over time.
However, that doesn’t mean you should buy into it blindly. In fact, after one of its two sub-portfolios rebalanced last month, MOAT has taken a sharp turn for the worse and now ranks as one of the worst large-cap blend ETFs I track. I’ll leave you to decide whether that means to hold or sell, but either way, I expect MOAT to underperform in the short term and recommend waiting for a much better price as it underperforms the S&P 500.
ETF Overview
Strategy and Fund Basics
MOAT tracks the Morningstar Wide Moat Focus Index, consisting of two sub-portfolios of 40 stocks. Selections are based on three factors:
- Morningstar Moat Rating
- Price / Fair Market Value (Target 15% – 25% Discount)
- Twelve-Month Price Momentum
The sub-portfolios are reconstituted semi-annually and staggered quarterly, so effectively, half the Index resets every March, June, September, and December. The Index is equal-weighted, but that requires clarification. With 40 companies in each sub-portfolio, you might expect MOAT to have 80 holdings, but it only has 52. The reason is that most companies are in both sub-portfolios and thus, receive double their normal weight. This becomes evident when scanning through the holdings. MOAT’s top holding has a weighting of 2.97%, while its bottom holding has a weighting of just 0.98%.
Before we look at the fund’s exposures, here’s a list of MOAT’s descriptive statistics as of April 15, 2022:
- Current Price: $72.67
- Assets Under Management: $6.78 billion
- Expense Ratio: 0.46%
- Launch Date: April 24, 2012
- Trailing Dividend Yield: 1.13%
- Three-Year Dividend CAGR: 3.69%
- Five-Year Dividend CAGR: 15.06%
- Dividend Frequency: Annually
- Five-Year Beta: 1.07
- Number of Securities: 52
- Portfolio Turnover: 47%
- Assets in Top Ten: 27.01%
- Tracked Index: Morningstar Wide Moat Focus Index
- Short-Term Capital Gains Tax Rate: 40%
- Long-Term Capital Gains Tax Rate: 20%
- Tax Form: 1099
Sector Exposures and Top Holdings
Relative to SPY, MOAT is overweight Consumer Staples by 7.33% and Industrials by 5.90%, with primary offsets in Financials (4.76%) and Consumer Discretionary (3.62%). MOAT also has virtually no exposure to Energy and Real Estate stocks, which could be problematic should inflation continue to run hot.
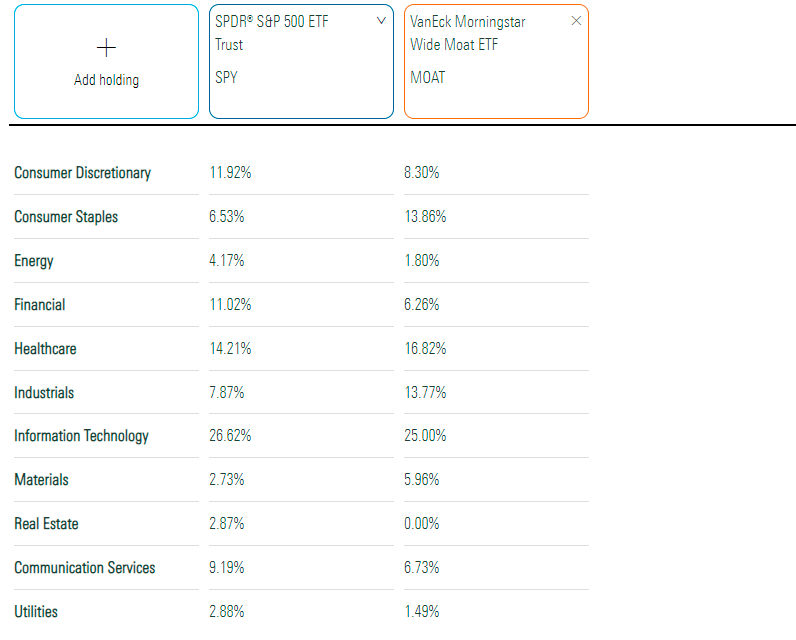
Morningstar
MOAT’s top 20 holdings are listed below. They total 51.05% and include household-name stocks like Philip Morris (PM), Amazon (AMZN), and Wells Fargo (WFC).

VanEck
Historical Performance
As shown below, MOAT has tracked SPY quite well, though with slightly higher volatility and, as a result, had worse risk-adjusted returns. However, the differences are minor and suggest that a high-quality, concentrated portfolio can work in the long run.
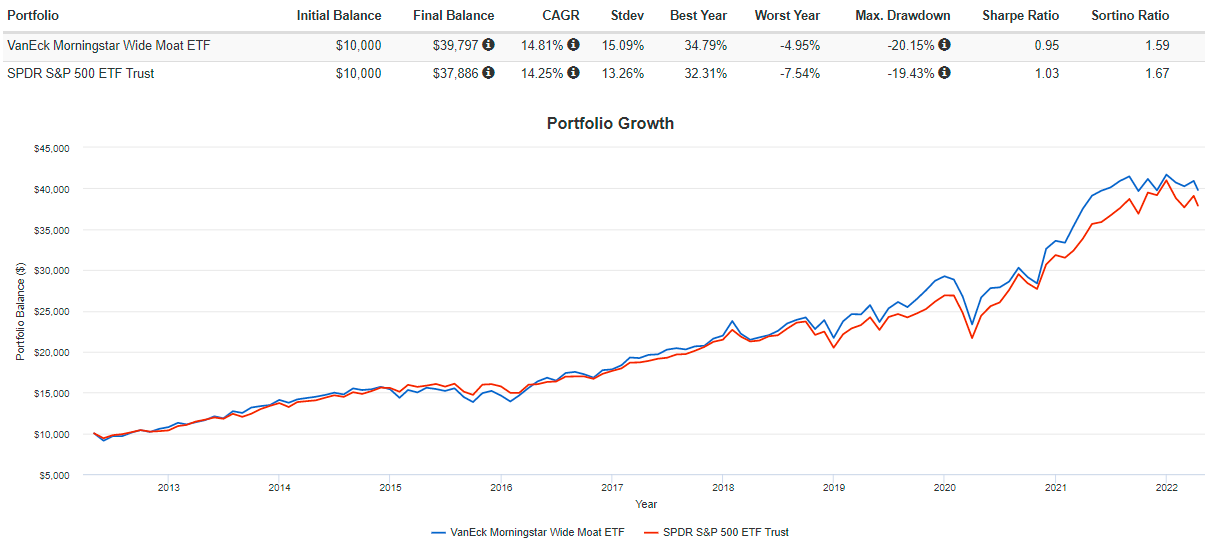
Portfolio Visualizer
Another way to view performance is on a rolling three-year basis. The graph below shows how MOAT’s three-year annualized returns were about 1.65% better after the Q1 2020 crash. While it’s outperformed by about 3% since my bullish December article, it’s still trailing SPY over the three years ending March 2022.
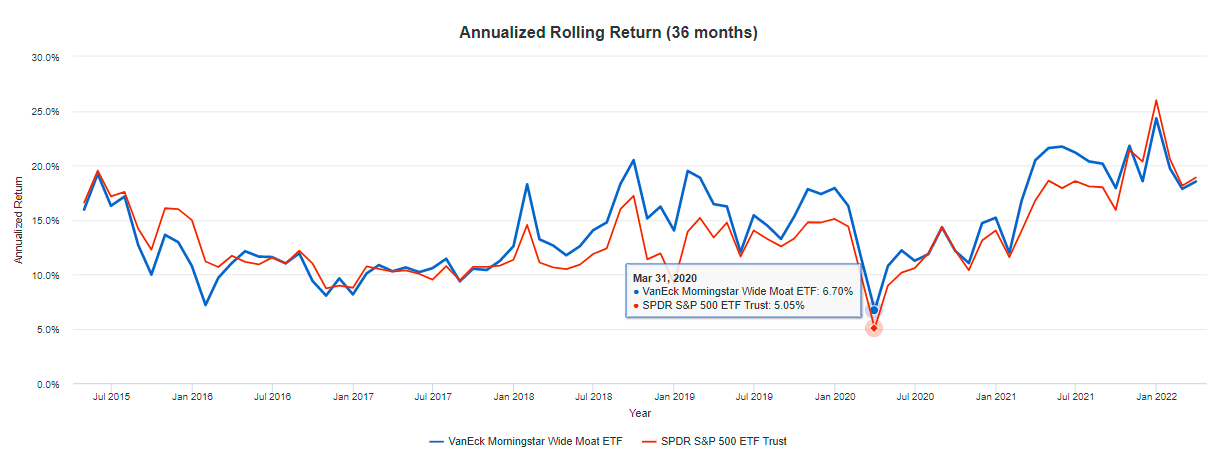
Portfolio Visualizer
ETF Analysis
Reconstitution Summary
On March 18, 2022, one sub-portfolio was reconstituted. The Index added and removed 11 stocks, all related to the stock’s price-fair value ratio. According to Morningstar, the potential upside ranges from 24% for 3M (MMM) to 42% for MercadoLibre (MELI).
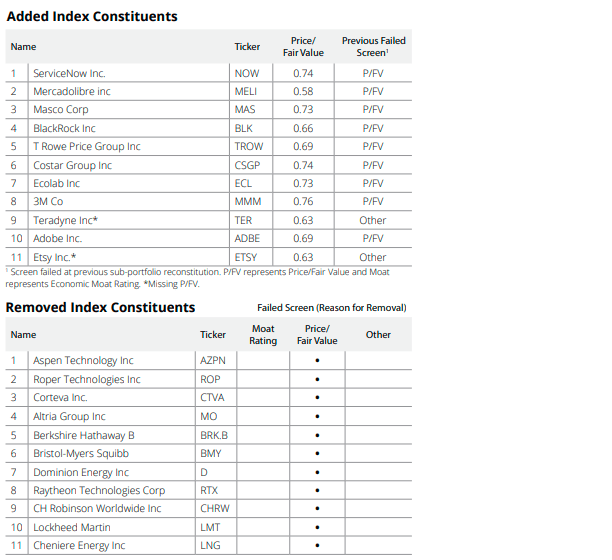
VanEck / Morningstar
In my view, several of these additions are too risky and not in line with analyst forecasts. To illustrate, consider the table below highlighting the changes from a fundamentals perspective. The bolded ones are the additions, while the others are the removed Index constituents.

Author
The additions are trading 22.01% below their 200-day moving average prices compared to a positive 16.28% for the deleted companies. These calculations are consistent with Morningstar’s price-fair value screen, but the other metrics have me concerned. Specifically:
- Average Five-Year Beta: 1.23 for additions, 0.84 for deletions
- Median Forward P/E: 27.24 for additions, 21.23 for deletions
- Average Forward P/E: 63.90 for additions, 19.94 for deletions
- Average EPS Revisions Grade: D+ for additions, B- for deletions
Volatile high growth and high P/E stocks are currently out of favor, so I don’t think adding these types of companies is wise. As suggested by Seeking Alpha’s EPS Revisions Grades, analysts tend to agree. The list below highlights the percentage of analysts who have downgraded their EPS estimates over the last three months. Indeed, there’s not a lot of confidence on the Street, so I’m unsure why Morningstar analysts feel differently.
- Teradyne: 100%
- 3M: 92%
- Ecolab: 100%
- Etsy: 100%
- MercadoLibre: 100%
- Blackrock: 100%
- Adobe: 87%
- ServiceNow: 46%
- Masco: 80%
- CoStar Group: 100%
- T. Rowe Price Group: 100%
Snapshot By Industry
These changes have culminated into what’s sadly a poor-looking portfolio. Here’s a summary of MOAT’s top 20 industries compared with SPY.
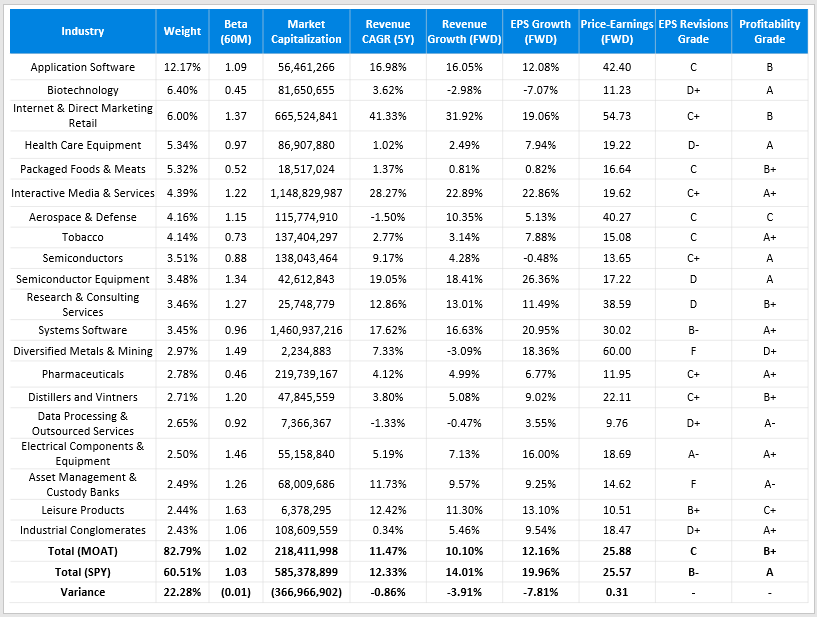
Author
Unfortunately, I can’t find many redeeming qualities in MOAT’s current portfolio. The higher concentration may already have been an issue for some investors. Still, now, its constituents are lagging on five-year historical sales growth (11.47% vs. 12.33%), forward revenue growth (10.10% vs. 14.01%), forward EPS growth (12.16% vs. 19.96%), and even on forward price-earnings (25.88 vs. 25.57). Seeking Alpha’s summary grades on EPS Revisions and Profitability aren’t favorable, either.
Investment Recommendation
MOAT has a solid record of beating the S&P 500 despite a higher expense ratio. That suggests the strategy works, but I’m incredibly disappointed with last month’s reconstitution. The changes involved adding volatile high P/E stocks like CoStar Group (CSGP) based on poor recent performance and deleting or reducing exposure to terrific wide-moat companies like Berkshire Hathaway (BRK.B). The result is a more concentrated portfolio weaker on growth, valuation, and profitability.
Previously, I recommended buying MOAT and advised readers to trust the strategy. Indeed, MOAT has narrowed the post-pandemic performance gap by 3% since, but I think it will be short-lived. Therefore, I’ve decided to downgrade my rating to a sell but will continue monitoring it for signs of positive changes at the next reconstitution.
Be the first to comment