

hirun
The energy markets have been volatile for most of 2022, continuing a two-year trend that dates to the early days of the coronavirus pandemic. We expect broader market fears and a host of macro factors, including high inflation, rising interest rates, the strengthening U.S. dollar, and the war in Ukraine, to keep price volatility in the energy markets high. However, we believe midstream equities can sustain their positive momentum and outperform both other energy segments and other global equities and credit in this environment, helped by their lower correlation to oil prices. U.S. production is also on the upswing, with activity in the Permian Basin rising and positioned to help address the energy crisis in Europe. In our view, midstream equities continue to present a compelling investment case, particularly for investors looking for income.
Key Takeaways
- A byproduct of the Federal Reserve’s (Fed) aggressive interest rate hiking cycle is a stronger dollar, which can put downward pressure on oil prices. However, persistently tight oil supply and the energy shortage in Europe is likely to provide a ballast to oil prices.
- We believe the nature of midstream’s role in oil and gas production and the defensive nature of its contracts and fee structures leave it better positioned in this environment than other segments of the energy market.
- Additional free cash flow for midstream equities through increasing U.S. energy production could result in further dividend and buyback activities, highlighting their potential balance sheet strength.
Dollar Strength the Latest Factor Contributing to Oil Market Volatility
Over the last two-plus years, oil prices swung from as low as $20 a barrel in April 2020 to as high as $125 barrel in March 2022.1 In addition, natural gas price volatility reached an all-time record in 20 years for both European and Asian gas markets as a result of unprecedented uncertainty.2 COVID-19, OPEC policies, the war in Ukraine, and the global economy’s energy transition all played a role. The Fed hiking interest rates by 225 basis points (bps) so far this year in an effort to curb inflation is another major factor in oil’s recent behavior.3
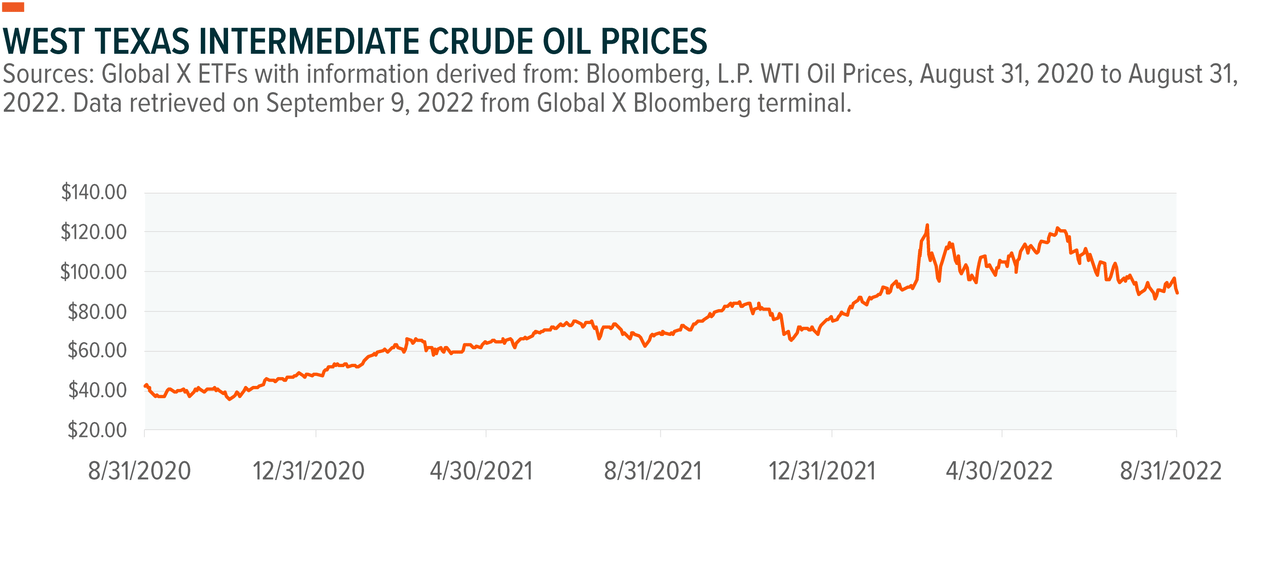
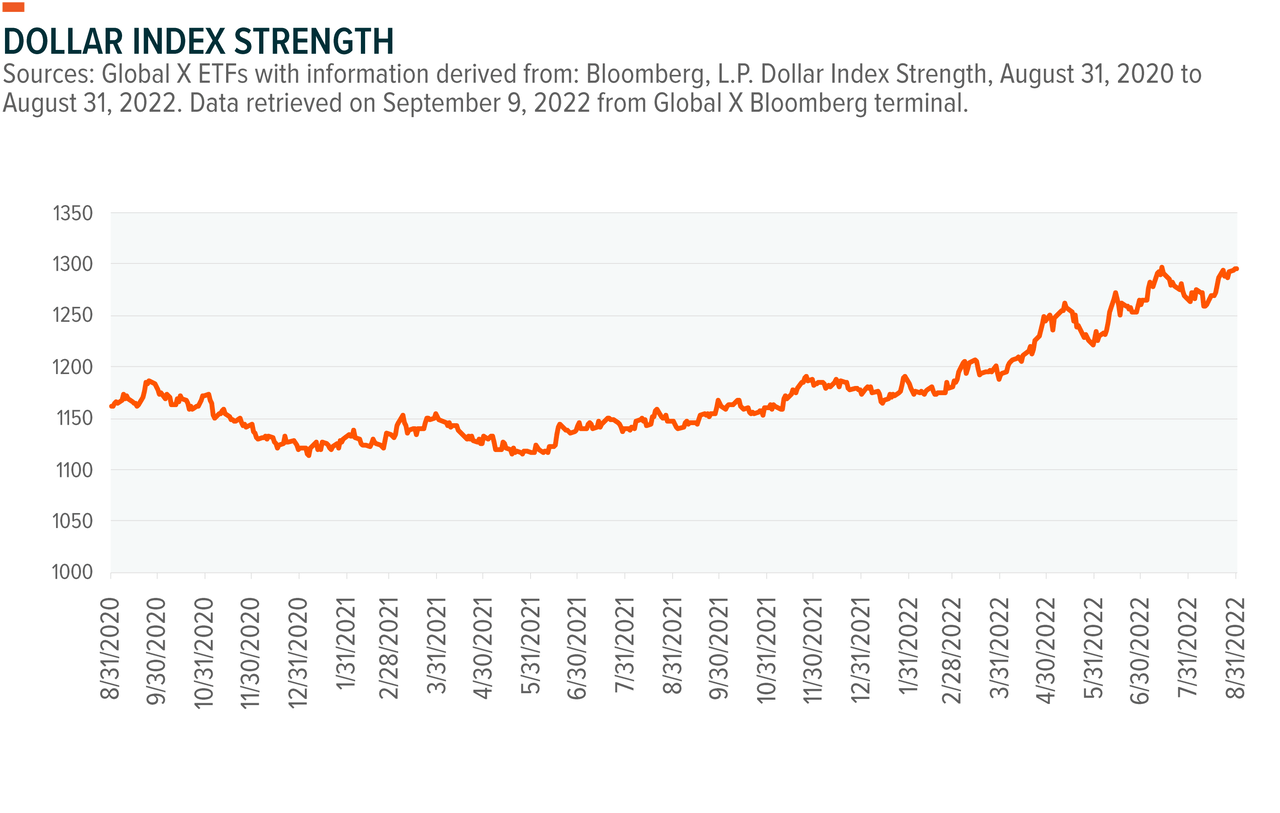
The drop in price since the March high can be attributed to rising interest rates and fears of a market downturn strengthening the U.S. dollar, which had a negative correlation of -0.22 with oil.4 Generally, a stronger dollar causes oil prices to fall because oil is traded in USD, making it more expensive for other nations, particularly emerging markets (EMs) to purchase. And with EMs still recovering from COVID, fiscal spending and economic performance remains sluggish. Ongoing COVID-19 concerns in China and the subsequent lockdowns in China, the world’s largest oil importer, also added pressure.
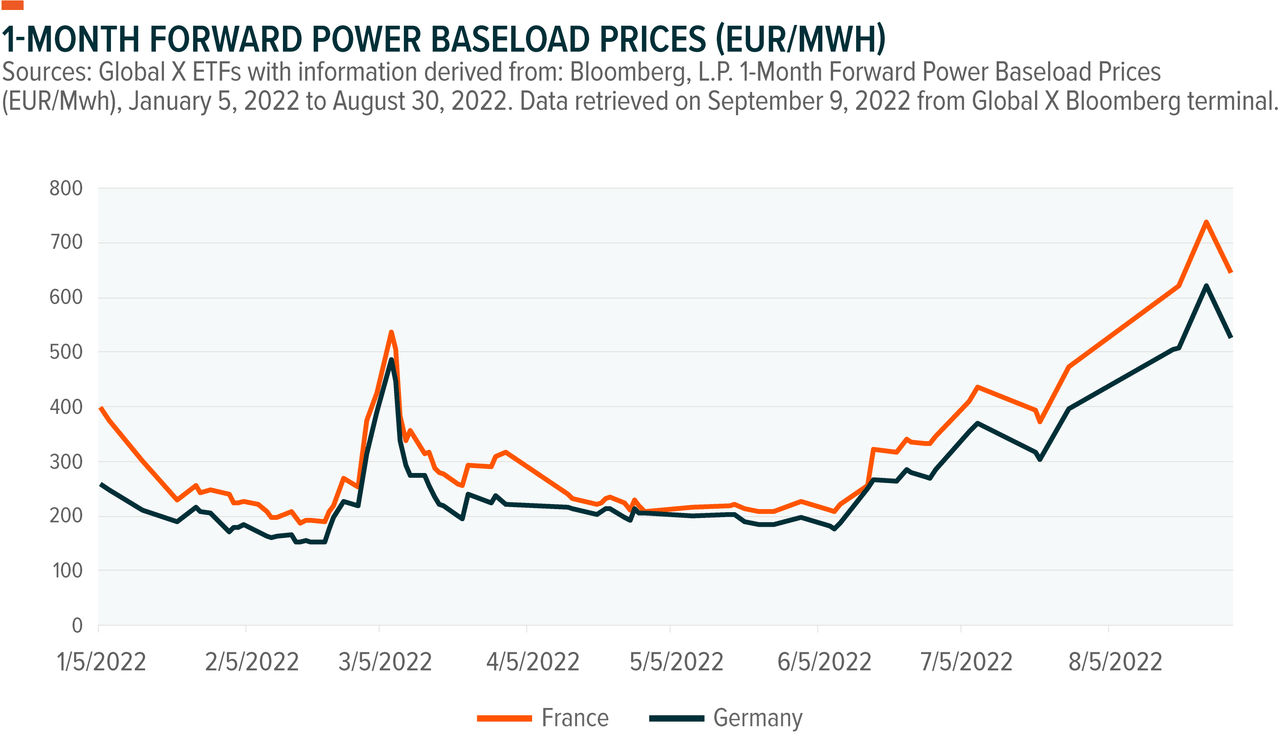
However, natural gas prices remain a bright spot. The energy crisis in Europe and heavy reliance of the continent on Russian gas supplies is causing both localized and global price hikes of natural gas. Europe imports approximately 45% of its natural gas from Russia, leading to the exorbitant price spikes seen below. US natural gas prices still moved heavily also, multiplying from $3.68 million British thermal unit (mmbtu) to start the year all the way to $9.13 mmbtu at the end of August.
The midstream sector may be well positioned to capitalize on these dynamics both in the short-term and long-term. The North American midstream sector skews towards natural gas as its primary revenue driver. 79% of revenue comes from natural gas as opposed to oil.5 Natural gas production in the US is forecasted to grow from around 97 billion cubic feet per day (bcf/d) to over 100 bcf/d by April 2023.6 In the long-term, countries are likely to reduce their reliance on unstable energy sources like Russia, creating an opportunity for US midstream infrastructure. This could result in additional spending to the sector for long-term growth.
Correlation Between Oil and the Midstream Lower than Other Energy Companies
Midstream companies handle the processing, storage, and transportation phases of oil and gas production, making their correlation with oil prices unique relative to other energy segments, and perhaps lower than expected. Currently, the correlation between midstream companies and oil prices is 0.55.7 For other energy segments, like exploration & production (E&P) companies and refining companies, the correlation tends to be higher, in the 0.6–0.7 range.8
Also, given MLPs typically operates fee-based business model, the long-term correlation between midstream and oil tends to be lower than other energy segments. MLPs set certain contractual escalators that increase payments by a certain percentage, or they are based on the Producer Price Index (PPI) for finished goods. Shorter in duration, these escalators make MLPs less susceptible to energy price moves.
MLPs’ correlation to oil tends to increase more during periods of declining oil prices. In particular, the correlation tends to increase when oil prices fall below $45–50 a barrel, which we attribute to possible concerns about counterparty risk and volume risk. For example, when oil prices dropped more than 50% from June 1, 2014 to June 1, 2016, the correlation between MLPs and oil was roughly 0.5. 9 Conversely, when WTI oil prices increased more than 300% from June 30, 2020 to June 30, 2022, the correlation was roughly 0.47. However, when prices are high or elevated like we’ve seen in June 2014 and this year and there is a price drop, midstream equities tend to be more immune to that price drop because there isn’t as big of a risk of a forecasted production drop since most North American E&Ps continue to profit at those prices.
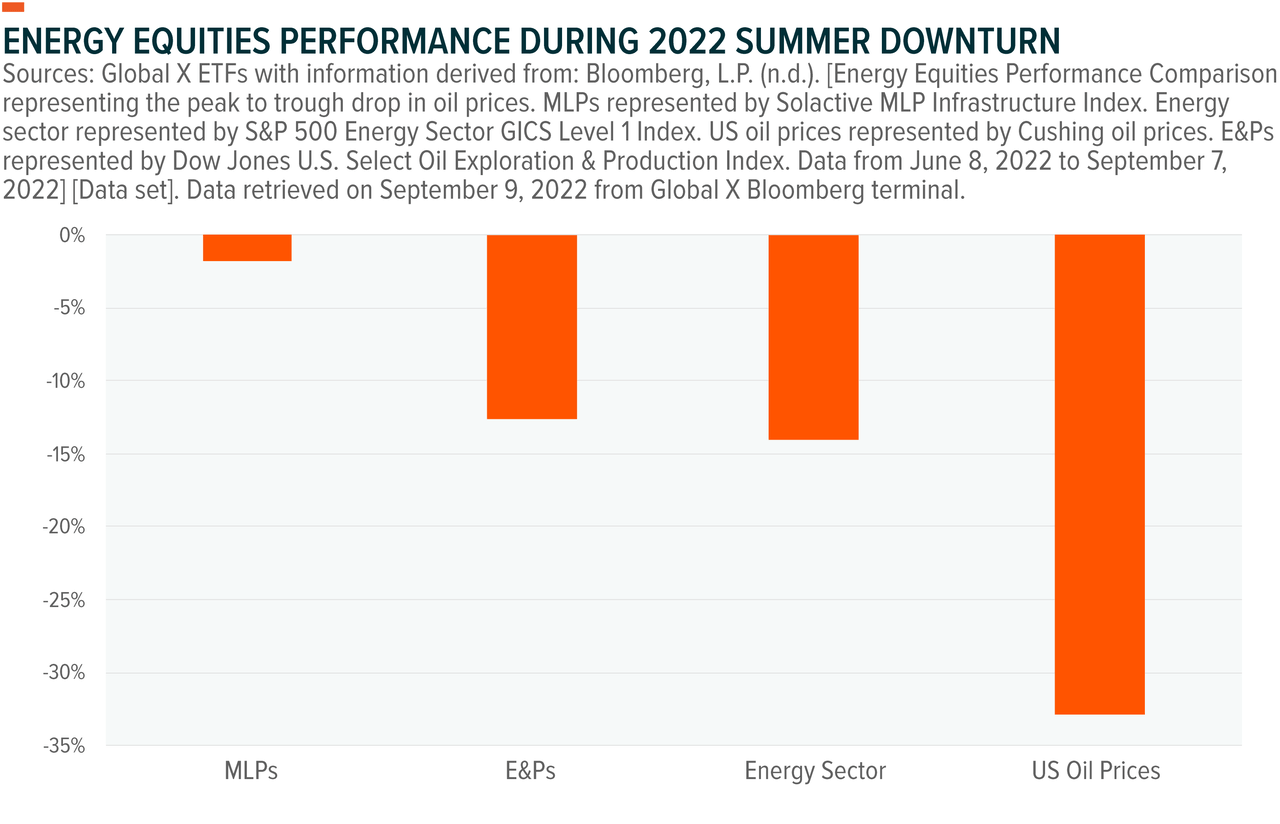
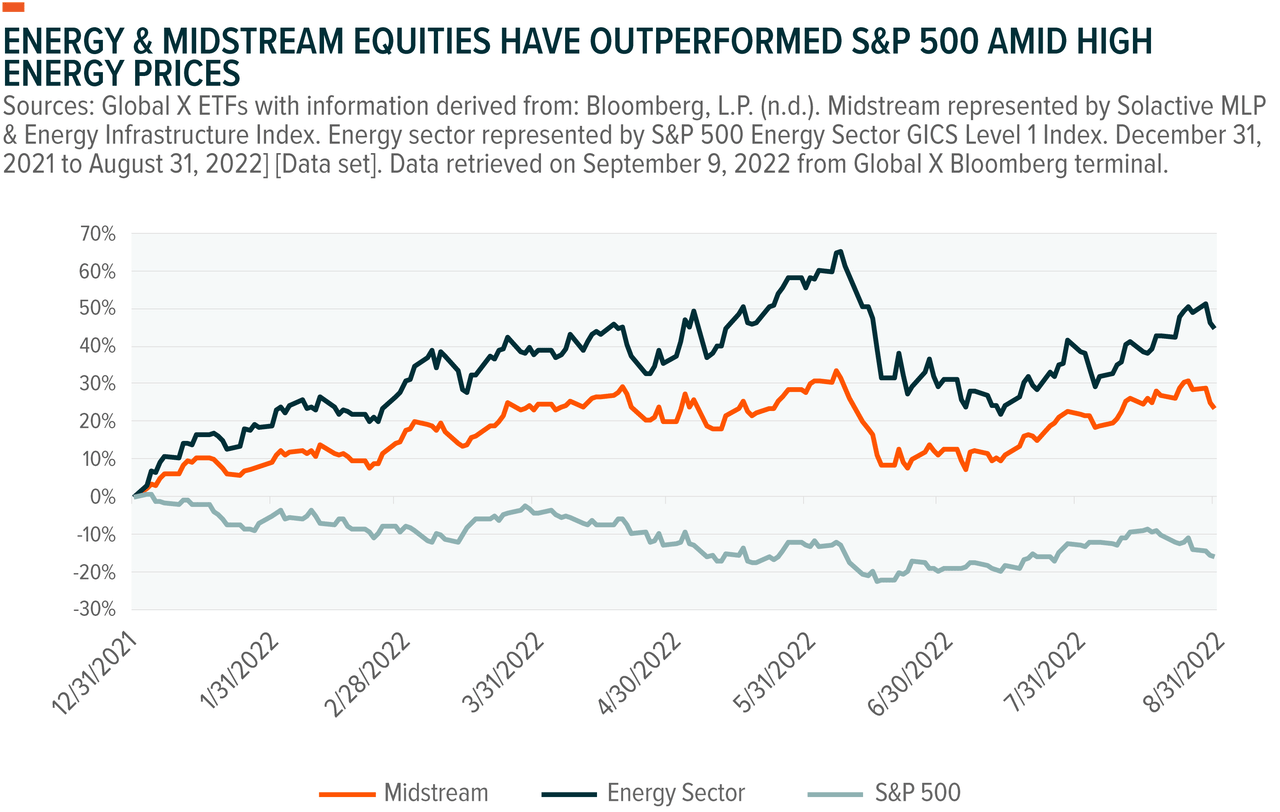
The lower correlation to oil has dampened some of the performance relative to the Energy sector though because high oil prices have been a boon for the broader sector. However, midstream has captured a lot of this positive momentum because of the strength of the sector and higher production outlook. The Energy sector is the best performing sector by far based on the S&P 500 Global Industry Classification Standard sector (GICS), and the only positive performing one year to date.
Permian-Focused Midstream Equities Appear Well-Positioned
The rising rig count and share buyback and M&A activity in midstream, especially in the Permian Basin, indicate strength in the space. The Permian is the largest oil-producing shale area in the U.S., accounting for over 40% of total U.S. oil production.10 U.S. oil production is expected to average 11.9 million bpd in 2022 and 12.7 million bpd in 2023, which would be a record high for the U.S. in a year.11 Permian production is projected to increase from 5.6 million barrels in 2022 to 6.5 million barrels in 2023.12 Oil giants Chevron (CVX) and Exxon Mobil (XOM) aim to increase production by 15% and 25%, respectively, this year. 13
Higher oil prices and increased domestic production that goes to address the supply disruptions in Europe may create income opportunities for U.S. midstream, especially those that have exposure to the basin. It is expected that the production in the Permian Basin will increase by 2.1 billion cubic feet per day (Bcf/d) in 2022 and an additional 1.7 Bcf/d in 2023 to meet exploding natural gas demand.14
On the M&A front, midstream companies including DCP Midstream (DCP), Enterprise Products Partners (EPD), and Crestwood Equity Partners (CEQP) expanded their gathering and processing business in the Permian Basin through mergers and acquisitions. If completed as planned, the recently announced pipeline projects are expected to boost the Permian Basin’s capacity by a combined 4.18 Bcf/d over the next two years.15
MLPs May Provide Income Opportunities in This Market
The S&P 500 declined 20% in the first half of the year due to investor concerns about inflation and the potential for earnings contraction. Headline inflation fell more than expected from 9.1% in June to 8.5% in July, but it remains well above the Fed’s preferred 2% target. Equities bounced back in July and into August, before selling off on Chair Jerome Powell’s hawkish warnings from Jackson Hole. Treasury yields rising above 3% and market expectations for interest rate hikes to rise to 3.75–4% by end of 2023 have negatively affected interest rate-sensitive assets.16
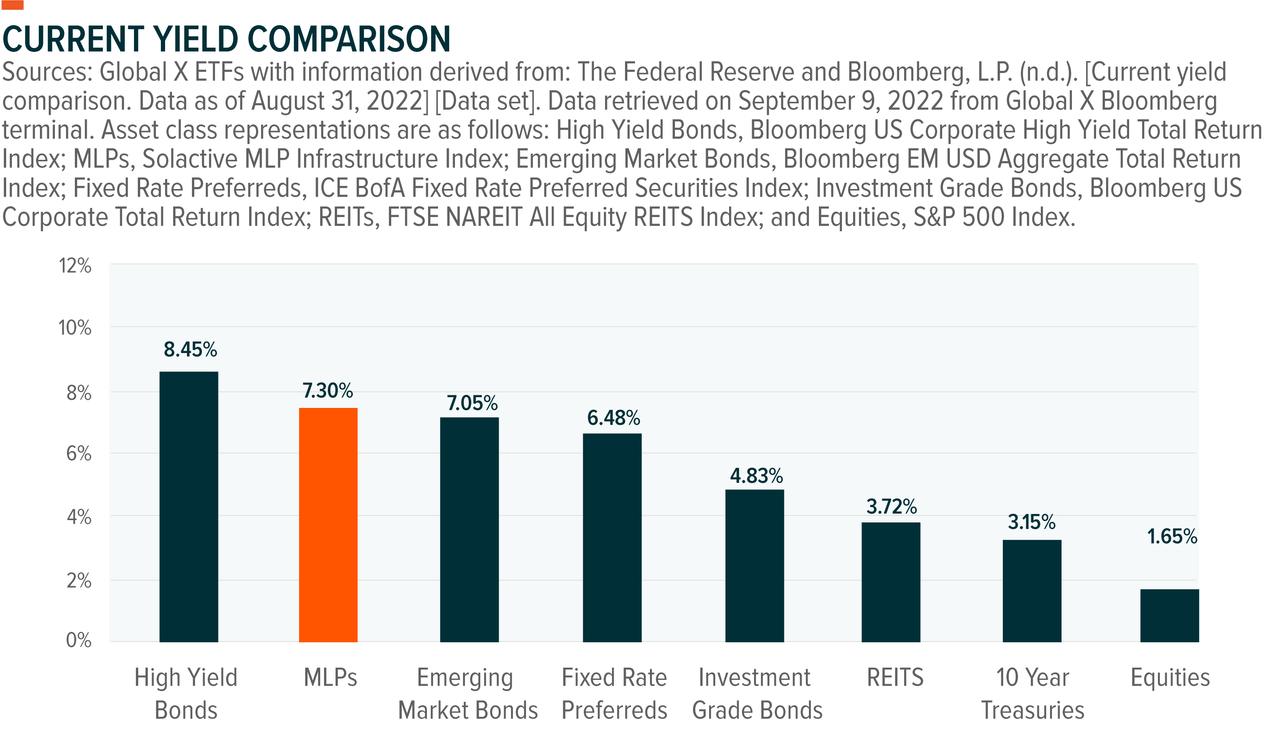
For yield-seeking investors, MLPs posted an attractive current yield of 7.3% as of August, substantially higher than the average yield of equities. Also, midstream distributions remained strong, increasing 2.68% to $0.51 per share in Q2 2022.17 Steady midstream cash flows may permit further distributions and share buybacks.
Conclusion: Outlook for Midstream and MLPs Remains Positive
We expect the oil market to remain volatile in this higher inflationary environment, as interest rates rise. China may have a big say in oil prices given recent sluggish economic activity due to its zero-COVID policy and real estate crisis.18 However, we believe the midstream space can be an attractive potential income alternative for investors. Oil supply in the global market remains tight, and U.S. domestic producers appear well-positioned to step in to meet rising oil demand from Europe.
FOOTNOTES
1. Bloomberg, L.P. (n.d.). [Data from March 1, 2022 to August 24, 2022] [Data set]. Data retrieved on September 9, 2022 from Global X Bloomberg terminal.
2. Cocklin, J. (2022, August 16). U.S. natural gas price volatility at all-time high in 2022. Natural Gas Intelligence (NGI). U.S. Natural Gas Price Volatility at All-Time High in 2022 – Natural Gas Intelligence
3. Schneider, H. (2022, August 18). Fed minutes show more rate hikes in the pipeline, but pace could slow. Reuters. Fed minutes show more rate hikes in the pipeline, but pace could slow
4. Bloomberg, L.P. (n.d.). [Correlation between oil and Bloomberg dollar spot index, Generic CL Future Comdty used for Oil and Bloomberg Dollar Spot Index used for Dollar. Data from August 31, 2012 to August 31, 2022] [Data set]. Data retrieved on September 9, 2022 from Global X Bloomberg terminal.
5. Bloomberg, L.P. (n.d.). Based on Solactive MLP & Energy Infrastructure Index. Data based on weighted average as of August 16, 2022. Data retrieved on September 9, 2022 from Global X Bloomberg terminal.
6. Bloomberg, L.P. (n.d.). [U.S. Energy Information Administration (EIA) natural gas forecast total dry gas production] [Data set]. Data as of and retrieved on September 10, 2022 from Global X Bloomberg terminal.
7. Bloomberg, L.P. (n.d.). [Generic CL Future Comdty and by Solactive MLP & Energy Infrastructure Index Correlation, Data from August 24, 2012 to August 24, 2022] [Data set]. Data retrieved on September 20, 2022 from Global X Bloomberg terminal.
8. Bloomberg, L.P. (n.d.). [Dow Jones U.S. Select Oil Exploration & Production Index and Generic CL Future Comdty Correlation, Data from August 24, 2012 to August 24, 2022] [Data set]. Data retrieved on September 20, 2022 from Global X Bloomberg terminal.
9. Bloomberg, L.P. (n.d.). [Generic CL Future Comdty and S&P MLP Index Correlation, Data from June 1, 2014 to June 1, 2016] [Data set]. Data retrieved on September 20, 2022 from Global X Bloomberg terminal.
10. Railroad Commission of Texas (RRC). (n.d.). Major oil and gas formations: Permian basin. Accessed on September 13, 2022 from Permian Basin
11. U.S. Energy Information Administration (EIA). (2022, September 7). Short-term energy outlook. U.S. Energy Information Administration – EIA – Independent Statistics and Analysis
12. Buckley, K. (2022, May 31). Permian basin oil production predicted to outpace most oil-producing nations this year. Houston Chronicle. Permian Basin oil production predicted to outpace most oil-producing nations this year
13. Forbes. (2022, February 1). Exxon, Chevron Promise Permian Basin Shale Production Boost. Exxon, Chevron Promise Permian Basin Shale Production Boost
14. U.S. Energy Information Administration (EIA). (2022, September 7). Short-term energy outlook. Short-Term Energy Outlook
15. U.S. Energy Information Administration (EIA). (2022, August 4). Today in energy: Pipeline projects announced to expand Permian natural gas capacity. Pipeline projects announced to expand Permian natural gas capacity
16. Boesler, M. (2022, August 11). Fed leaders, unswayed by softer CPI, see rate hikes into 2023. Bloomberg. https://www.bloomberg.com/news/articles/2022-08-10/evans-says-fed-to-raise-rates-into-next-year-to-curb-inflation
17. Global X ETFs MLPA Report analysis. MLPA 30-day SEC yield: 4.48%. The performance data quoted represents past performance. The performance data quoted represents past performance and does not guarantee future results. Investment return and principal value of an investment will fluctuate so that an investor’s shares, when sold or redeemed, may be worth more or less than their original cost. Current performance may be higher or lower than the performance quoted. High short-term performance, when observed, is unusual and investors should not expect such performance to be repeated. Click here for fund’s prospectus.
18. Shaban, H. (2022, August 15). China’s surprise rate cut, economic slowdown send oil prices plunging. The Washington Post. China’s surprise rate cut, economic slowdown send oil prices plunging
GLOSSARY
Correlation: A measure that shows how two securities move in relation to each other. A correlation of 1 implies that the securities will exhibit the same price movements. A correlation of 0 means the securities demonstrate completely unrelated price movements. A negative 1 correlation implies that the securities move in same size and opposite directions from one another.
Power Baseload Prices: The price for baseload power which is the electricity demand required to be supplied at any given time.
S&P 500 Index: The index includes 500 leading U.S. companies and captures approximately 80% coverage of available market capitalization.
Solactive MLP Infrastructure Index: The Solactive MLP Infrastructure Index is intended to give investors a means of tracking the performance of the energy infrastructure MLP asset class in the United States. The index is composed of Midstream MLPs engaged in the transportation, storage, and processing of natural resources.
Solactive MLP & Energy Infrastructure Index: The Solactive MLP & Energy Infrastructure Index is intended to give investors a means of tracking the performance of MLPs and energy infrastructure corporations. Midstream energy infrastructure MLPs and corporations principally own and operate assets used in energy logistics, including, but not limited to, pipelines, storage facilities and other assets used in transporting, storing, gathering, and processing natural gas, natural gas liquids, crude oil or refined products.
Dow Jones U.S. Select Exploration & Production Index: The Dow Jones U.S. Select Oil Exploration & Productions Index measures companies engaged in the exploration for and drilling, production, refining and supply of oil and gas products.
This information is not intended to be individual or personalized investment or tax advice. Please consult a financial advisor or tax professional for more information regarding your tax situation. Indices are unmanaged and do not reflect the effect of fees. One cannot invest directly in an index.
Investing involves risk, including possible loss of principal. International investments may involve risk of capital loss from unfavorable fluctuation in currency values, from differences in generally accepted accounting principles or from economic or political instability in other nations. Emerging markets involve heightened risks related to the same factors as well as increased volatility and lower trading volume.
Investments in securities of MLPs involve risk that differ from investments in common stock including risks related to limited control and limited rights to vote on matters affecting the MLP. MLP common units and other equity securities can be affected by macro-economic and other factors affecting the stock market in general, expectations of interest rates, investor sentiment towards MLPs or the energy sector, changes in a particular issuer’s financial condition, or unfavorable or unanticipated poor performance of a particular issuer (in the case of MLPs, generally measured in terms of distributable cash flow). The Global X MLP Funds invest in the energy industry, which entails significant risk and volatility. The Funds invest in small and mid-capitalization companies, which pose greater risks than large companies. The Funds are non-diversified. Current and future holdings are subject to risk.
MLPA has a different and more complex tax structure than traditional ETFs and investors should consider carefully the significant tax implications of an investment in the Fund. MLPA is taxed as a regular corporation for federal income tax purposes, which differs from most investment companies. Due to its investment in MLPs, the fund will be obligated to pay applicable federal and state corporate income taxes on its taxable income as opposed to most other investment companies. The fund expects that a portion of the distributions it receives from MLPs may be treated as tax-deferred return of capital. The amount of taxes currently paid by the fund will vary depending on the amount of income and gains derived from MLP interests and such taxes will reduce an investor’s return from an investment in the fund. The fund will accrue deferred income taxes for any future tax liability associated certain MLP interests. Upon the sale of an MLP security, the fund may be liable for previously deferred taxes which may increase expenses and lower the fund’s NAV.
The potential tax benefits from investing in MLPs depend on them being treated as partnerships for federal income tax purposes. If the MLP is deemed to be a corporation then its income would be subject to federal taxation at the entity level, reducing the amount of cash available for distribution to the fund which could result in a reduction of the fund’s value.
Bonds and bond funds will decrease in value as interest rates rise. High yield bonds involve greater risks of default or downgrade and are more volatile than investment grade securities, due to the speculative nature of their investments. Real estate and REIT investments are subject to changes in economic conditions, credit risk and interest rate fluctuations. Emerging markets involve heightened risks related to the same factors as well as increased volatility and lower trading volume. Preferred stock is subject to many of the risks associated with debt securities, including interest rate risk. In addition, preferred stock may not pay a dividend, an issuer may suspend payment of dividends on preferred stock at any time, and in certain situations an issuer may call or redeem its preferred stock or convert it to common stock. U.S. Treasury securities are considered to be of high credit quality and are backed by the full faith and credit of the U.S. government. U.S. Treasury securities, if held to maturity, guarantee a return of principal while no other securities mentioned in this material offer such a guarantee.
Shares of ETFs are bought and sold at market price (not NAV) and are not individually redeemed from the Fund. Brokerage commissions will reduce returns.
Carefully consider the Funds’ investment objectives, risk factors, charges, and expenses before investing. This and additional information can be found in the Funds’ summary and full prospectuses, which may be obtained by calling 1-888-GX-FUND-1 (1-888-493-8631), or by visiting www.globalxetfs.com. Read the prospectus carefully before investing.
Global X Management Company, LLC serves as an advisor to the Global X Funds. The Funds are distributed by SEI Investments Distribution Co., which is not affiliated with Global X Management Company, LLC.
Editor’s Note: The summary bullets for this article were chosen by Seeking Alpha editors.
Be the first to comment