

AlexLMX/iStock via Getty Images
Thesis
Adobe (NASDAQ:ADBE) recently announced its plan to acquire collaborative design platform Figma for $20B. Figma specializes in platforms that allow multiple users to work and collaborate on projects digitally. At a strategic level, the acquisition certainly makes sense given the ample opportunities for synergies in creative content creation and editing. As to the price tag of the deal, it has been discussed by many other Seeking Alpha authors already and I won’t further add to it.
Here, I will analyze another aspect of the acquisition: the hidden cost beyond the monetary cost. The Figma acquisition reminds me of the pending acquisition of Activision Blizzard (ATVI) by Microsoft (NASDAQ:MSFT) also. And I think the cost is best illustrated by a comparison between these two acquisitions. They are both sizable. The Activision Blizzard deal is worth around $70 billion, and it is the largest acquisition in MSFT’s history. The deal also provides excellent synergistic opportunities with MSFT’s existing gaming segments. And also, both ADBE and MSFT are comparable peers in the SaaS space (though there are differences to be elaborated on in the next section). Finally, given that Figma is a private company and access to its financial information is more difficult, some extrapolation of the Activision deal is necessary and could provide insights that are difficult to obtain otherwise.
My overall rating for both stocks is neutral. And the rating is based on the following two considerations:
- These acquisitions may come at a dilution of their long-term profitability. Both ADBE and MSFT (especially ADBE) are superbly profitable businesses, which can be a curse when it comes to acquisitions. As you will see later, there are simply not that many acquisition targets that can match their profitability, and very likely Figma’s profitability is inferior to ADBE’s (just like Activision’s profitability is inferior to MSFT’s).
- Despite the profitability dilution, both stocks still offer solid return potentials at their current level in the long term in my opinion. I think both still provide returns potential and safety better than the overall market. And ADBE’s more expensive valuation (28.7x PE compared to MSFT’s 25.2x PE) is probably well justified, because I think it actually provides a better return potential than MSFT despite the valuation premium. But all told, the upside is limited for both stocks and the margin of safety is relatively thin.
With this, I will dive into the specifics and look at acquisitions in more detail.
Source: Seeking Alpha data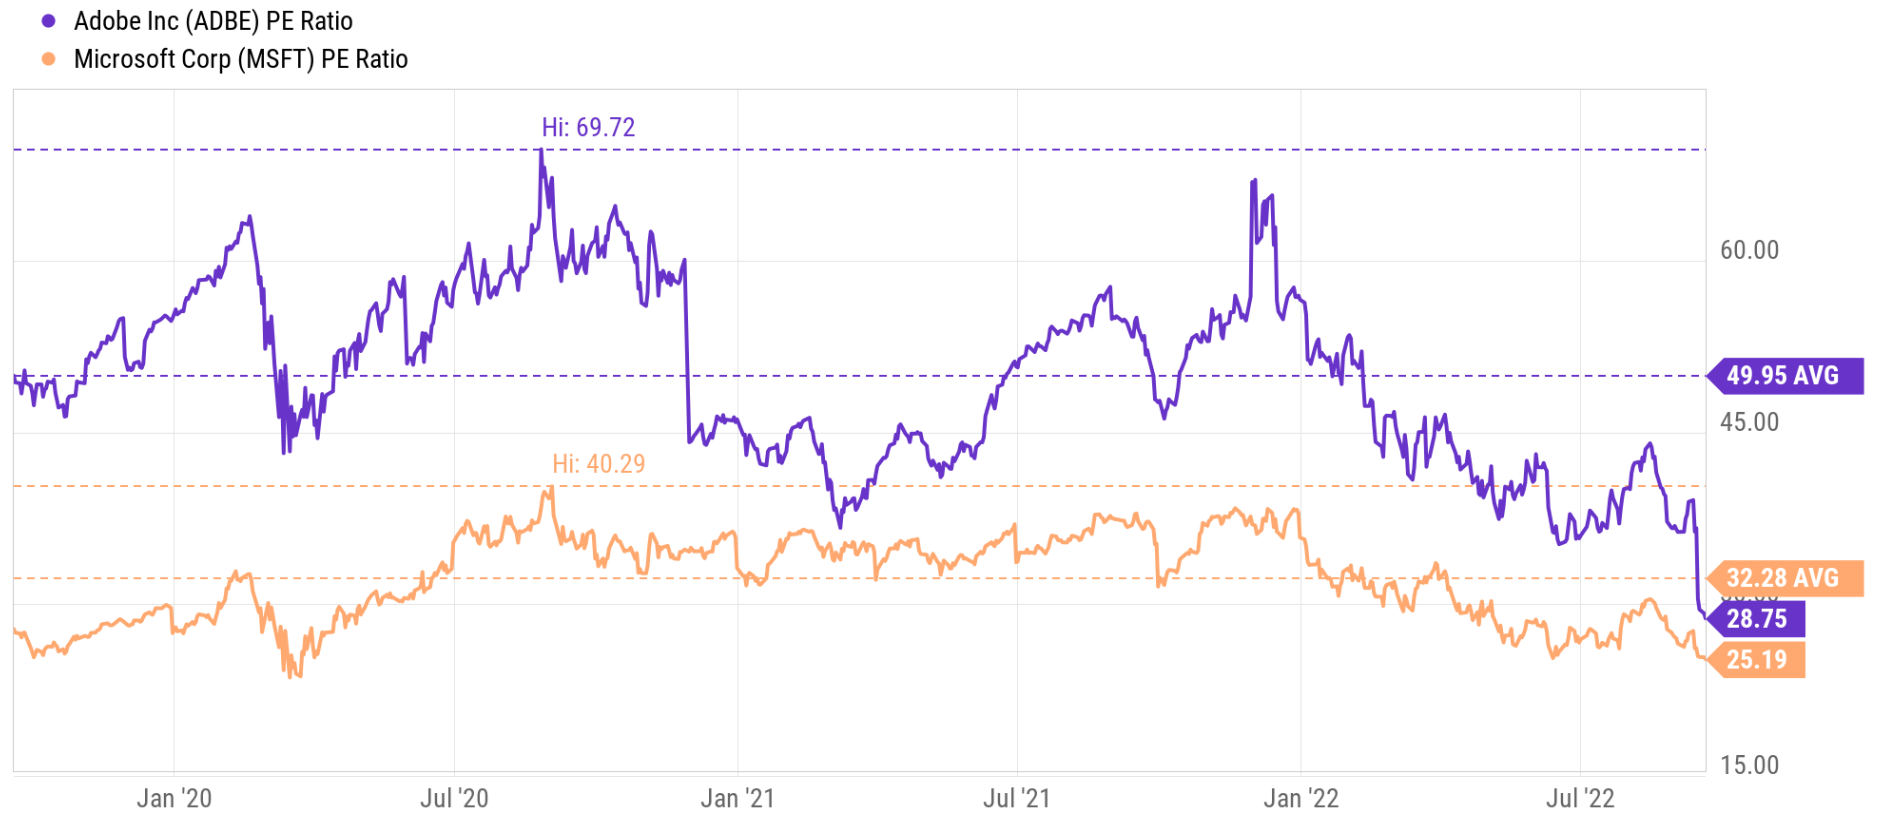
Return on capital employed (“ROCE”)
As seen from the chart above, ADBE has historically traded at a significant valuation premium compared to Microsoft. Its average PE ratio has been almost 50x in the past three years, compared to about 32x from Microsoft, a valuation premium of more than 56%. And even after its recent large corrections, it is currently still at a premium compared to Microsoft by about 14% (28.7x PE compared to MSFT’s 25.2x PE). Such valuation premium is arguably well-deserved when their profitability is considered.
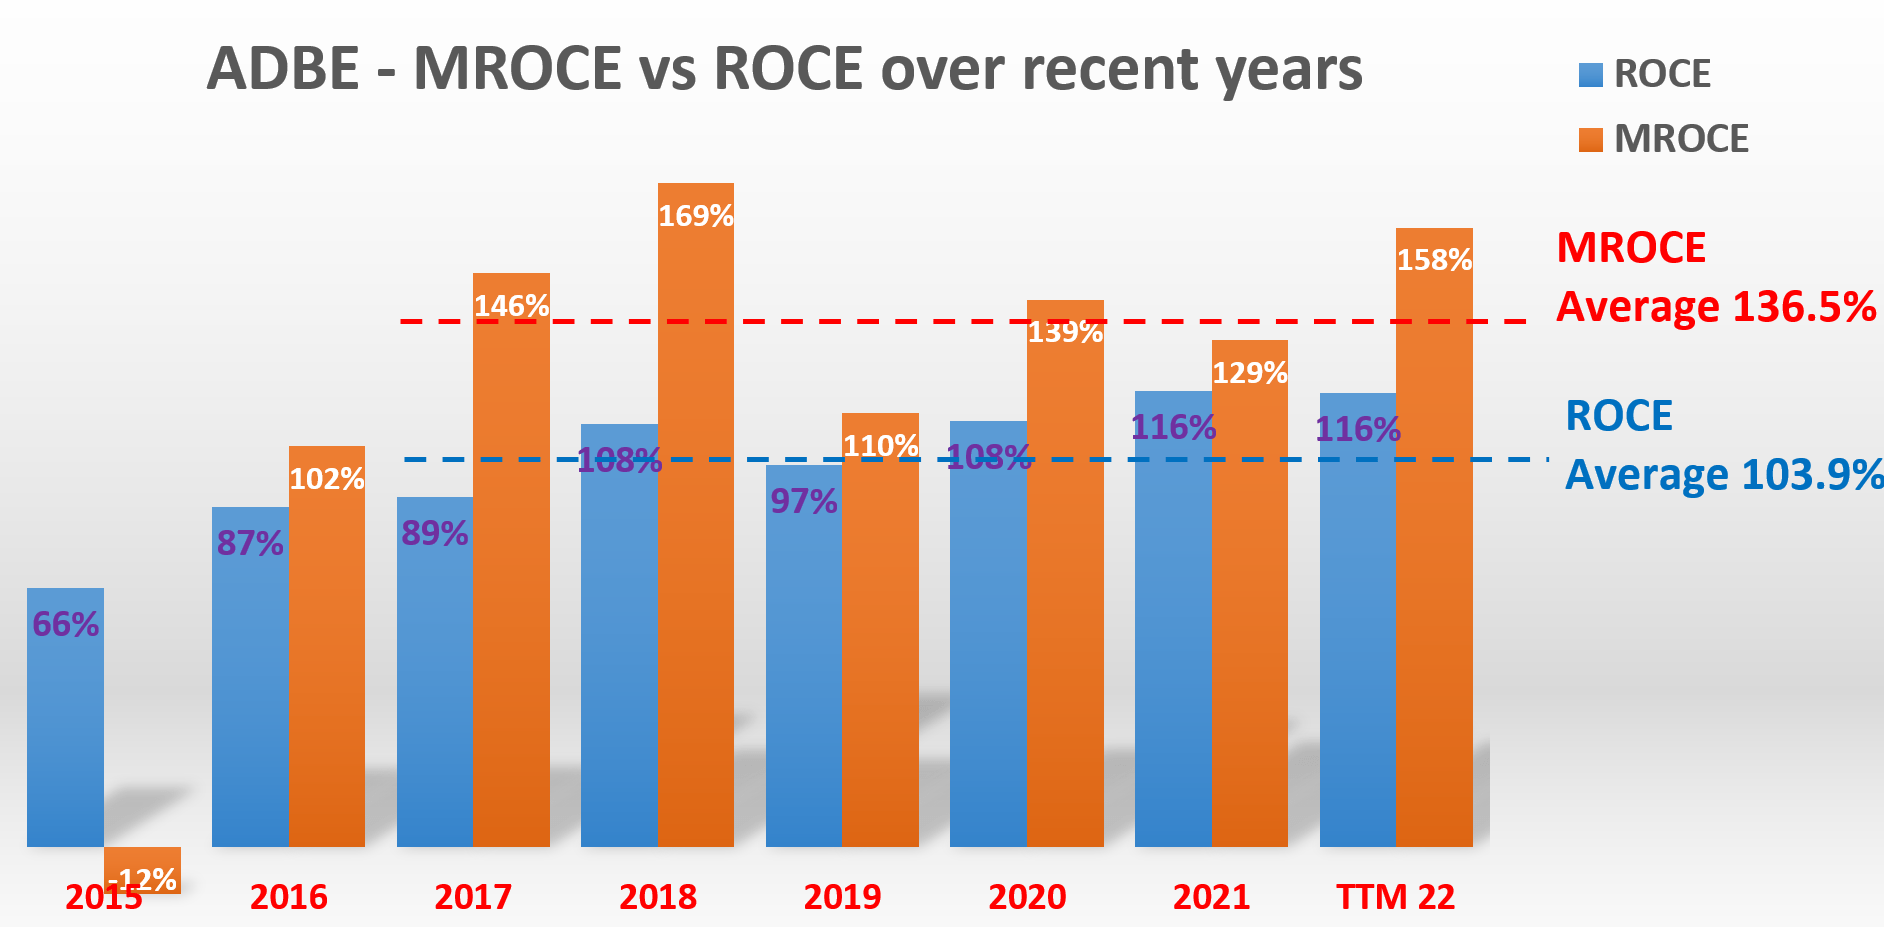
As explained in our earlier writings, to us, the most important profitability measure is ROCE (return on capital employed) because it considers the return of capital ACTUALLY employed. And the chart below compares the ROCE ADBE to that of MSFT. As seen, ADBE’s ROCE has been consistently and considerably above MSFT since 2016. ADBE’s ROCE has been on a steady upward trend since then, rising from about 63% to the current level of 117%. And its average ROCE in recent years has been a spectacular 103.9%. In comparison, MSFT ROCE has hovered around 60%. In recent years, its average ROCE has been 63.9%, only about 1/2 of ADBE’s current profitability.
However, when we take a broader view, both ABDE and MSFT’s ROCE are super compared to not only the general economy but also to overachievers such as the FAAMG pack. The FAAMG group features an average ROCE of around 50% in recent years, and Apple (AAPL) is the only stock that has a ROCE better than MSFT by a meaningful margin in this group.
It is certainly a good thing to have superb profitability. However, it becomes its own curse when it comes to acquisitions. Because there are simply not that many targets out there with these levels of profitability. And the acquisition of a firm with a lower ROCE can be dilutive to the profitability, as discussed next.
Source: Author based on Seeking Alpha data
Marginal return on capital employed (“MROCE”)
ROCE tells us how profitable the business has been or is SO FAR. And here I will use the concept of marginal return on capital employed (“MROCE”) to shed insights into which direction the profitability is likely to go. Detailed background information on MROCE can be found in my earlier article here. And a brief summary is provided here to facilitate this discussion for readers who are new to this concept.
What the MROCE concept captures is a basic law in economic activities: the law of diminishing returns. As illustrated in the next chart, a business will first invest its money at projects with the highest possible rate of return. Therefore, the first batch of available resources is invested at a high rate of return – the highest the business can possibly identify. The second batch of money will have to be invested at a somewhat lower rate of return since the best ideas have been taken by the first batch of resources already, and so on. And finally, the end result is a declining MROCE curve as shown.
Source: Author 
Warren Buffett commented on this concept on multiple occasions too. As an example, the following is a quote from his 1992 Berkshire Hathaway Shareholder Letter (the emphasis is added by me):
Leaving the question of price aside, the best business to own is one that over an extended period can employ large amounts of incremental capital at very high rates of return.
The operative here is “incremental capital”. A really good business not only has to enjoy a healthy return on its capital already invested (which is captured by ROCE), but also has to keep finding equally good or better opportunities to make future incremental investments including both organic reinvestments and acquisitions – which is captured in MROCE.
And you will see next how the acquisition would impact ABDE and MSFT’s MROCE.
ADBE and MSFT’s MROCE
The following chart shows the MROCE and ROCE for MSFT over recent years. The ROCE data are the same as those shown in the previous section. The MROCE data are estimated by the following steps. First, the capital employed was calculated for each year. Second, the earnings were calculated each year. Third, then the incremental capital employed year over year was calculated. Similarly, the incremental earnings year over year were also calculated. And finally, the ratio between the incremental earnings and incremental capital employed was calculated to approximate the MROCE. During years when there were large fluctuations in either the incremental earnings or the capital employed, a multi-year running average was taken to smooth the fluctuations.
The results show the consistency of MSFT’s profitability again. It has been earning a very healthy and consistent ROCE as just mentioned. And it has been consistently identifying lucrative opportunities to deploy incremental capital too – as reflected in the healthy MROCE. To wit, its MROCE in recent years has been completely on average 60.5%, very close to its ROCE of 63.9%, indicating future stability and sustainability.
The case for ADBE is even stronger as you can see from the second chart below. The MROCE data for ADBE was processed in the same way as for Microsoft above. And as you can see, its MROCE is on average 136.5% in recent years, even higher than its superb average ROCE of 103.9%. This means that if ADBE maintains its current marginal profitability, then its ROCE would further expand to 136.5%. So once again, the valuation premium is completely justified.
Source: Author based on Seeking Alpha data Source: Author based on Seeking Alpha data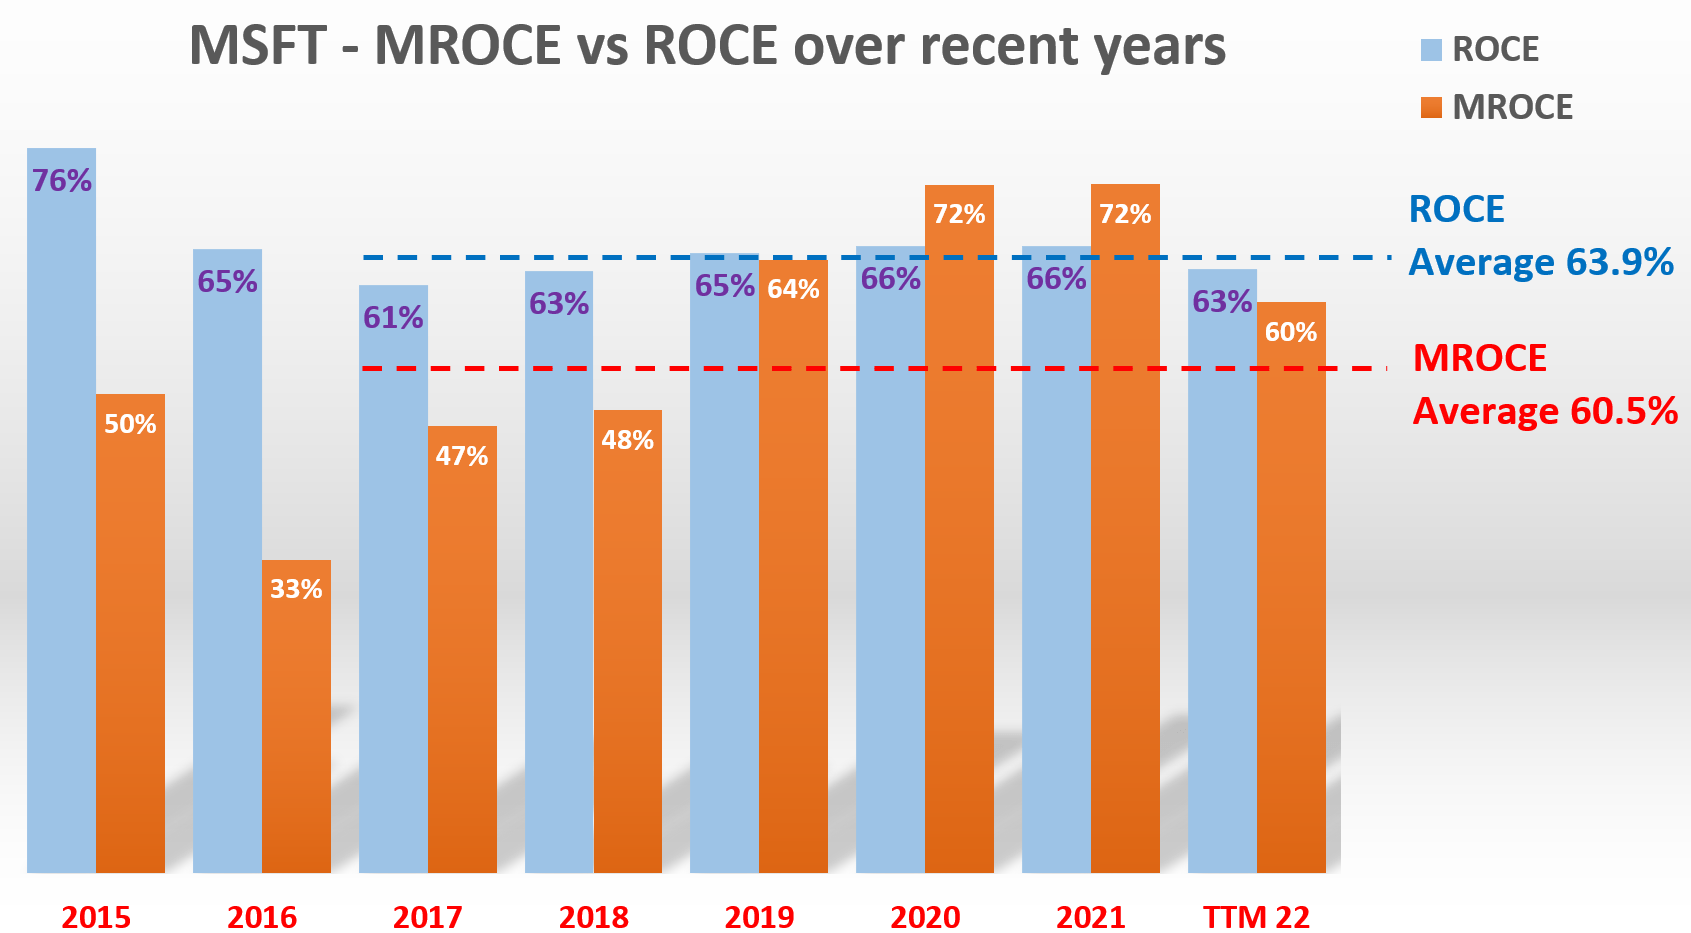
But in the pursuit of scale and accelerated growth via acquisitions, these companies may have to buy firms with lower profitability. And this is certainly the case with MSFT’s acquisition of Activision Blizzard. The next chart compares their return on invested capital (“ROIC”). ROIC is similar to ROCE and the subtle differences are detailed in my blog article here. As seen, MSFT’s ROIC is far superior to ATVI. MSFT’s ROIC currently stands at 34.9%, and ATVI at 13.55%, less than ½ of MSFT’s.
As aforementioned, Figma is a private company, and information about its ROCE or ROIC is difficult to obtain. However, simply because of the fact that ADBE’s profitability is at such an astronomical level, it’s reasonable to assume that Figma’s profitability will be nowhere near ADBE’s. As mentioned earlier, ADBE’s current ROCE is almost 2x higher than MSFT. And in terms of ROIC, it has closely tracked MSFT in recent years also as seen in the chart below.
Source: Seeking Alpha data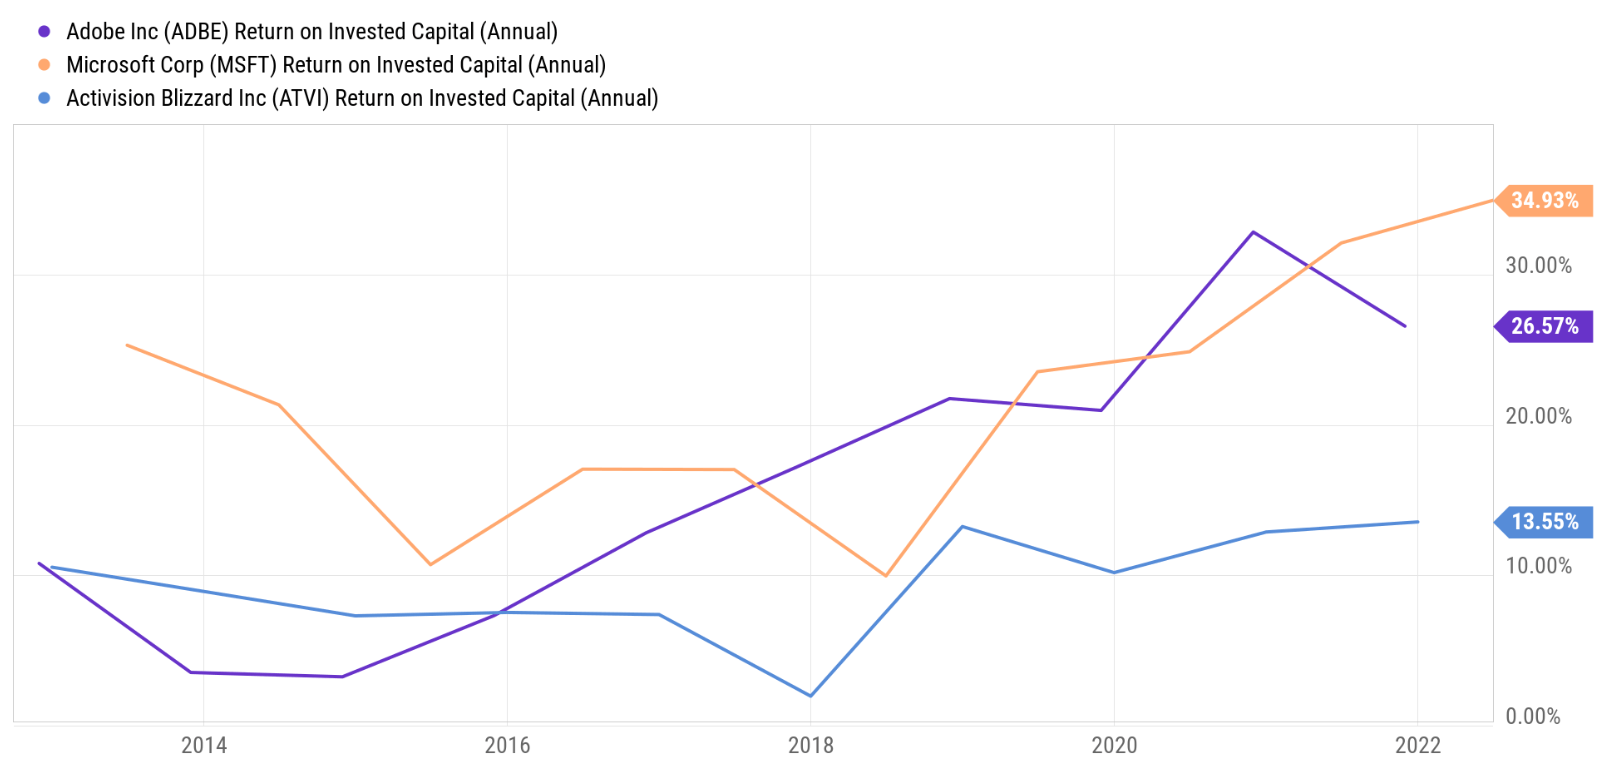
Expected return
Of course, the fact that ATVI’s ROIC is less than ½ of MSFT’s existing ROIC does not mean that after acquiring ATVI, MSFT’s profitability would drop by more than half. The dilution will need to be scaled by the size of the acquisition relative to MSFT’s existing size (more on this in the final section). However, the fact that both companies are willing to make sizable acquisitions despite the profitability dilution demonstrates the difficulty of maintaining scale and scalability at the same time.
In the long-term, investors should rely more on the organic growth rates for companies at their scales, instead of one-time events like these acquisitions. And the following chart summarizes my projections of their long-term growth and return potentials based on a roadmap that we use in our marketplace service to pick tactical holdings. As you can see, both ADBE and MSFT are projected to provide a double-digit annual return (“ROI”): about 10.5% for MSFT and about 12.8% for ADBE assuming a 10% reinvestment rate. And both offer far superior return potential compared to the overall market, projected to return about 7% under current conditions. The mechanism of this roadmap is detailed in our earlier article. In short,
- The long-term ROI for a business owner is simply the summation of two things: A) the price paid to buy the business and B) the long-term growth rate of the business. More specifically, part A is determined by the owner’s earning yield (“OEY”) when we purchased the business.
- Part B, the long-term growth rate, is governed by ROCE and the Reinvestment Rate. These are the two most important growth engines, and they mutually enhance each other.
- Longer-Term ROI = valuation + quality = OEY + Growth Rate = OEY + ROCE*Reinvestment Rate.
Source: Author based on Seeking Alpha data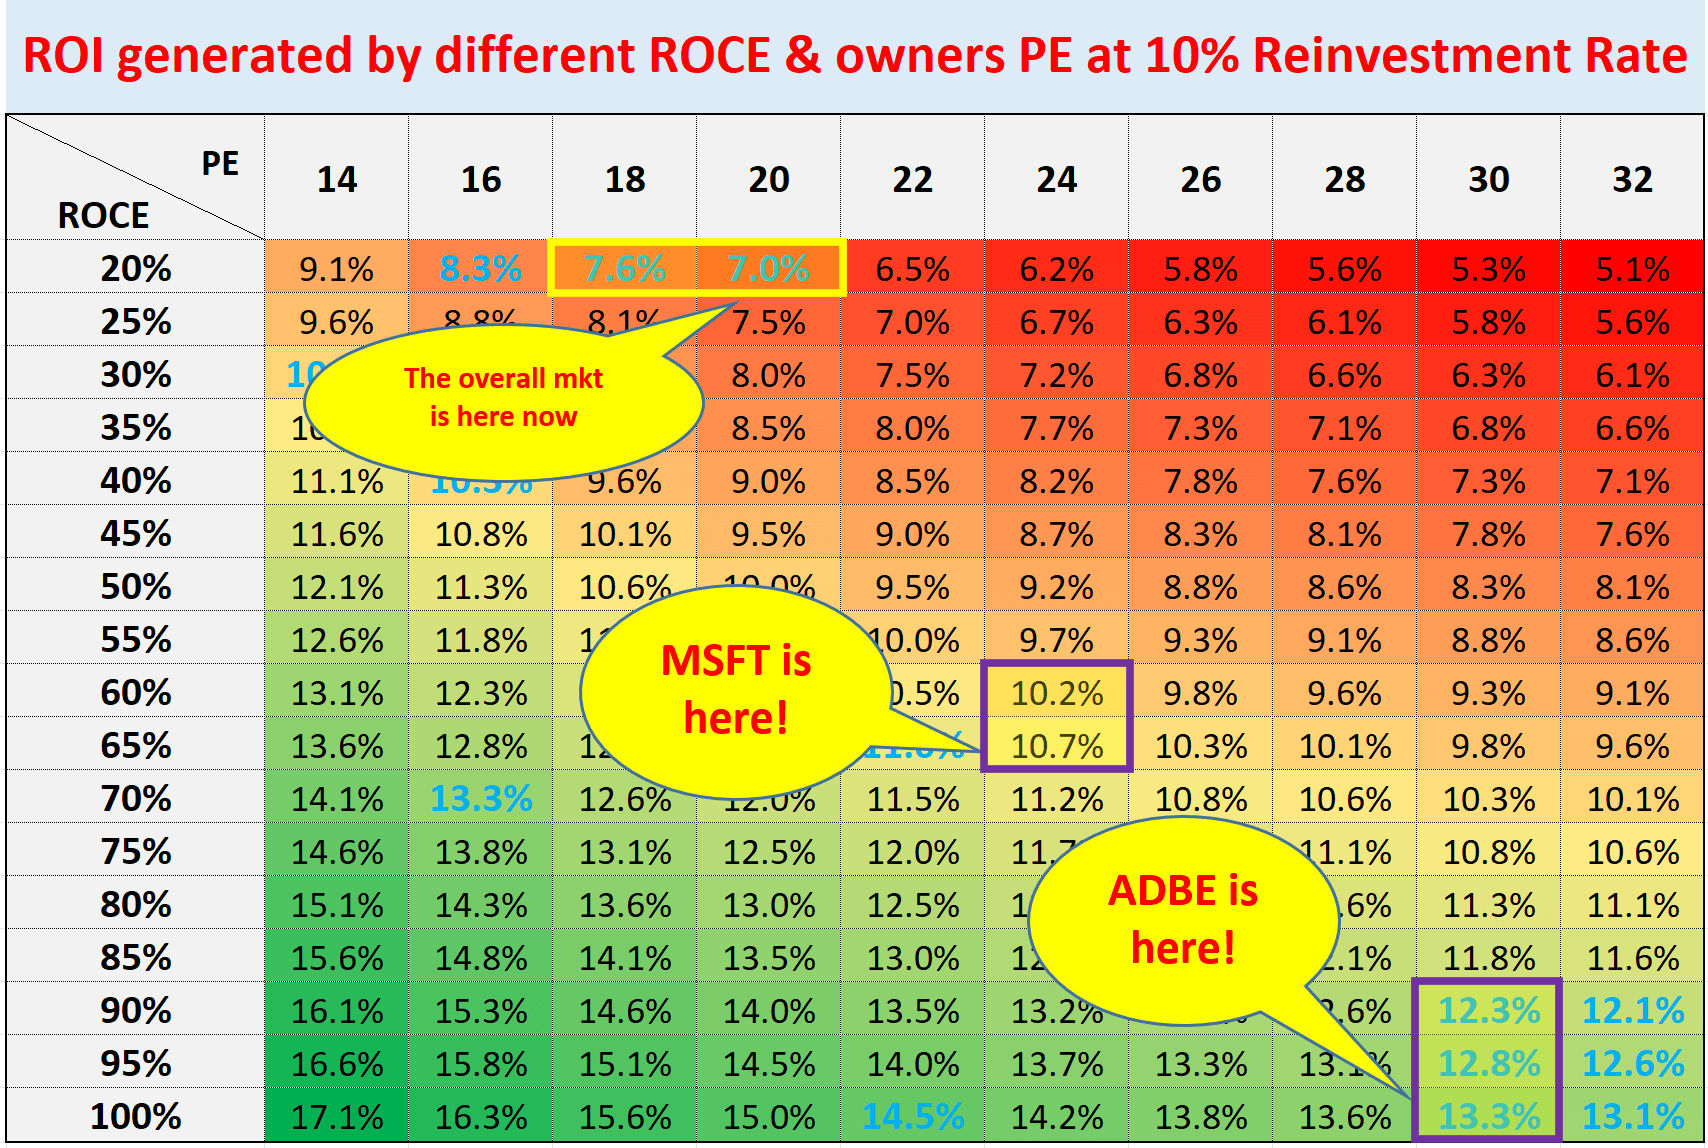
Risks and Final thoughts
To reiterate, in addition to the monetary price tag, the acquisitions for both ADBE and MSFT will have a hidden cost in terms of profitability dilution. And the dilution will need to be scaled by the size of the acquisition, at least in the short term. In MSFT’s case, the ATVI acquisition is valued at around $70B, about 3.8% of MSFT’s current market valuation of $1.83T. Therefore, as a result, the profitability dilution effect should be minimal. In ADBE’s case, the Figma acquisition is valued at $20B (to be paid by half stock and half cash). Hence, the acquisition is about 14.4% of ADBE’s current market valuation of $139B. Therefore, the profitability dilution effect would be more significant. The exact dilution will depend on Figma’s current ROCE and ROIC.
In addition to the above profitability dilution, there are also other risks associated with both MSFT and ADBE. The general risks have been discussed by other SA articles already and I won’t repeat them here anymore. Here, I will just mention the risks associated with acquisitions. The ATVI acquisition remains pending. CFO Amy Hood commented in the recent earnings release that MSFT still expects the acquisition to close by the end of the fiscal year. However, I expect the deal to be examined by the federal trade commission (“FTC”) very carefully as the acquisition might pose a substantial impediment to competition. In ADBE’s case, it said it expects the acquisition to add to earnings by the third year after the deal’s completion. A large deal at this scale with a 3-year timeline simply creates too many uncertainties, and shareholders could see setbacks along the way.
To conclude, the acquisition decisions from both MSFT and ADBE demonstrate the difficulty of expanding scale and maintaining scalability at the same time. As such, in the long-term, investors should rely more on the organic growth rates for companies with already-large scales, instead of one-time events like these acquisitions. And when the long-term growth rates are considered, both MSFT and ADBE still offer superior return potentials than the overall market. Patient long-term investors who need tech exposure should take a look here. However, given the limited upside potential, the relatively thin margin of safety in both cases, and especially the uncertainties associated with the Figma acquisition in the next ~3 years, my overall rating is neutral for both of them.
Be the first to comment