

claffra
Dr. Michael Burry, infamous for his big short against housing securities & derivatives in 2008, has long been a critic of passive investment vehicles since he publicly talked about them in 2019. This article outlines how, similar to 2008, Dr. Burry may have exposed yet another bubble that has been shaping for well over 25 years.
Yet this time it is not in the MBS/CDS/CDO market, but in the public equity markets. On this occasion, it’s linked with the formation of passive investment vehicles, the incorrect characterization of the efficient market hypothesis, and the consequences of the products built around those unfounded premises, supplemented with derivatives.
If our findings, and what academic research recently presented, are correct, this could be one of the most important pieces we have ever presented, as it has serious implications for financial markets.
The Inelastic Market Hypothesis
Our path begins with Dr. Burry, who in September 2021 cited a very interesting academic paper written by researchers at Harvard and the University of Chicago, “In Search of the Origins of Financial Fluctuations: The Inelastic Markets Hypothesis.” We will briefly discuss the study’s discoveries, but for those interested in the more extensive math, the full study can be found here.
National Bureau Of Economic Research
In short, the researchers developed a framework to analyze both theoretically and empirically the fluctuations of the overall stock market. Thus, unlike many other economic models, they also used practical data on top of theoretical data from the past to support their hypothesis. They noticed 4 main issues:
1 – Many funds are constrained
As they observe, households allocate capital to institutions, which are quite limited in what they can do because they operate under a fixed/ strict mandate. They are very inelastic.
Think of mutual funds, index funds, ETFs and other passive investment vehicles that usually have a restriction, e.g., that they must be 100% invested in equities, and offer 0 elasticity since they cannot hold bonds or other securities. Investment vehicles such as ETFs have an allergy to cash.
Even a mandate to invest, say, 70% in stocks imposes more restrictions on funds than people are aware of because they must try to get exactly close to that 70%, without much deviation.
In Search of the Origins of Financial Fluctuations: The Inelastic Markets Hypothesis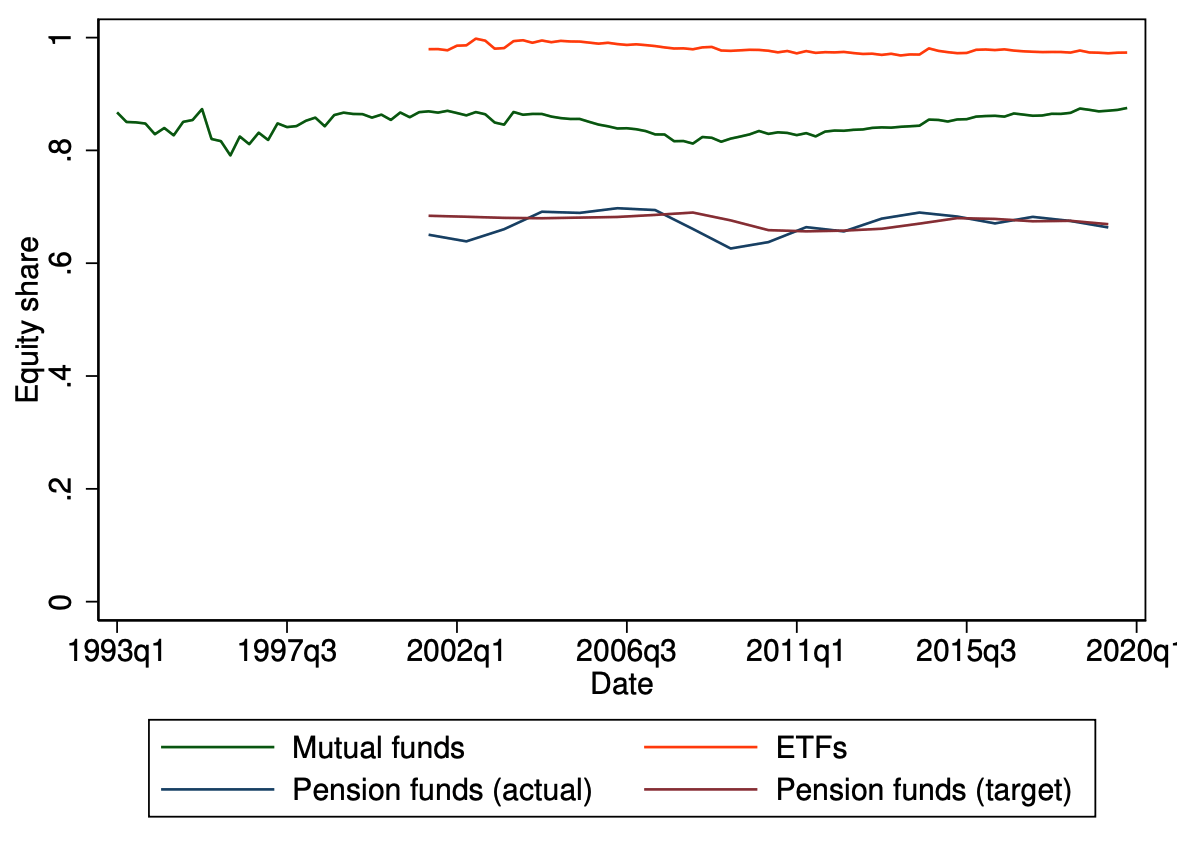
2 – Who would be the macro-elastic arbitrageurs?
But the fact that those funds are constrained doesn’t matter that much, right? Since you’d still have a lot of hedge funds acting as arbitrageurs to give elasticity to the market and act as arbitrageurs?
Well, in reality, hedge funds represent only 5% of the market according to the empirical data in several recently conducted studies. Moreover, they tend to reduce their allocations to equities in bad times, thus reducing their volume. We sometimes tend to forget that hedge funds can experience large outflows in bad times, or also have risk limitations.
So in effect, they have low or even negative elasticity to the markets. Unfortunately, hedge fund investors are also not immune to a recession/depression.
Hedge Fund Stock Trading in the Financial Crisis of 2007-2009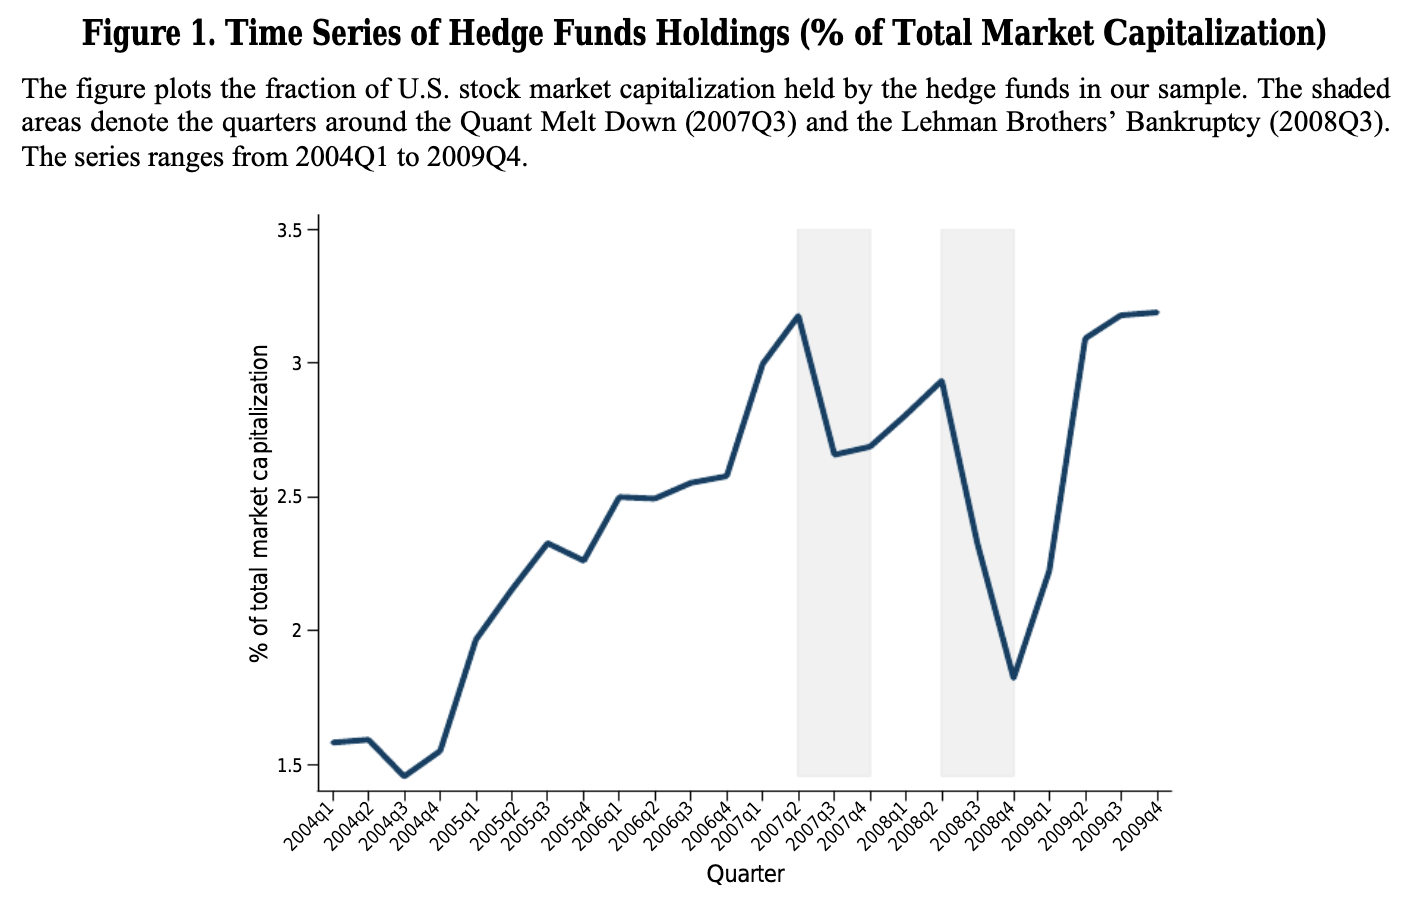
3 – Risk doesn’t move across sectors
The transfer of equity risk between investor sectors is also very small. Accordingly, risk shifts very little, such as from stocks to bonds or other assets. If something goes to stocks, it usually stays with stocks. Or, stocks stay with stocks, bonds stay with bonds, so very little elasticity between different sectors.
In numbers, on average, only 0.6% of the total value of the stock market is moved quarterly. This means that the demand elasticity of most investors is quite small. If they disagreed, we would see large flows in elastic markets, something quite implausible.
More so, since the early 1990s, we have not seen major flows when it comes to mutual funds, a behemoth. The passive bubble may have inflated slowly and steadily. The last time we really saw an outflow that was somewhat noticeable was in late 2002, in a fairly relentless 2-year bear market.
In Search of the Origins of Financial Fluctuations: The Inelastic Markets Hypothesis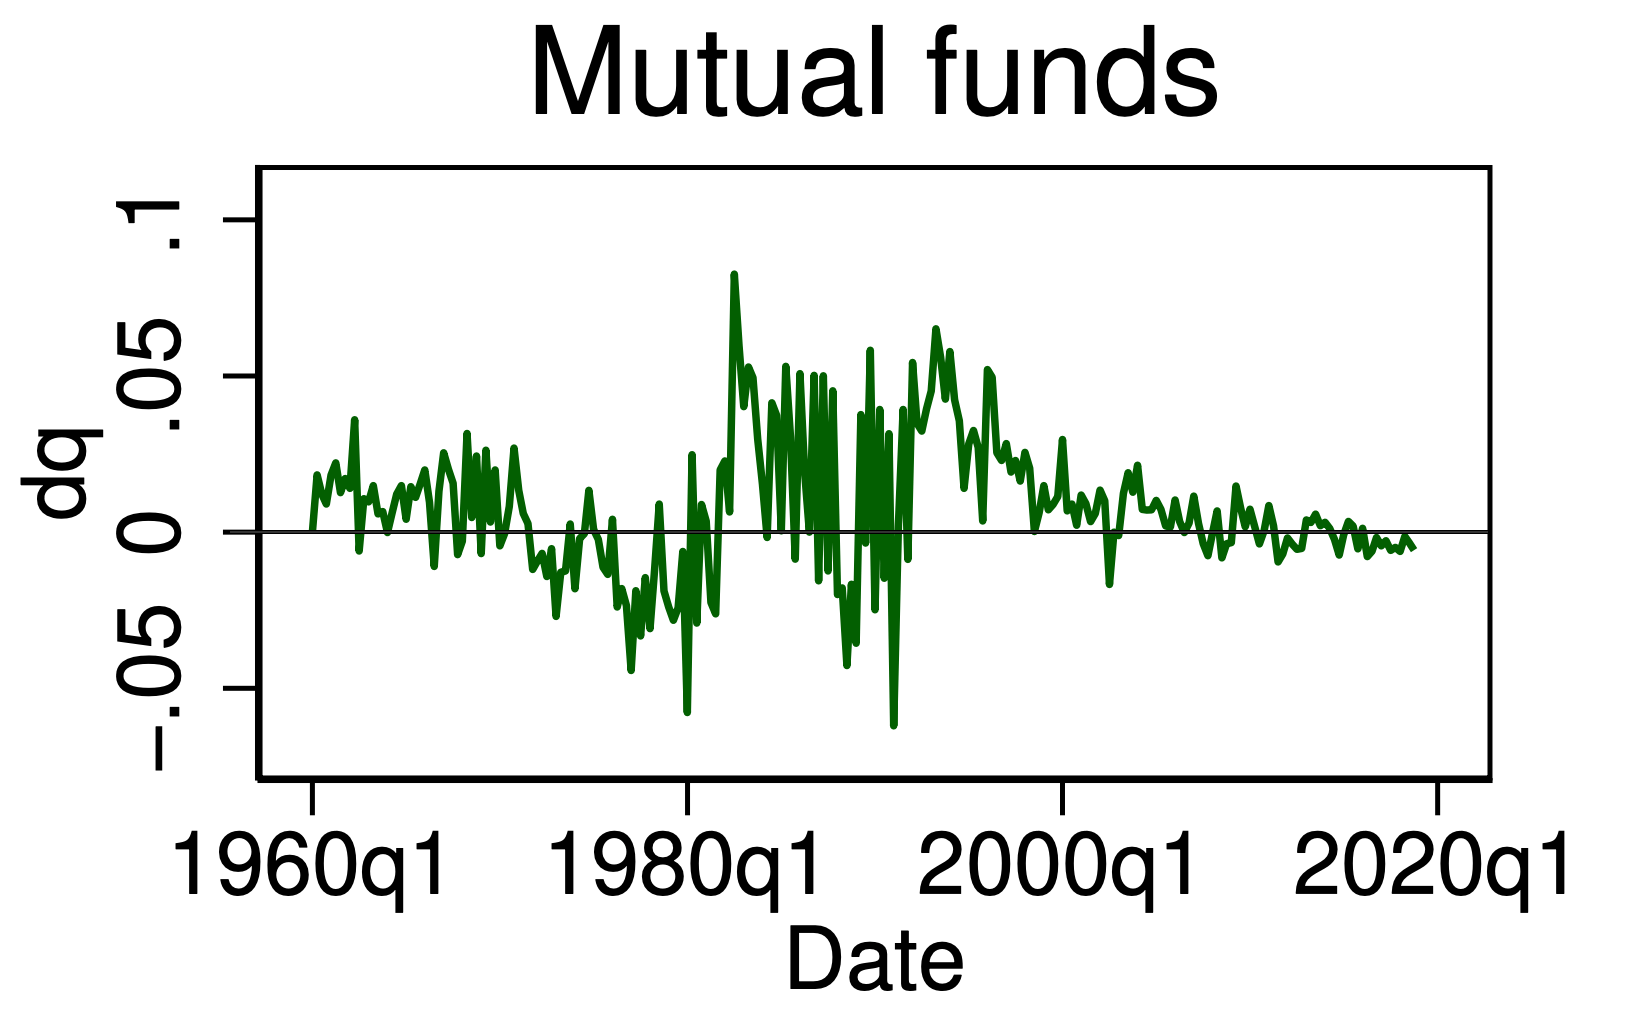
4 – Macro-Micro-elasticities
What continues to amaze us is the fact that in modern finance and literature, the efficient market hypothesis is still used as the basis for a huge amount of research. It is the same ideas that led us to the last crisis of 2008. All financial models are based on it, and between 1996 and 2007 the hypothesis was not even mentioned once in any FOMC manuscript.
The theory we represent is a hypothesis, but so is the efficient market hypothesis. And the products of Vanguard, BlackRock and others are not based on any such theory, that markets can be inefficient/ inelastic. The idea that the theory is still alive in academia, after 2008 and last year’s GameStop (GME) debacle, is beyond our comprehension. As Michael Burry once said in one of his most watched speeches, his 2012 UCLA Economics Department commencement address (emphasis added):
As it turns out information is not perfect, volatility does not define risk, markets are not efficient, the individual is adaptable. But the dark ages of finance allow no such light. Mainstream economists and finance practitioners, please check your premises. You have contradictions before you.
But back to inelastic markets. Their findings, supported by empirical data, show that mainstream economists with their models for the efficient market hypothesis are probably off by two orders of magnitude (100x) when it comes to elasticity. The macro-elasticity that the theorists say is about 20, when empirical data implies that it is theoretically lower than the micro-elasticity between stocks, which is 1.
With an implied macro elasticity of 0.2 instead of 20, the macro financial landscape looks very different. Especially when everything is built on a system that has proven to be flawed. An even more recent study with the title “How competitive is the stock market” also pointed out that his estimate is closer to 0.3, showing that markets are far, far from perfect.
In Search of the Origins of Financial Fluctuations: The Inelastic Markets Hypothesis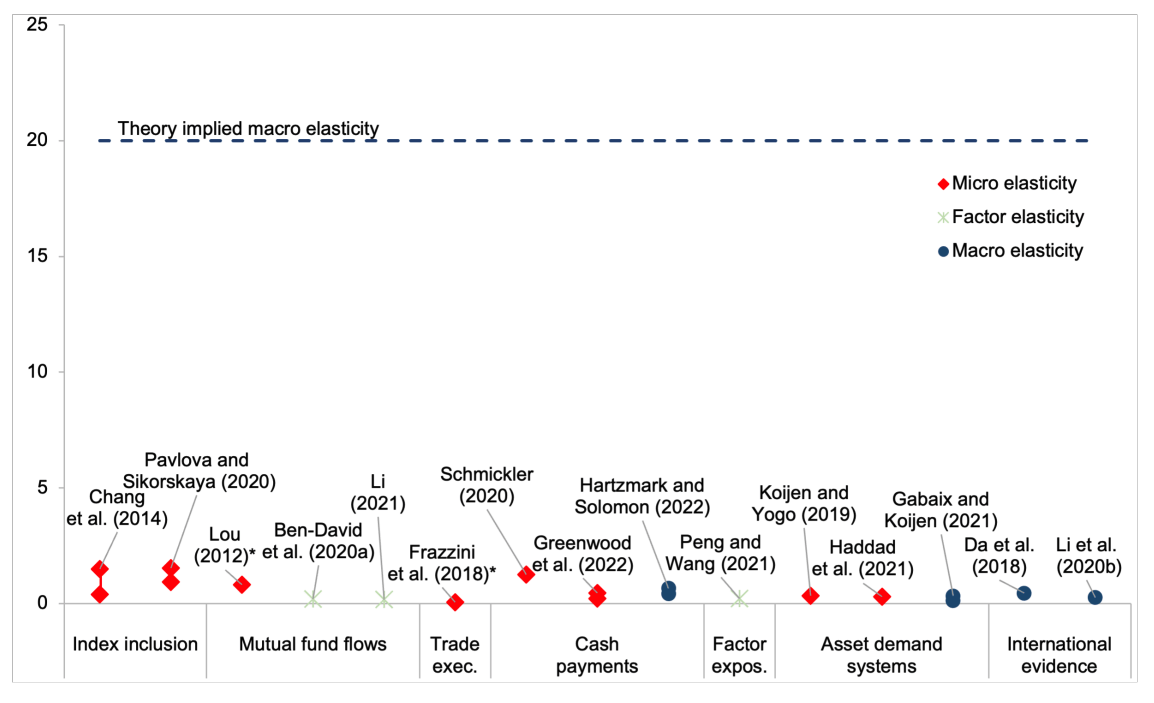
If the hypothesis is true, why would we care?
Well, it would mean that the price elasticity of aggregate demand in the stock market is small, and in particular that flows in and out of the stock market have large effects on prices. Their findings conclude that: “$1 invested in the stock market increases the total value of the stock market by about $5.”
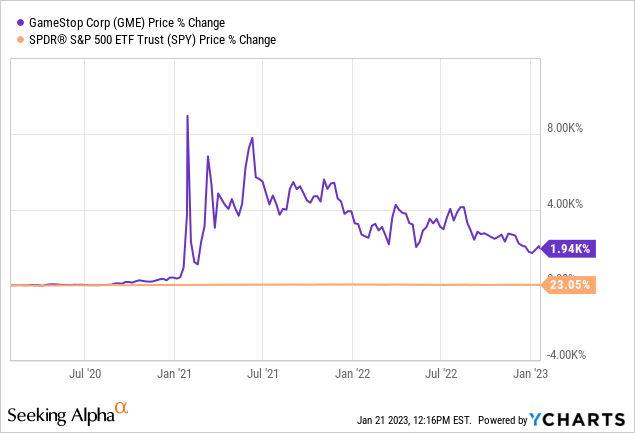
So that would also mean that at least 30% of stock market fluctuations are caused by flows. That could also be a very big reason for fluctuations in certain funds such as Ark Invest (ARKK), or stocks such as Tesla (TSLA), GameStop (GME), Bill Hwang’s Archegos, and others. It would also explain the high-flying stocks with low float from the dot-com bubble, which we will discuss later, and other phenomena such as a higher concentration of stocks in indexes such as the S&P 500 (SPY).
The Shift from Active to Passive Investing: Potential Risks to Financial Stability (Federal Reserve)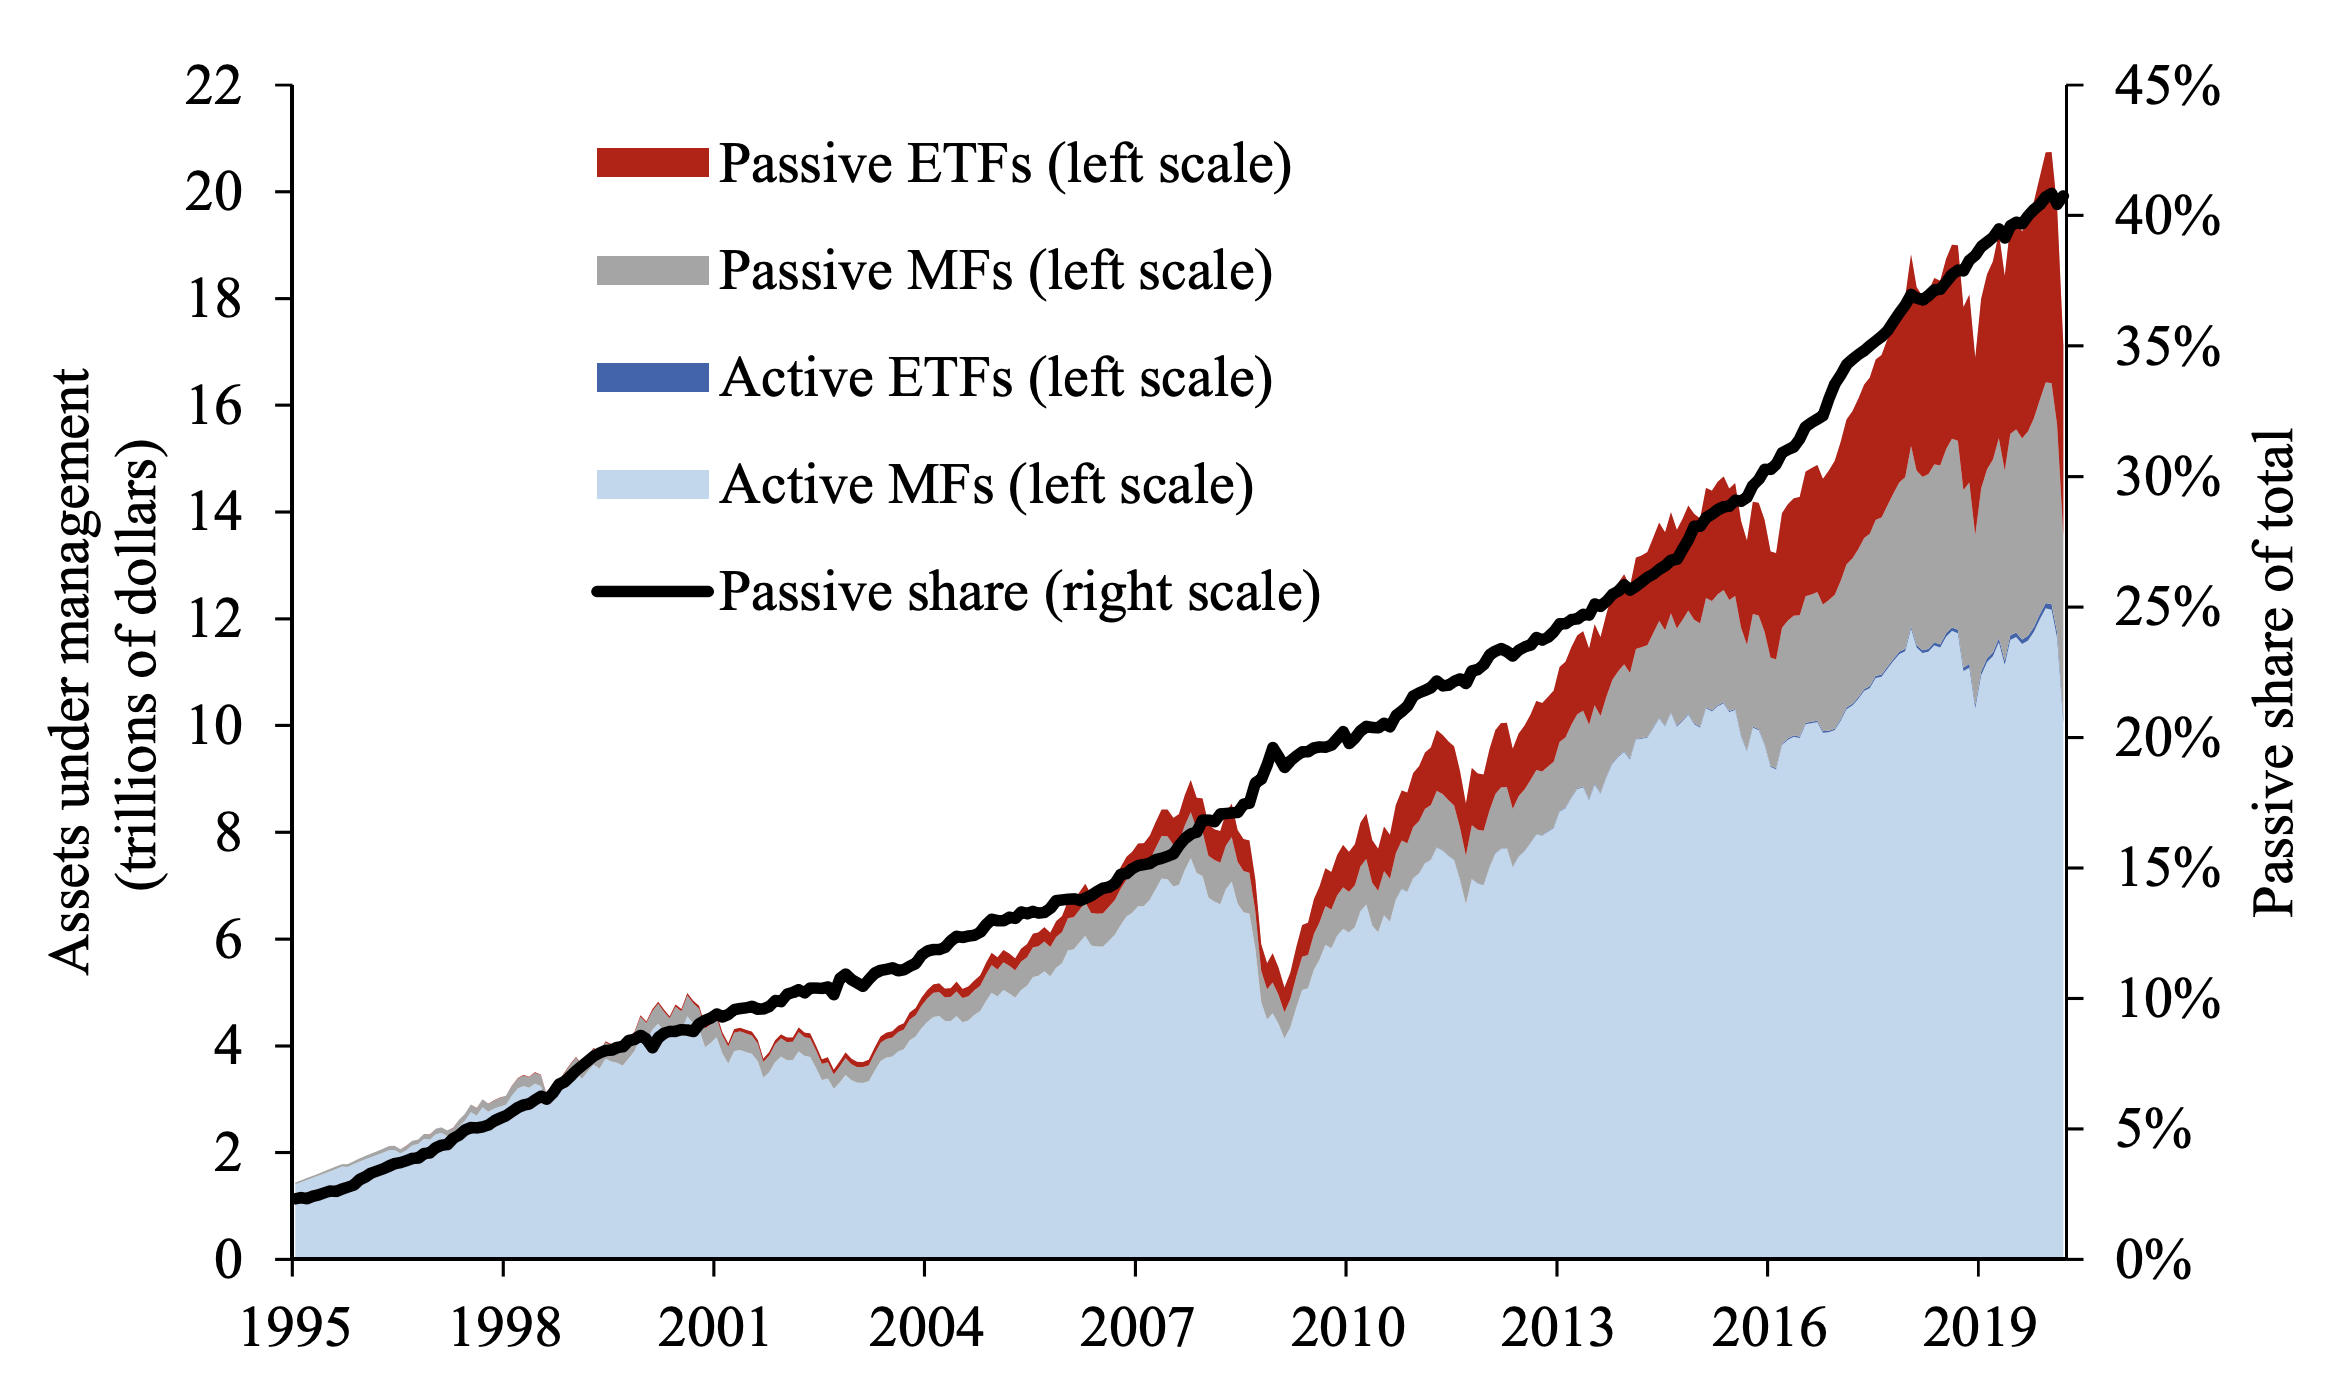
It would also mean that things like buybacks could have a very large impact on stock prices, which has not been the case in the past, when markets were considered completely elastic.
In traditional finance, the market value of stocks does not change at all with buybacks. In contrast, the study shows that in an inelastic universe, the value of shares increases, with a preliminary estimate of about $2 for every $1 of shares bought back instead of issuing a $1 dividend.
The Implications
Here is what Michael Burry had to say about the academic paper in a tweet (emphasis added):
If $5 incremental market value results from $1 added to stocks, and 90% of millenials (aka future wealth owners) are in passive market vehicles, that 5:1 ratio will get much, much sillier in time. COVID didn’t stop it. Inflation might (not). #epiphany (September 19, 2021).
In the study, one of their examples went like this: in the simplest version, a consumer can invest in two funds: a pure bond fund (100% bonds) and a mixed fund that invests in stocks and bonds according to a certain mandate – for example, that 80% of the fund’s assets should be invested in stocks and 20% in bonds.
They looked at what happens if the consumer sells $1 of the pure bond fund and invests that $1 in the mixed fund. Outcome: the mixed fund has to invest the inflow into stocks and bonds: which drives up stock prices in an inelastic market, which in turn makes the mixed fund (which has a mandate) want to invest more in stocks, drives up prices, and so on. In equilibrium, they find that the total value of the stock market rises by $5.
But that still leaves the question: what actually happens during a recession? The study analyzed one of the most recent recessions, between the second quarter of 2000 and the third quarter of 2002. Amazingly, households were the biggest sellers. But the amusing thing is that they sold only 0.5% (!) per quarter (not a typo). So, the largest outflows by sector only accounted for more than 2% on an annual basis.
In Search of the Origins of Financial Fluctuations: The Inelastic Markets Hypothesis
Flows essentially have a huge impact on prices/value depreciation and are positively correlated (/mean reverting). Let’s see what happened in the next crisis, in 2008.
In Search of the Origins of Financial Fluctuations: The Inelastic Markets Hypothesis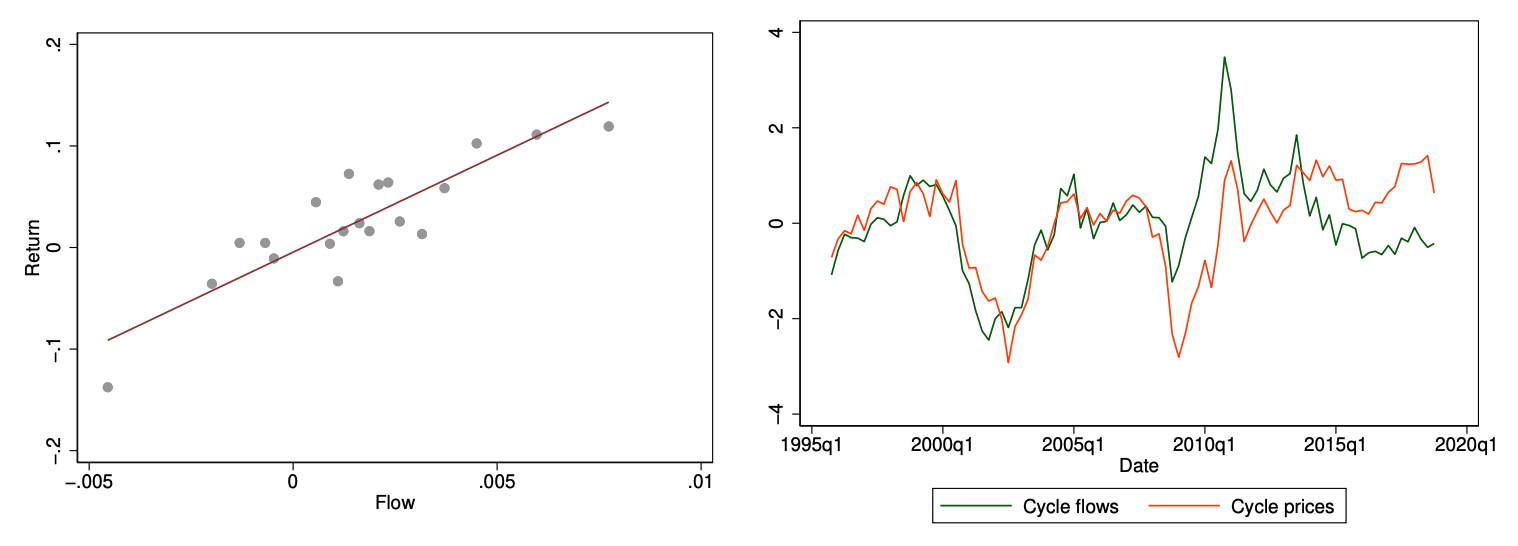
In 2008, selloffs were broadly the same, with households selling slightly more, about 0.6% per quarter, companies also selling stocks, while ETFs and the foreign and national/local pension funds continued to buy.
In Search of the Origins of Financial Fluctuations: The Inelastic Markets Hypothesis
In inelastic markets, QE for equities could become a reality, similar to QE for bonds. Looking back, we have seen the same price action in China and Japan, where the government intervened and bought stocks, resulting in a much larger effect than 1:1 (close to the 1:5, as observed in the study). The article was initially about financial fluctuations, because especially recently it has always been a mystery why markets remain so incredibly volatile.
And it certainly seems like they’re onto something. It would also clarify the volatility around earnings, which is unlike anything we’ve ever seen. Meta (META) dropping like a brick, report after report in tandem with Netflix (NFLX), wiping out hundreds of billions of dollars at a time. The market has just become so passive.
Why the lack of liquidity and excessive price movements around earnings? One thing is for sure, it’s certainly not Vanguard and BlackRock reacting to earnings, managing trillions. They are entirely non-responsive to financial information.
Bloomberg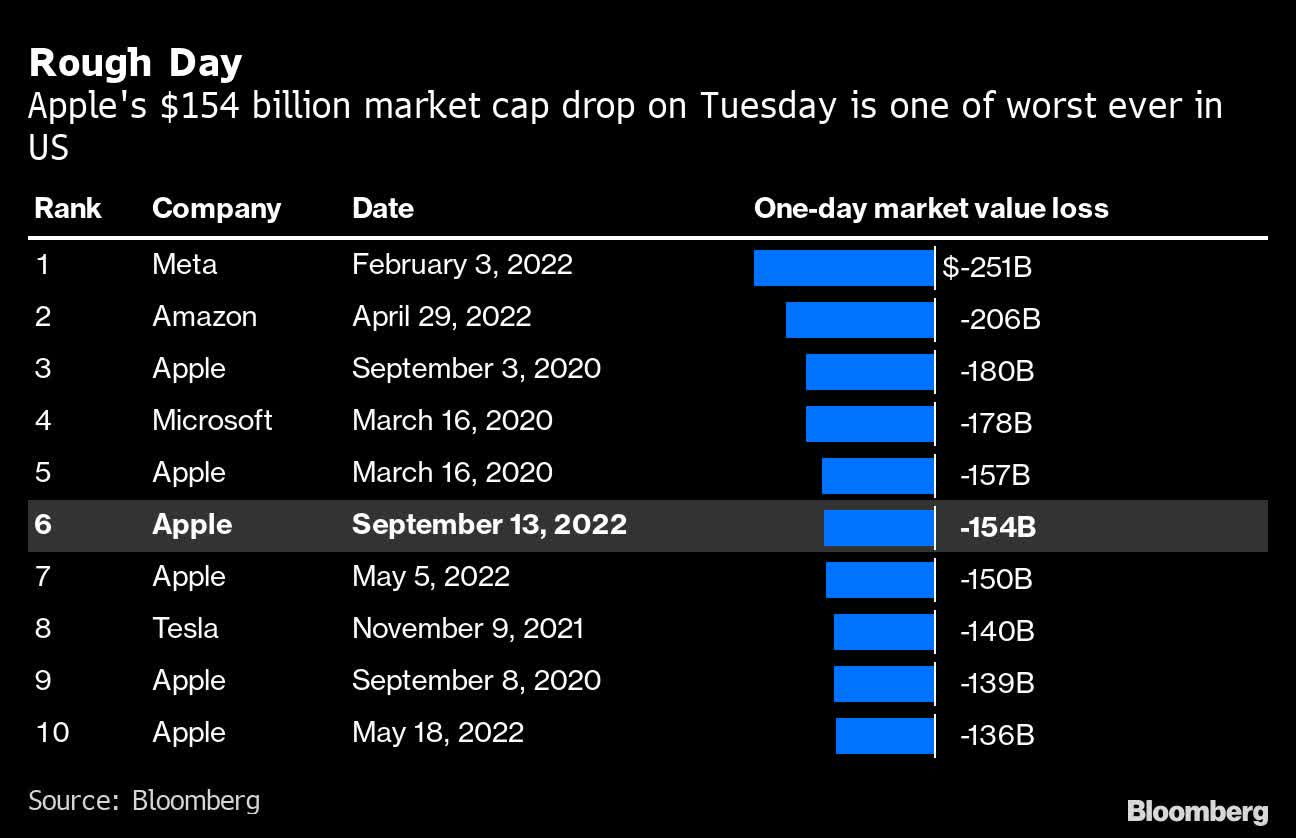
Just blatantly scrap security analysis and buy the underlying securities, not based on fundamental analysis and sound value, but purely on trust and the hope that prices will always go up, as they did in 2008. It does remind us of a quote from Burry in 2018:
“This is very similar to the bubble in synthetic asset-backed CDOs before the Great Financial Crisis, in that pricing in that market was not done by safety-level fundamental analysis, but by massive capital flows based on Nobel-approved risk models that turned out to be wrong.”
The reality is simply that in an inelastic market that is not fully efficient, if passively entered, asset prices are determined by flows if they become large enough, rather than by traditional securities’ analysis. That is, those valuations remain permanently high, and there would be no mean reversion unless those flows came back out of the system.
And that is exactly what we have seen when you look at the Shiller P/E. We’ve had mean reversion back to a 16 P/E over the last 20 years, but they were brutal.
Robert Shiller, Irrational Exuberance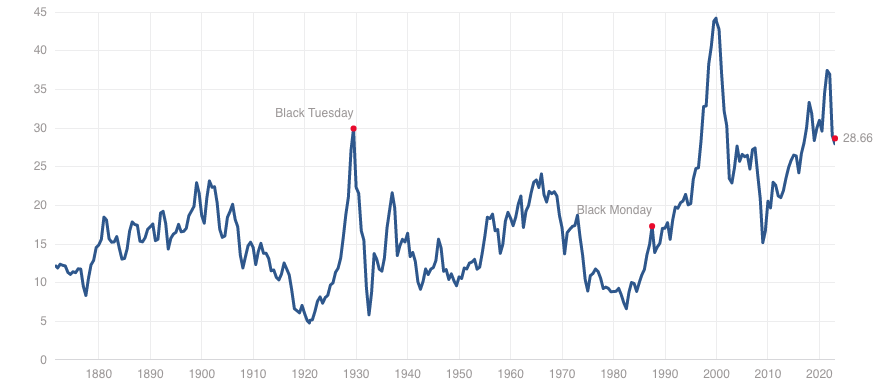
We Dare You To Test The Liquidity
In terms of liquidity, people are quick to reason that that’s not a problem. But in reality, looking at the data, the fact is that we just don’t know yet. Over the past 10-20 years, we haven’t seen net outflows in equities on an annualized basis.
By that, we mean: redemptions from mutual funds/ETFs etc. are greater than the number of shares repurchased that year. Currently, the largest providers have been able to regulate flows internally, or with derivatives, supported by corporate buybacks.
In 2018, we did have a period at the end of the year when outflows from mutual funds and ETFs were in the range of $95BN for 4 weeks, with the market then tanking in those 4 weeks. The media then attributed the downturn primarily to tax loss harvesting. The Fed also raised interest rates at that time, which the media paid a lot of attention to.
NDR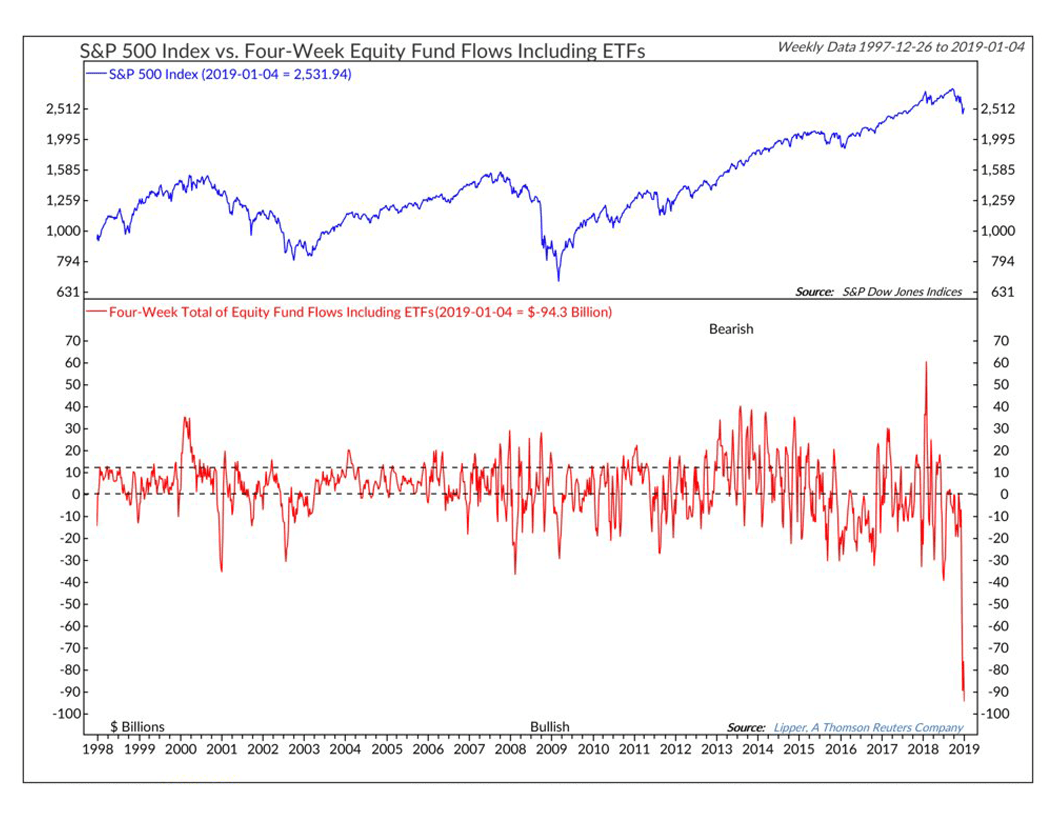
The second period when the system may have been somewhat challenged was in the second half of 2020, especially toward the end of the year. At the time, the turbulence at the end of the year was attributed to the presidential election and the ongoing pandemic.
Yardeni Research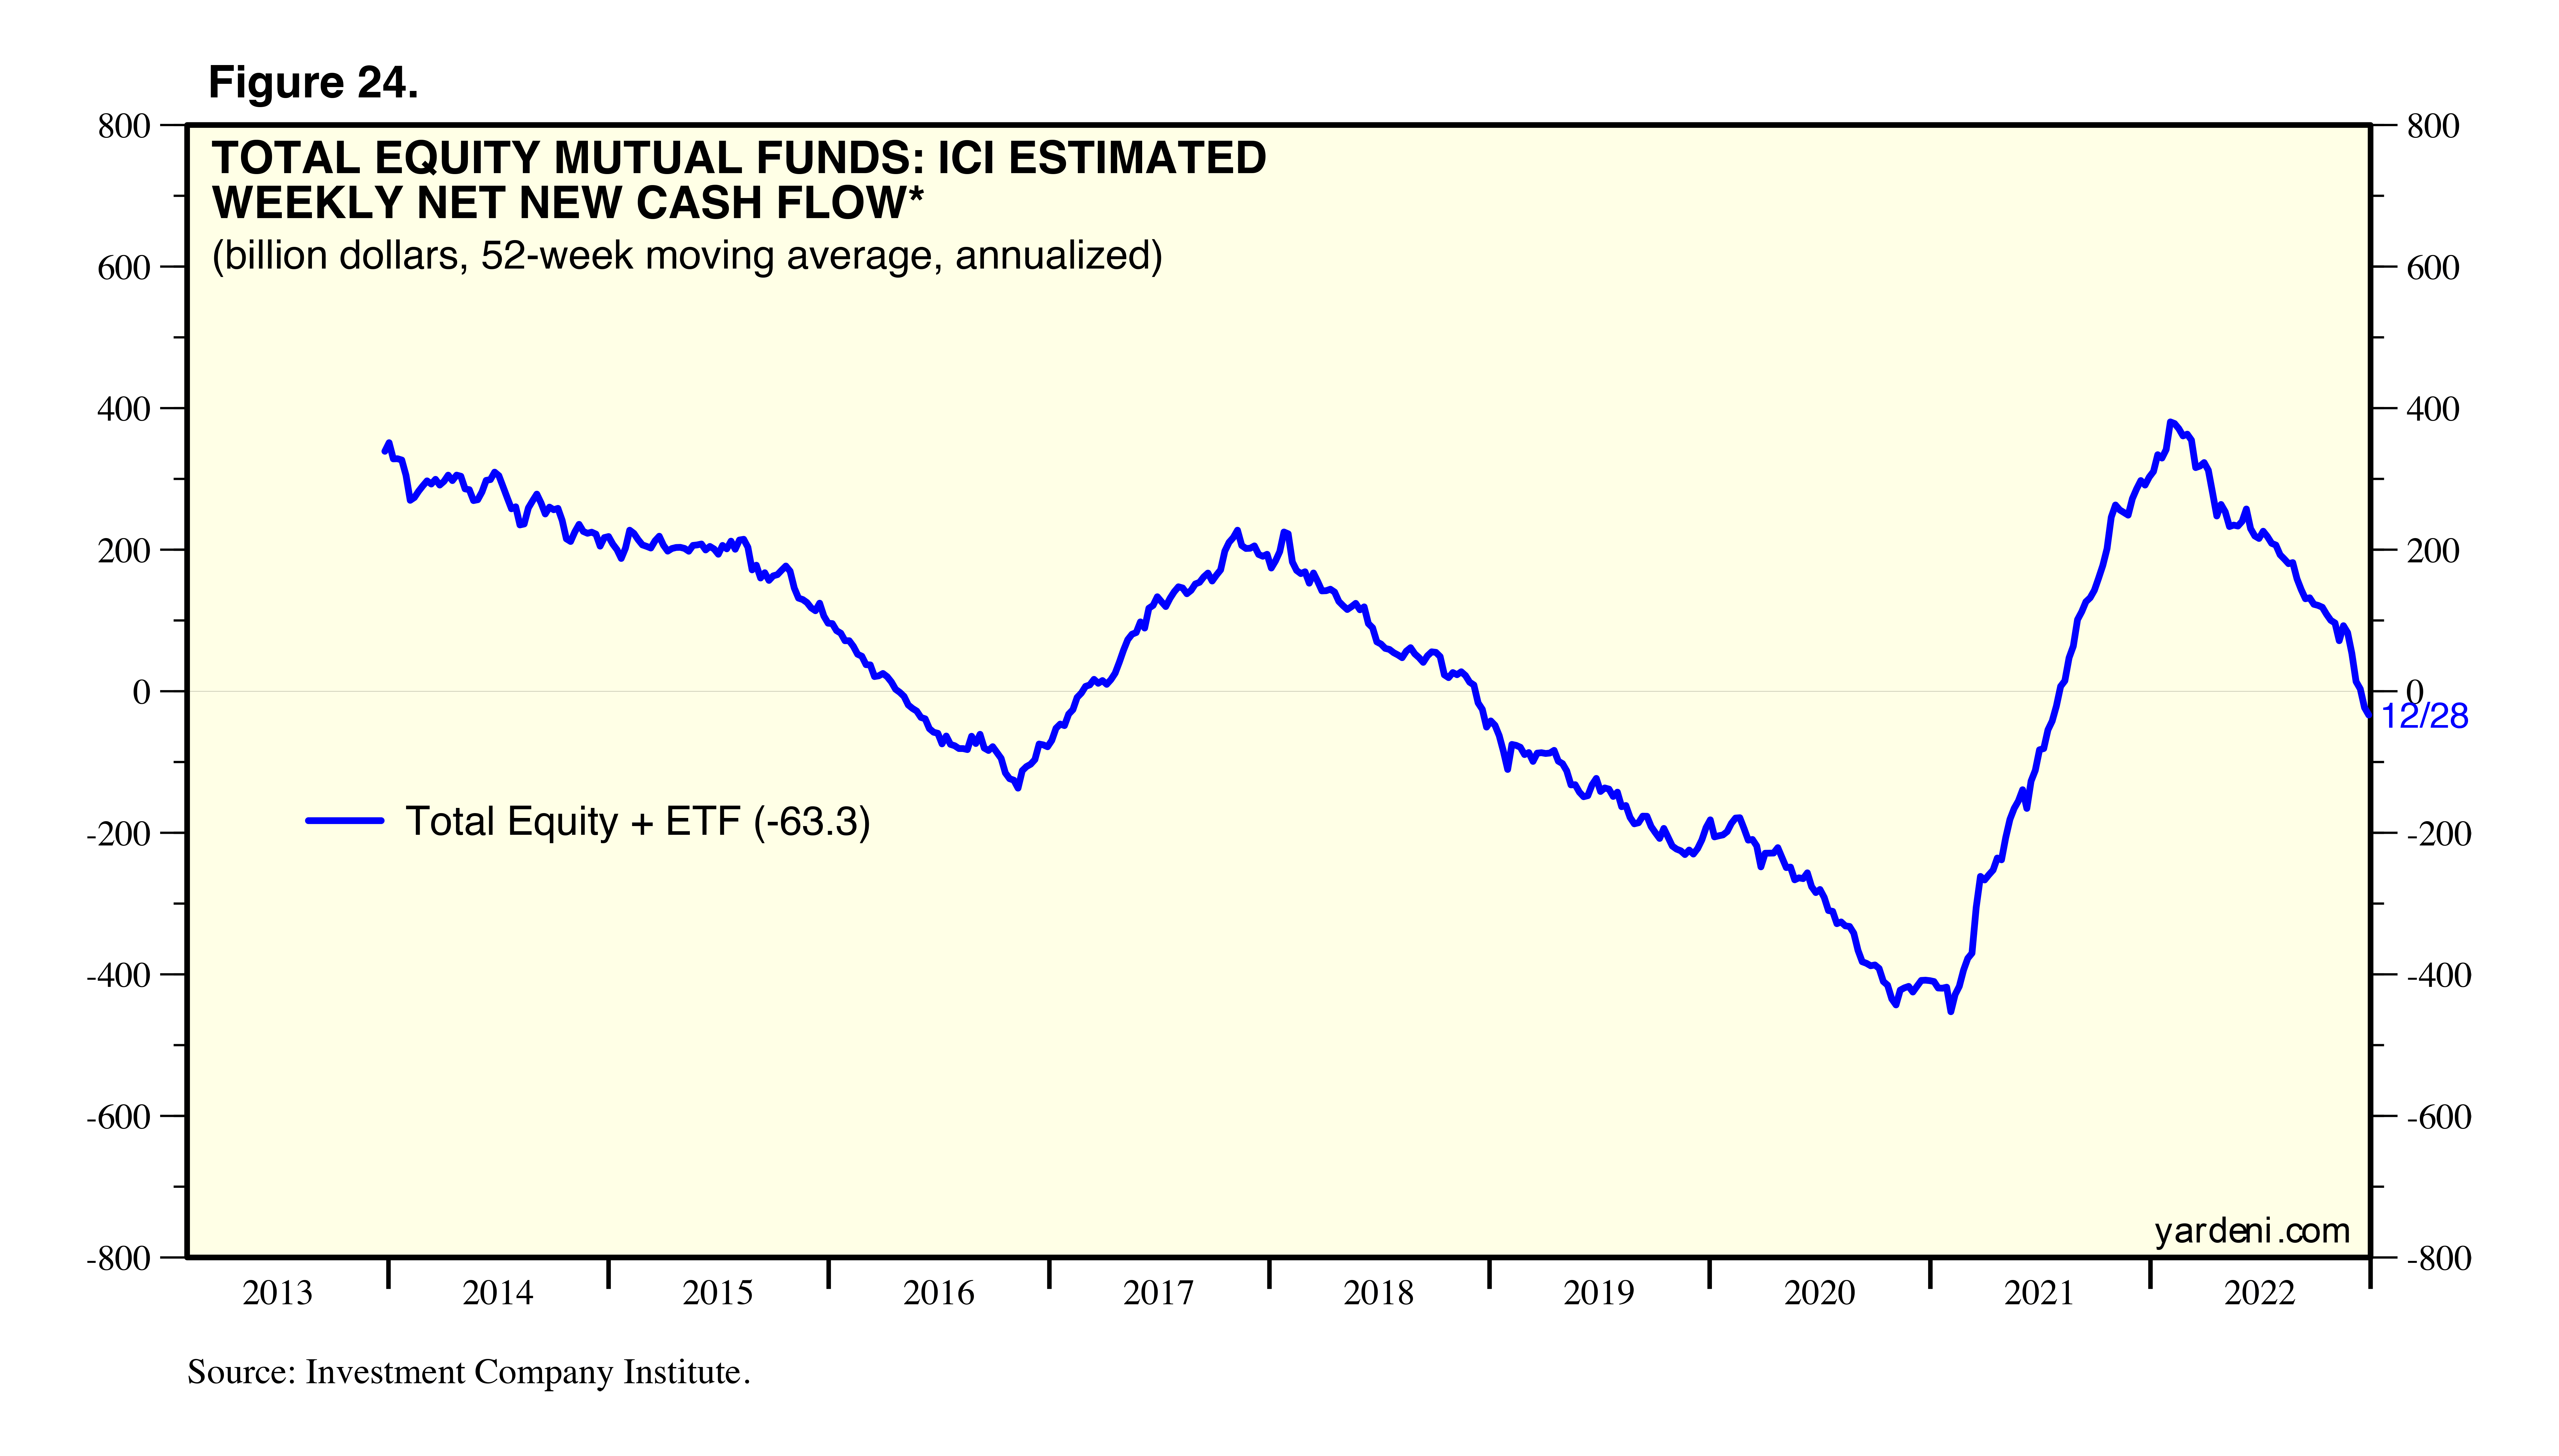
But right then, as flows reversed, the Nasdaq & S&P 500 began one of their sharpest rallies in recent history, with the Nasdaq rising 35% over the following 10 months. This would also make perfect sense, as this was the period with the most inflows into the market, combined with buybacks at record levels.
In a flow-driven world, buybacks do have an impact on price appreciation. By the end of 2020, in the fourth quarter, corporate buybacks began to rise sharply again, which could have provided support. The massive inflows into mutual funds and ETFs, combined with the highest corporate buybacks ever in history, could have led to the rapid melt-up we saw in 2021.
The amount of buybacks completely trumps the amount of outflows on an annual basis. Over the past two years we had about $700BN to $1T in annual buybacks, and at the peak only saw average annual outflows in mutual funds and ETFs on the order of $400BN. Time to turn the tide?
Yardeni Research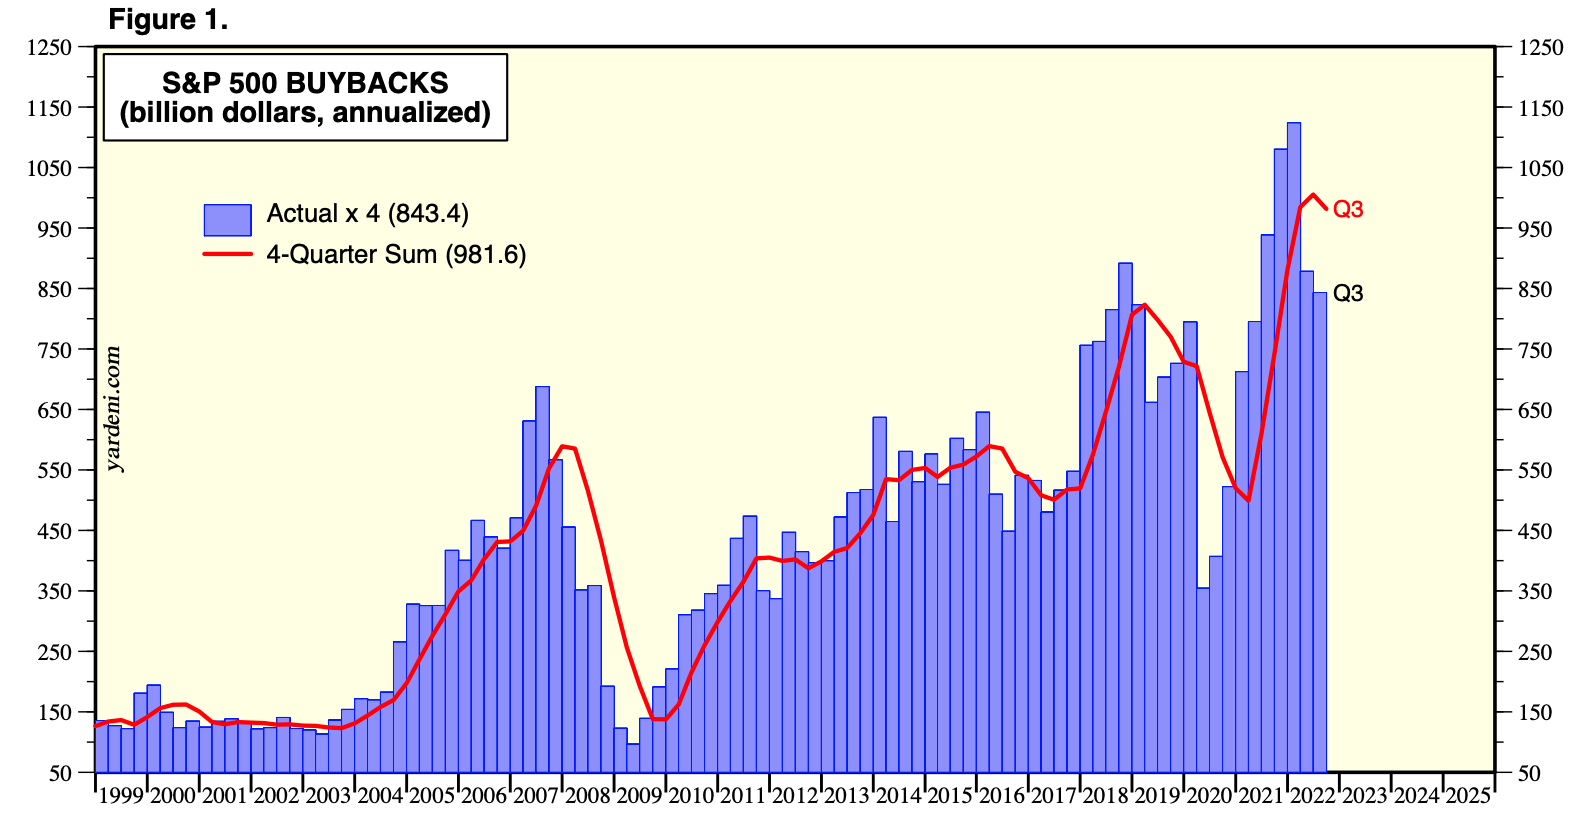
Let’s say we fall into a recession. Is it possible that if profits fall, as they did in 2000, 2008 and 2020, that buybacks will be scaled back? Perhaps.
Moreover, it could be the first time that the system is really challenged in terms of liquidity/ redemptions, with outflows exceeding total corporate buybacks. The first few weeks of 2023 could have been a warning shot when looking at outflows. The largest investment vehicles, Vanguard and BlackRock, know how to attract assets. But can they unwind? We’ve never seen it happen. Could there be reflexivity if markets are inelastic? Most certainly.
This game with structured assets is the same story over and over again — such an easy sell, such a self-fulfilling prophecy when the technical machine kicks in. (Burry, Bloomberg).
Although, according to an SEC report, they seem pretty confident they can handle it, citing their reliance on equity markets as a “liquidity provider of last resort.”
An Examination of Current Equity Market Developments (SEC)
All Theaters Are Overcrowded
Of course, if there were a bubble, everyone would see it. Market participants might point out, that the ratio of stock market value to GDP is currently still extremely far from the baseline. So they logically thought, “That must be because of low interest rates.” As they say: it’s a feature, not a bug.
And so they came up with a solution: apply an exponential trend line to the model. Even in an exponential model, the stock market would have skewed 2 sigma deviations away from the trend.
Currentmarketvaluation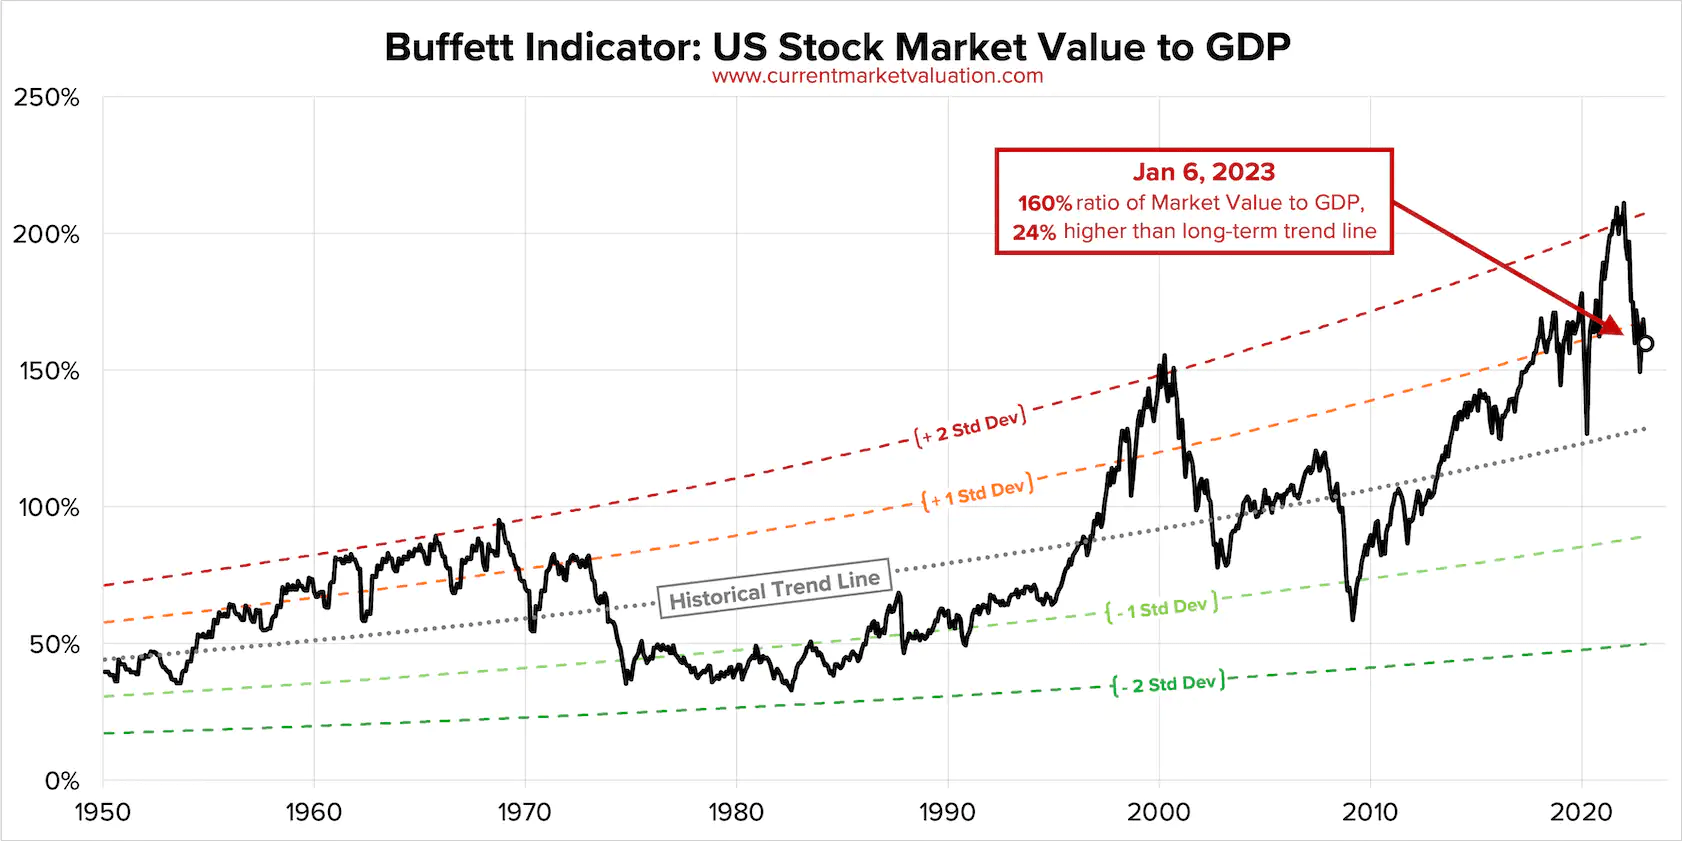
We see it differently. We think this deviation from the trend is caused by a host of factors, of which low interest rates may have played a role. However, we think that inflating the passive bubble, the use of complex derivatives, along with the inelastic market hypothesis, as we have indicated, are at the forefront.
The size of the equity market, can be defined quite easily. We use in this example the Wilshire 5000, one of the broadest indices. Until 1995, the stock market traded around the size of M2. But since then, it just kept deviating from the trend. Although, in 2008, it came back to the trend, after the last bubble burst. Revisiting the inelastic market hypothesis, every $1 increase would result in $5 in added market value.
So what happened when the M2 money supply rose from $15.5 trillion to $22 trillion? After all, using this study, if you injected $6.5 trillion into the market, it would result in a whopping $32.5 trillion in added market value (if everything went straight to equities). And guess what, since March, the stock market went from $25.9 trillion to $48.46 trillion, or an increase of $22.56 trillion. That would explain a lot. It’s consistent with the hypothesis, if the value added was between $3 and $8.
Federal Reserve (FRED)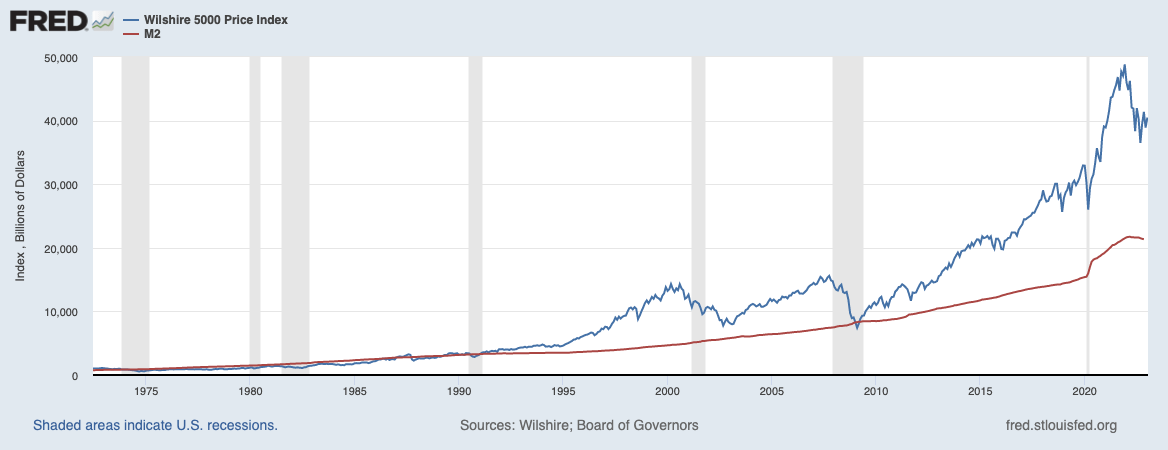
But with complex monetary policy, we know, M2 can be a bit misleading or perhaps send the wrong message. Let’s take real disposable income. Until 1995, the stock market was roughly 50-60% of real disposable income.
Around the dot-com bubble, that trend line lengthened a bit, but reversed again when the recession hit in the early 2000s. In 2008, it dipped well below its trend line, with the stock market at $7.7 trillion and disposable income at $10.8 trillion. Now that trend seems to have changed quite a bit. That QE inflated asset prices in the stock market might be a given.
Federal Reserve (FRED)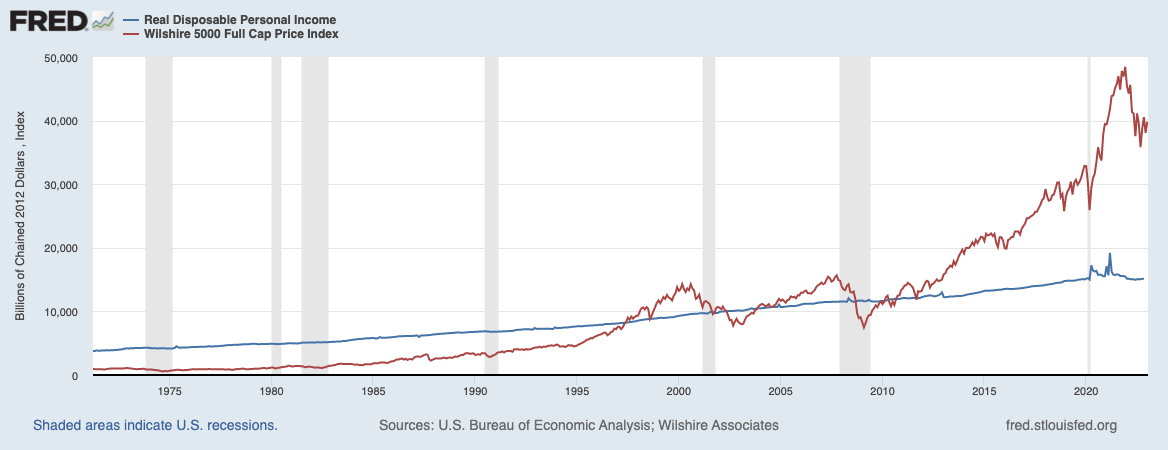
On the contrary, in a flow-driven inelastic world, it may be questionable whether much of that depicted wealth, with equities currently at $38.8 trillion versus disposable income of 18.9, is overstated. Perhaps that is what Burry might mean by his statement that “all the theaters are overcrowded,” and by “trampling on each other” means exit liquidity.
Difference between now and 2000 is the passive investing bubble that has inflated steadily over the last decade. All theaters are overcrowded and the only way anyone can get out is by trampling on each other. And still the door is only so big. (Burry, Twitter).
But back to that Buffett indicator. As far as our data from our friends at the Fed can measure, since the early 1950s, the average ratio of the U.S. stock market to GDP remained around 60% for more than 45 years, and then began to diverge rapidly from the trend around 1995, increasingly so until December 2021, when it reached a staggering 200%+.
Federal Reserve (FRED)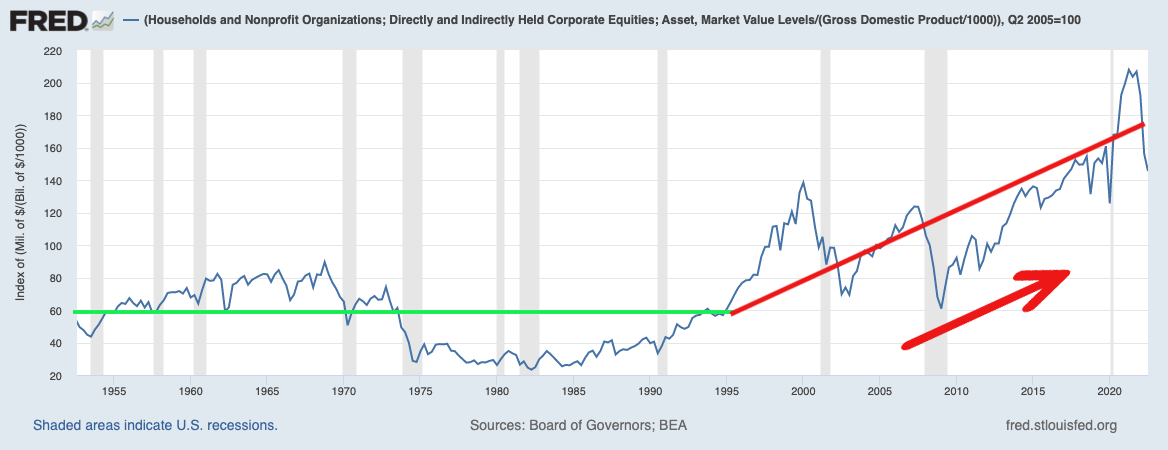
If the inelastic market theory is correct, the popping of the bubble would bring us back closer to trend, which is 60-70% of GDP. Last time we’ve been there was 1995, 2002 and 2008. Even in March 2020, the stock market remained at 120%+ of GDP.
Double What You Think It Is
One could also argue that the proportion of what is passive is not yet large enough to be considered a problem. Although we think this could certainly already be the case. In a perfectly efficient market, the system can handle a lot. Inelastic or inefficient markets, not so much.
The academic research usually went like this: we should look at the size of passive instruments, such as mutual funds, ETFs, Target Date Funds and all other passive investment vehicles to determine the size of passive.
A very good line of reasoning. But that method vastly underestimated how big passive investing actually is. Until recently, it was widely thought that passive ownership was about 15% by looking at all these passive vehicles that use indices. But as it turns out, a more recent study sheds a different light on this issue.
The Passive-Ownership Share Is Double What You Think It Is
We usually forget that benchmarking, or closet benchmarking, has been around on Wall Street much longer than the relatively recent invention of things like ETFs.
These researchers were able to answer the question of how much is actually passive by studying the trading volume of index additions and deletions. Those who want to dig a little deeper into the more complex arithmetic behind the study can find the paper here.
It concludes that strict end-of-day indexers compared to the S&P 500 or the Russell 1000/2000 held as much as 37.8% of the U.S. stock market in 2020. And yet the researchers argue that there are even reasons to think it could be much more than 37.8% because some investors are not as strict and may not rebalance immediately, before the end of the day.
The Passive-Ownership Share Is Double What You Think It Is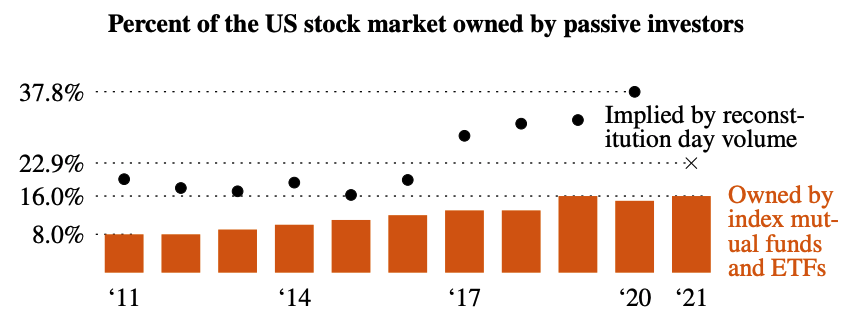
In orange, you can see what researchers previously used as estimations. The black dots represent the amount of indexing implied by their study of volume, showing a rapid evolution towards a gigantic passive ownership. Fun fact, the index industry is basically an oligopoly, with a few players such as S&P Dow Jones owning over half the market, and Vanguard, BlackRock and State Street owning the other ETF side of the equation.
People who own popular product SPDR S&P 500 ETF (SPY), did you know that out of the 9bp fund fee that State Street charges, 3bp goes to S&P Dow Jones for “index licensing fees”? That’s about $120M out of their $360M worth of revenue that goes straight to S&P Dow Jones, just because. Billions and billions of dollars flowing to these “safe assets”, who act in favor of “the little guy,” according to a recent paper about the industry.
Index Providers: Whales Behind the Scenes of ETFs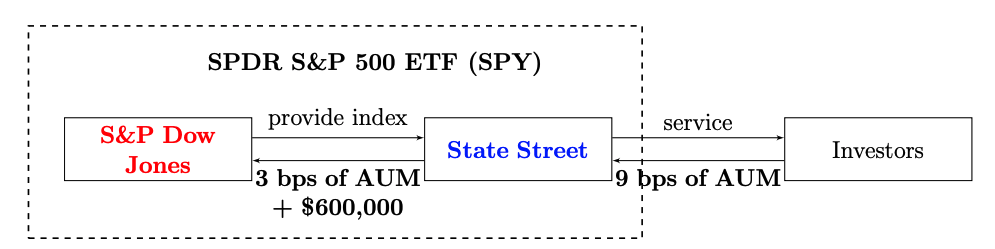
But in practice it does seem easier lobbying as “low-cost” index funds acting in the favor of the “little guy” protecting people from “lousy active hedge funds,” acting in their “own interest.” Yet, behind the scenes, the money keeps flowing, assets keep growing in the favor of these oligopolies, and the notion of research about passive investing distorting pricing gets swiftly ignored. How come?
All those money managers market lower fees for indexed, passive products, but they are not fools — they make up for it in scale.” (Burry, Bloomberg).
This also ties perfectly into the notion of one of his tweets, sort of trying to poke at tech/ growth/ passive investors perhaps rapidly gaining share:
I get the sense in 2002 there were more value hedge funds than there are value investors today. (10/12/22, Twitter).
In fact, the chart below is out of date, as Vanguard has already reached $8T by now. Unless something changes, it is likely that both Vanguard and BlackRock together will reach the $20T mark, as BlackRock currently holds $9.5T AUM.
Vanguard
How Did We Get Here?
It’s 1940. The year that the Investment Company Act of 1940 was passed. This was done in order to establish a more stable financial regulation framework following the devastating Stock Market Crash of 1929.
Some may remember, that in the early 1920s, a handful of speculators borrowed money, buying stocks on margin, until the bubble went bust in 1929. That led to the SEC being established in 1934, and establishing sound requirements for investors to limit margin to 50% initially. Then came the Investment Company Act of 1940.
This act regulates the organization and operation of investment companies, which include mutual funds, closed-end funds, and exchange-traded funds (ETFs). Among one of the very important rules that got introduced were:
- Requiring investment companies to register with the SEC and file periodic reports on their operations and financial condition.
- Requiring investment companies to disclose their investment objectives and the risks associated with their securities
- Imposing limits on the amount of leverage that investment companies can use.
That last rule, plays a critical role. Remember the buffet Indicator, strongly diverging in the late 1990s? At the same time, large players such as Vanguard started using index futures, or just in general, derivatives.
Certain players grew to a massive size, started to incur tracking error. Tracking error is the type of error you have when you diverge too much from the underlying index. After all, certain funds are managing so much capital, that it becomes harder to track the underlying benchmark, without interference.
If Renaissance is already having issues not moving the market too much with its $10BN trading portfolio, imagine trying to move a couple trillion dollars around. Vanguard reached the size Renaissance is at right now, already 25 years ago. So, use derivatives as they are convenient. It could even lower transaction costs when using derivatives, and at the same time getting closer to the benchmark, using them to “hedge positions.” What could go wrong with derivatives?
Waybackmachine, Vanguard Brochure 1998
Though, how would such be possible? After all, with the Investment Advisor Act of 1940, these players weren’t able to use derivatives? That would require a margin account, which is against the act. Luckily, the SEC, CFTC and other government agencies have beaten us to the path once again. If mutual funds want to use derivatives, just let them, perhaps? Issue a couple of no-action letters which no-one reads, and pass a few new rules. After all, they’re acting in the retail investor’s interest.
Division of Market Regulation, SEC, 1994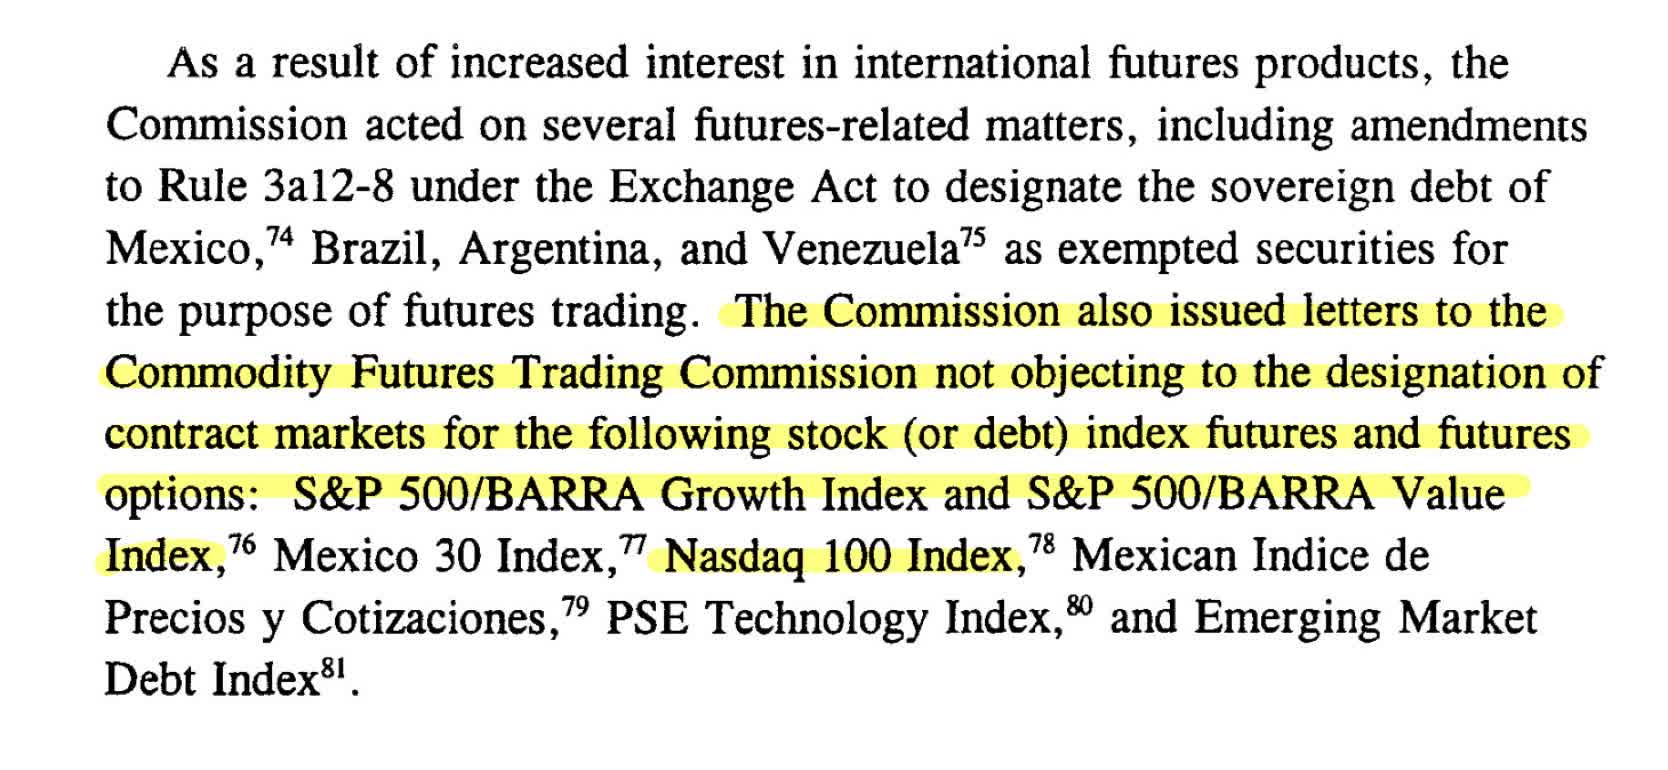
Surely someone should be able to provide liquidity, and if not, blame the hypothesis. It’s a Nobel Prize winning hypothesis, after all.
Potentially making it worse will be the impossibility of unwinding the derivatives and naked buy/sell strategies used to help so many of these funds pseudo-match flows and prices each and every day. This fundamental concept is the same one that resulted in the market meltdowns in 2008. However, I just don’t know what the timeline will be. Like most bubbles, the longer it goes on, the worse the crash will be. (Burry, Bloomberg).
Another massive change took place in 2006, with the Pension Protection act. It basically made it so that, through giving employers exclusions from certain compliance, they adopt automatic enrollments for 401K’s, or “Safe Harbor” plans. Sounds all good and well, plus adoption of 401K’s boomed massively for years to come.
What actually poured gasoline onto the fire was a regulation that got introduced later in 2006. Usually, if people didn’t know where to put their money, they’d just leave it in a cash money market fund. Regulators took note, and introduced what’s called the Qualified Default Investment Alternative (QDIA), which allowed the sponsors to automatically enroll employees into an option such as target-date funds.
If you’re wondering what a target-date fund is, it’s basically in the name itself. It just asks you how old you are, and subsequently buys equities, bonds etc. based on your age, and then glides as you’re getting older, switching more to fixed income.
Vanguard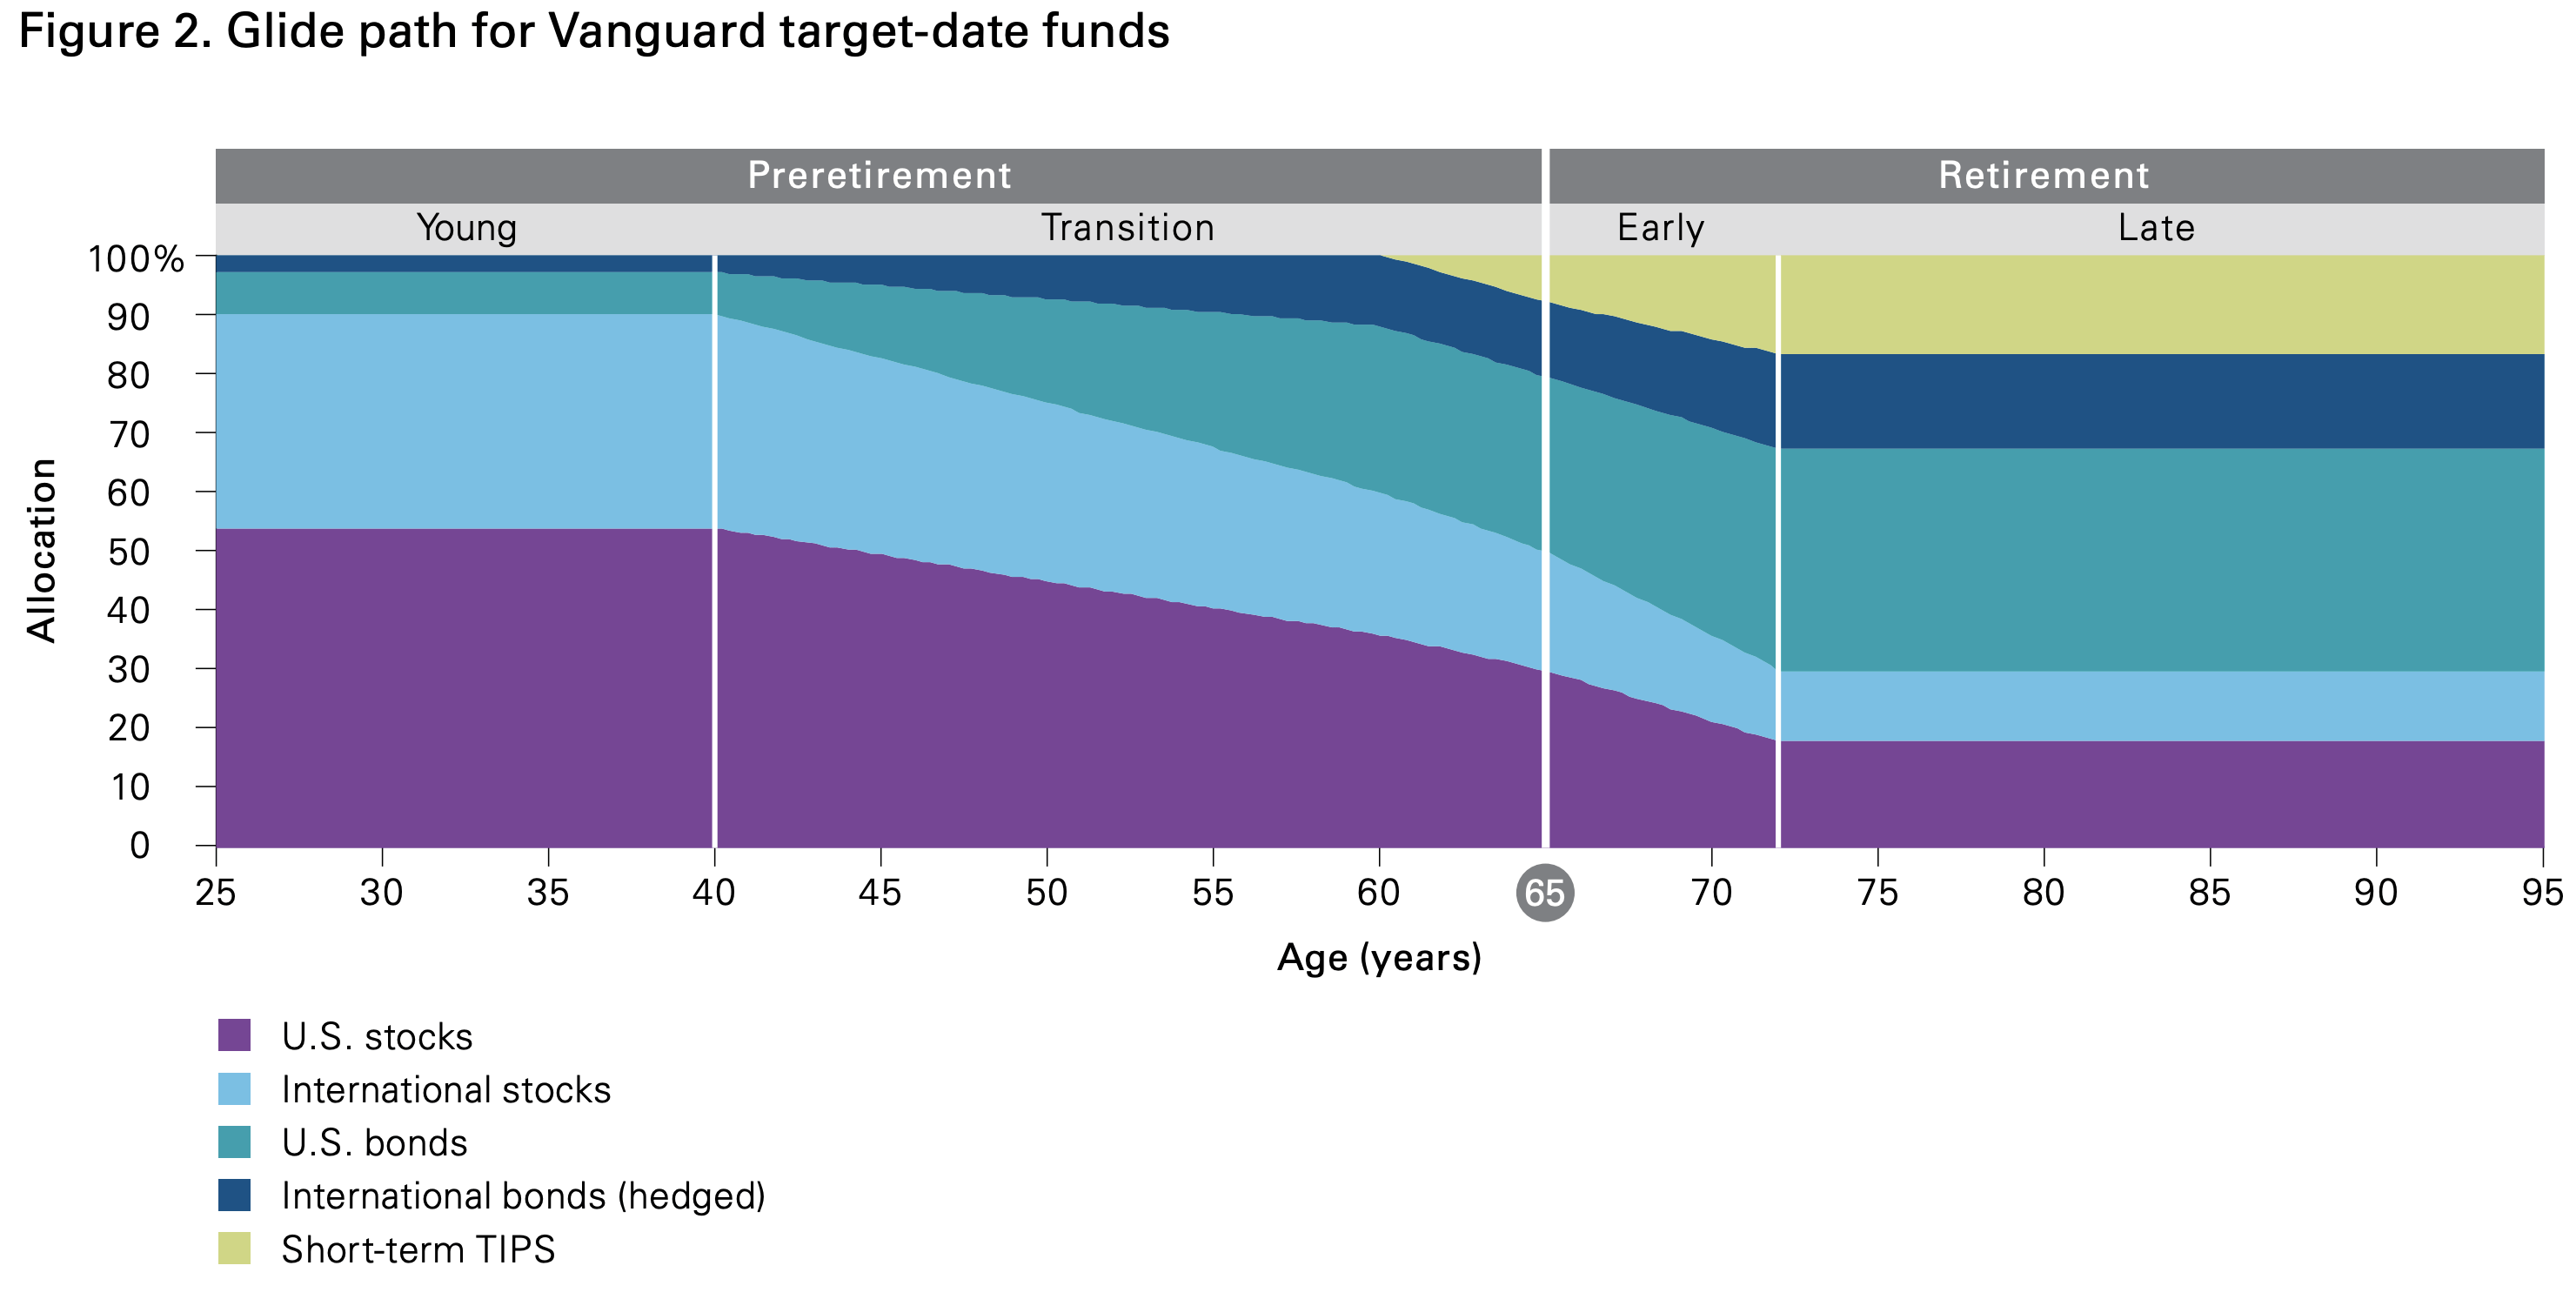
That all sounds wonderful, but that leaves us today with a world where trillions of dollars, that used to be actively managed, automatically goes on autopilot to these target date funds. Speaking about systems that become too big to fail. Outsourcing price discovery and securities analysis to HR managers, perhaps a bit of a stretch.
Plus the idea that once these securities are bought, they become hugely inelastic and only marginally exchanged over a few decades. And over the years, target date funds became the default option.
Vanguard: How America Saves 2022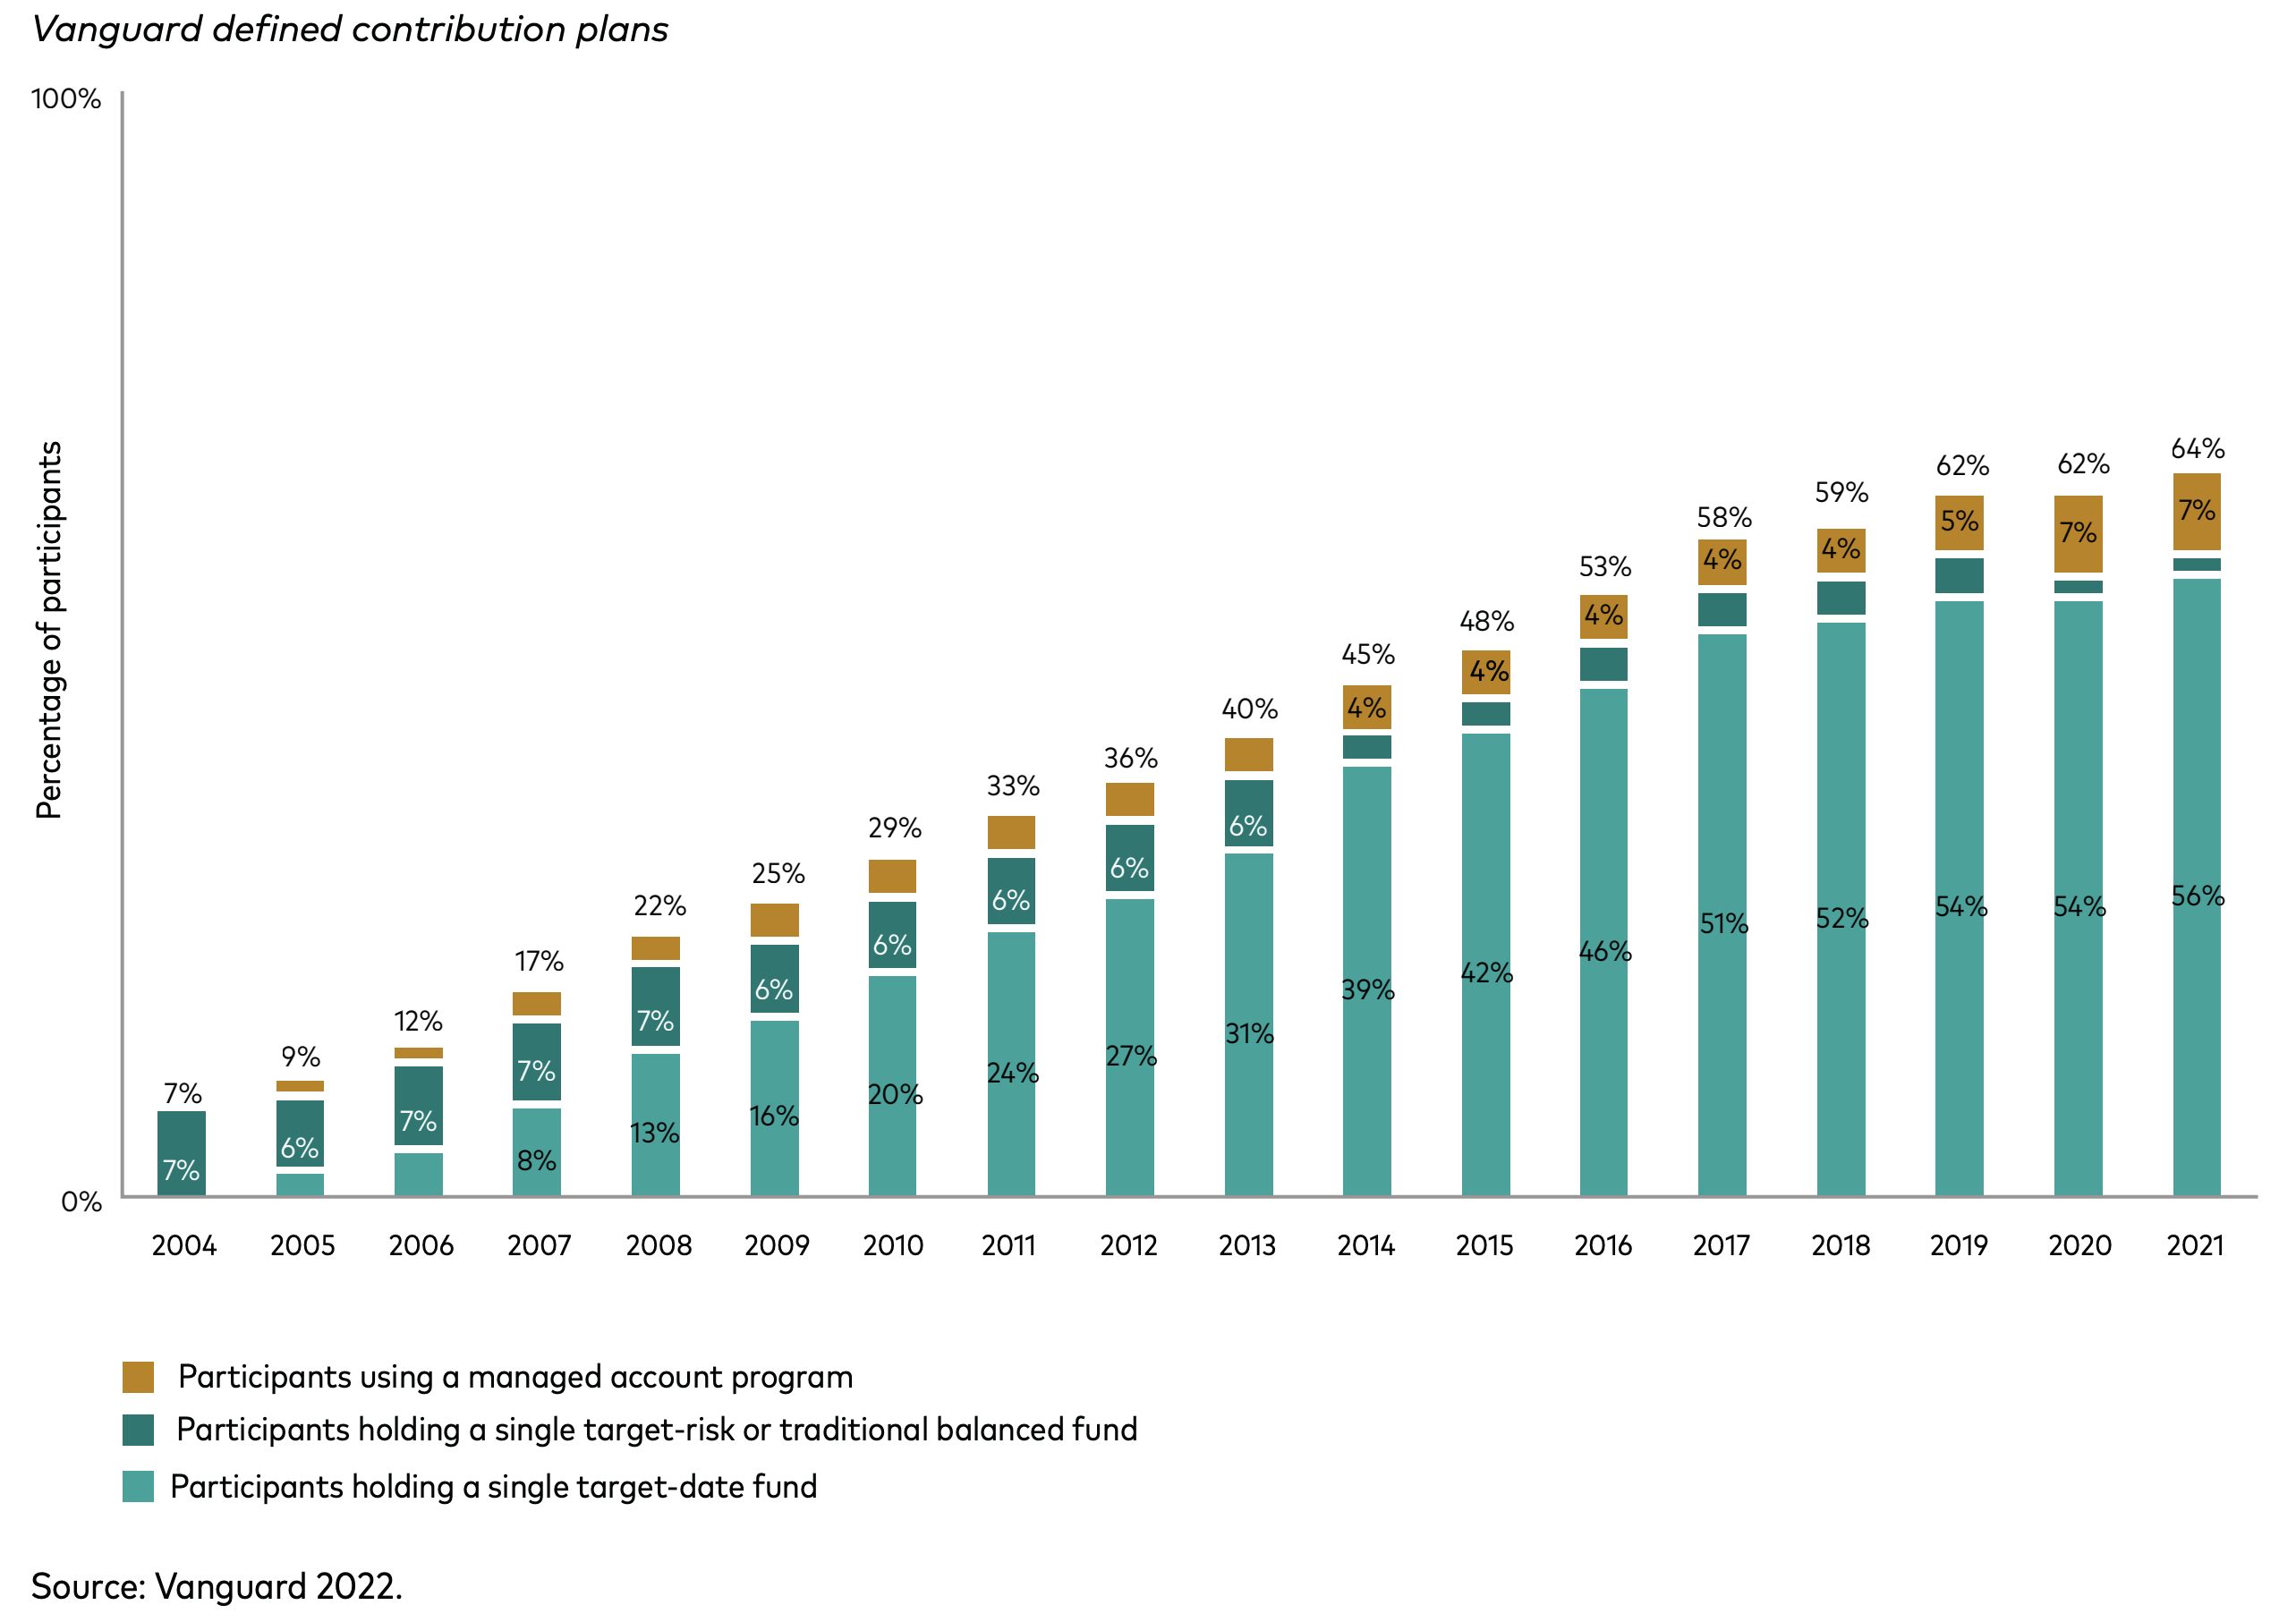
On a more micro scale regarding liquidity, Michael Burry shared some of his thoughts, in a rather cryptic tweet that we think fits perfectly into this context:
Michael Burry Archive (Twitter)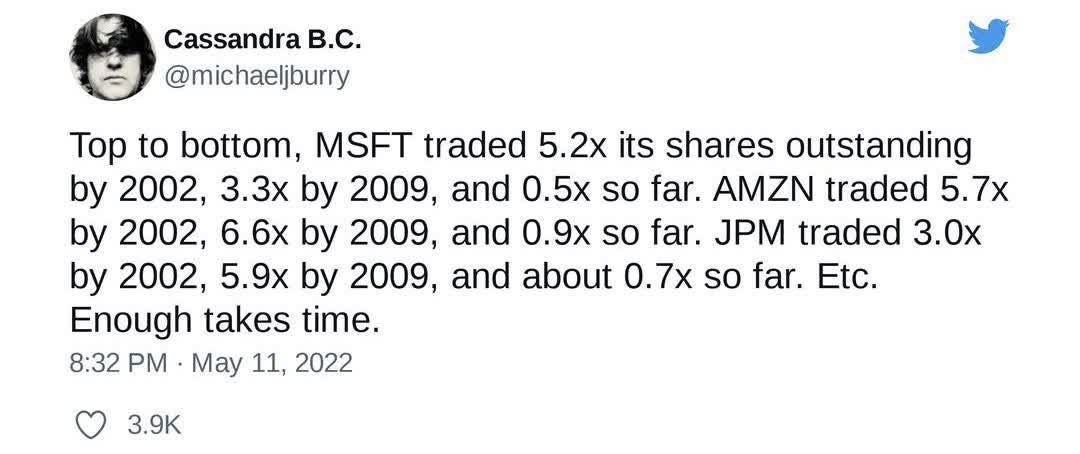
He clearly points out the very low turnover/ liquidity of these large companies and the huge run-up over the past 2 years. When it comes to large-caps like Microsoft, Apple, Amazon and others, they will be more and more inelastic compared to, say, a small biotech company.
That could also be a reason why he reportedly bought put contracts on Apple in the first quarter, or put contracts on Tesla and Ark Invest’s flagship fund, betting that those flows would reverse, which they eventually did. Just as he pointed out in his tweet, Microsoft has not seen the kind of volumes on a relative basis as it did in 2002.
Microsoft had an average daily volume of 30M in the last 3 months, while it has 7.35BN shares outstanding. It would take almost 250 trading days for all those shares to change hands at current rates.
Author, Tradingview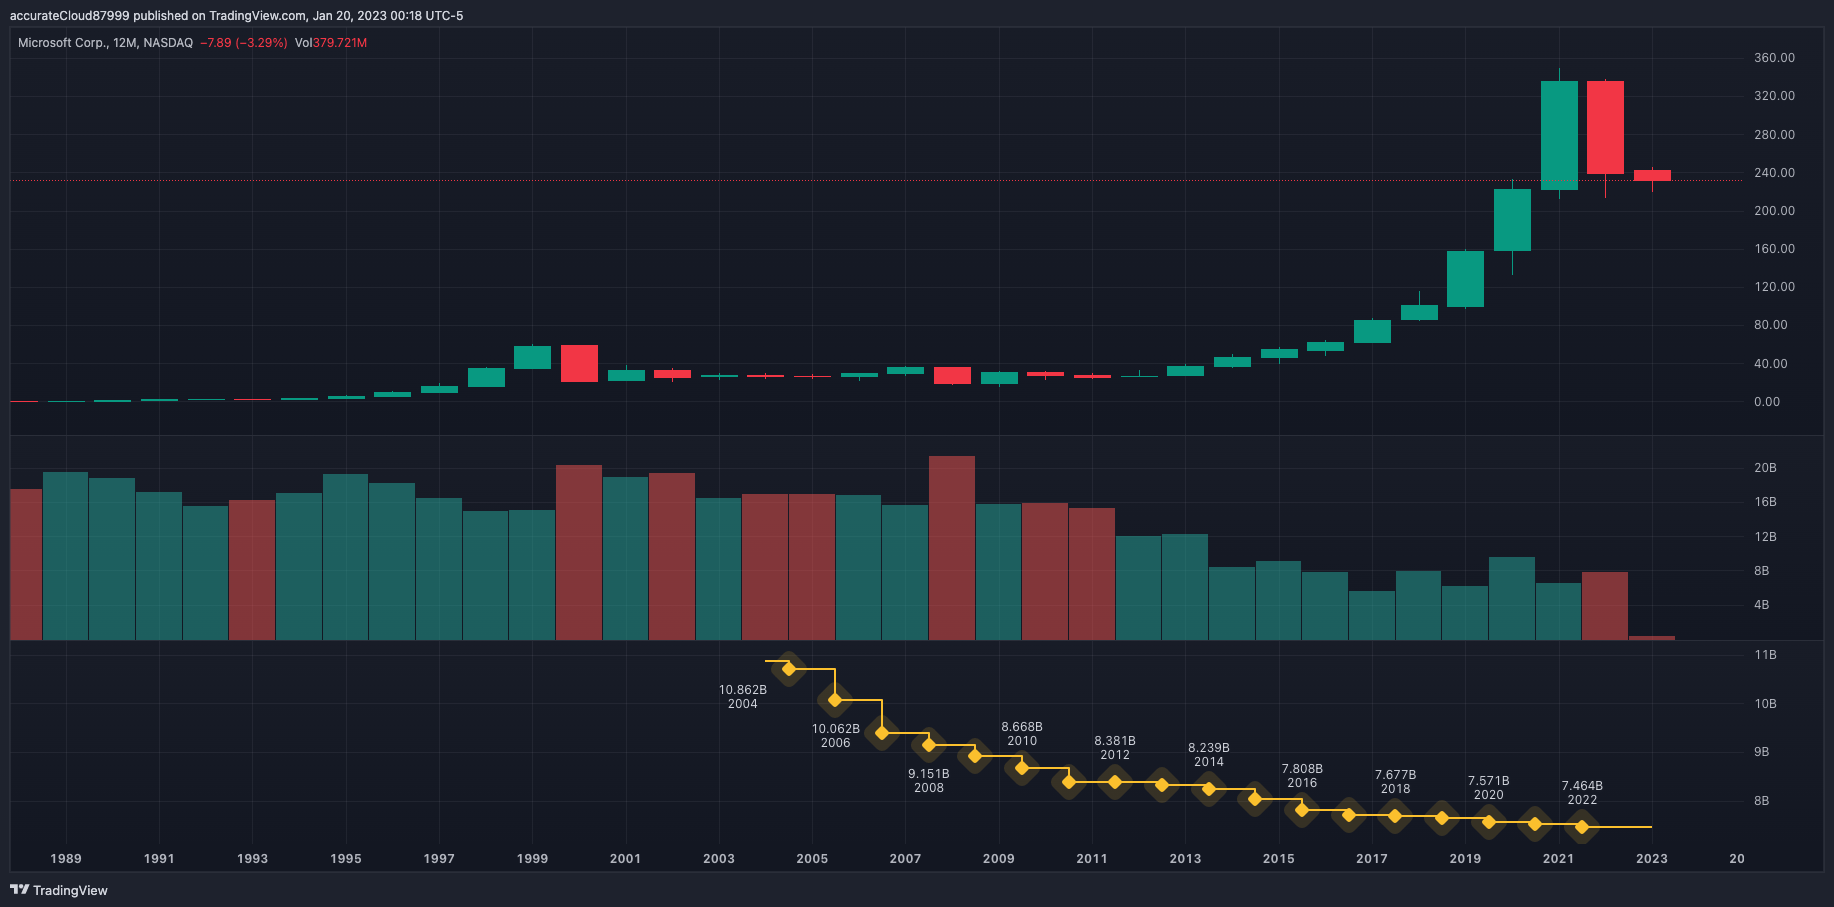
We’re quite sure the dominoes are in place, but at which speed everything unfolds, we’re quite unsure about. Quoting one of Burry’s tweets again:
The theater took more than a decade to overstuff. Not likely everyone gets out in less than a year. (06/13/22, Twitter).
Not to sound like Mr. Doom here, but perhaps also suiting:
As I said about 2008, it is like watching a plane crash. It hurts, it is not fun, and I’m not smiling. (05/24/22, Twitter).
And à la 2008, just like we had synthetic CDOs, we do also have synthetic ETF’s, although a bit less important. But they’re even more allergic to interacting with the main market, as they primarily use derivatives such as swap’s to operate their ETF. It’s more of a common product in Europe. Vanguard’s website was kind enough to make us a visualization.
Vanguard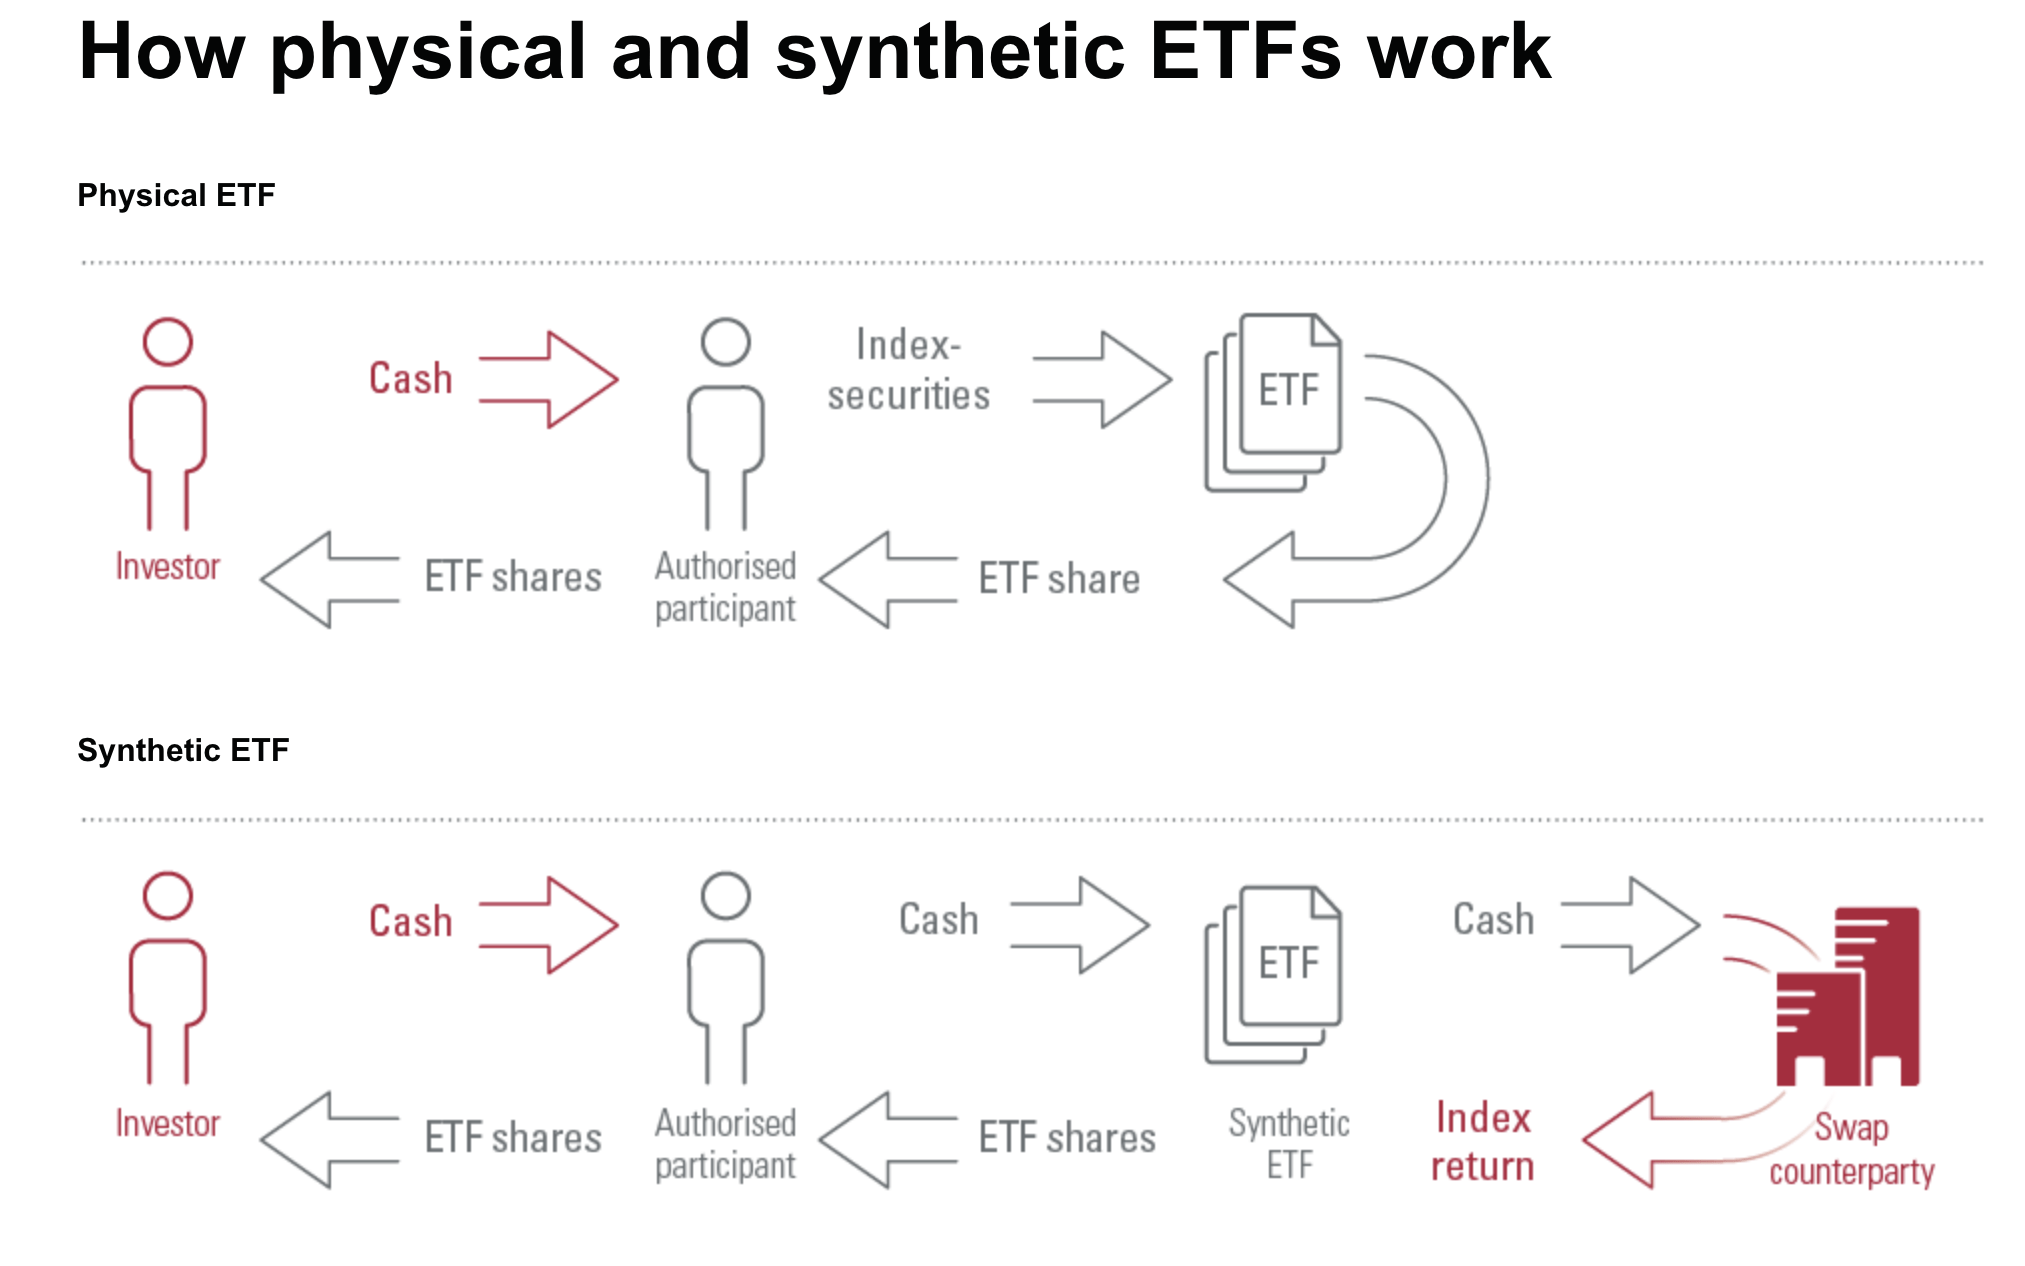
We’ve Seen This Movie Before
We’ve actually seen this play out before. In the dot-com bubble. This bubble, still until today, gets defined as a mania, or buying frenzy mainly from retail investors, because of the rapid evolution of internet companies. Whilst we believe that speculators played a big role in the bubble, we believe it was mainly driven by the adoption of mutual funds, ETF’s and the intricate market dynamics which were already at play, even back then.
An important change happened in 2004, which went completely overlooked by investors. Today, the S&P 500 and indices are float-weighted. Yes, the S&P 500 is market-cap weighted, but in 2004, Standard & Poor actually introduced changes, and float-adjusted the index. This means that the index from 2004 onwards only counts shares that are available to investors and excludes closely held shares or shares held by governments or other companies.
This is one of the things that is never spoken about. But in the dot-com bubble itself, a most of these “high-flying tech companies” all exerted the same characteristics: massive insider ownership, low vol, low float. Index funds like Vanguard were trying to buy Bill Gates’ shares, when they weren’t even being publicly traded.
S&P Dow Jones Indices
Microsoft had an approx. 5% weighting in 1999. For every $100 invested in the S&P 500, $5 would go to Microsoft. But 25.7% worth of shares were owned by insiders. Now, 25% doesn’t sound that much, and rightfully so, because it was exactly right before the bubble collapsed.
In 1995-1996, when the bubble started, the ownership was closer to 40%. By 2000, insiders were already starting to sell, deflating the bubble. 40% is gigantic, especially since it was one of the largest companies in the index. In 1999, it was, in fact, the largest in the index.
Imagine if a couple of insiders owned 40% of Apple today, the largest company in the index. Those insiders would have $1.2T worth of shares at Apple’s $3T peak valuation. Microsoft’s insider ownership circa 1995-1996:
SEC, 10-Q Microsoft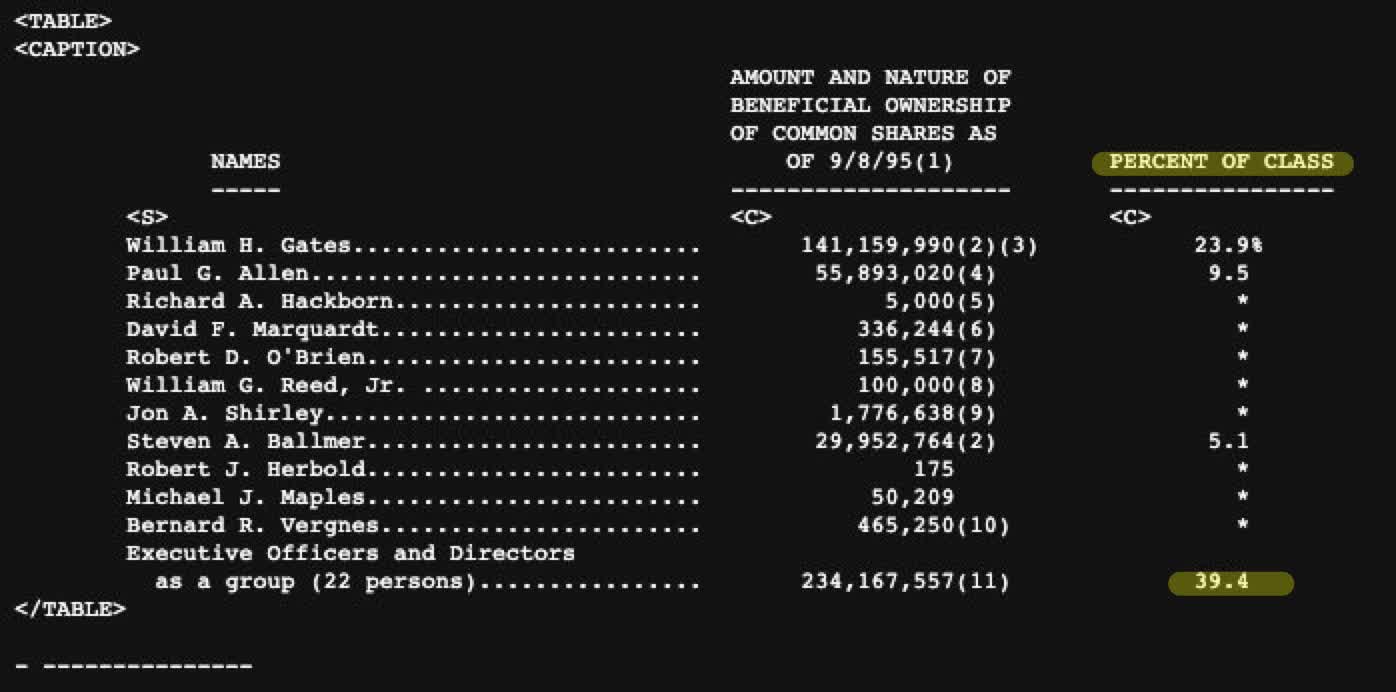
The same story seems to be true for countless other tech companies. If we look at Amazon, a whopping 46% of its shares were owned by insiders. And when the geniuses appointed to run tech funds/tech mutual funds bought those same tech stocks, guess what happened? Prices go up in inelastic markets when you try to buy twice as much as is available. Was the dot-com bubble a misnomer?
Just like in 2008, if there was enough demand for a product, Wall Street was there to meet their needs; by introducing an infinite supply of tech IPOs. If Mutual Fund managers could no longer find technology companies to invest in, Wall Street simply met their needs.
Yet on Jan. 18, 2000, Janus decided to stop flows into their nearly $8 billion technology fund, which may have been a wise decision. In a market driven by flows, this may even have been one of the reasons for the collapse later in March, when fresh capital stopped flowing in.
“Global Technology’s first year return (as of 12/31/99) of 211% resulted in the Fund’s asset base growing at an unprecedented rate,” Mr. Craig said. “By proactively closing the Fund, we will protect its flexibility to continue investing in leading technology companies around the world, no matter how large or small.” (- Janus Global, January 14 2000).
SEC, 10-Q Amazon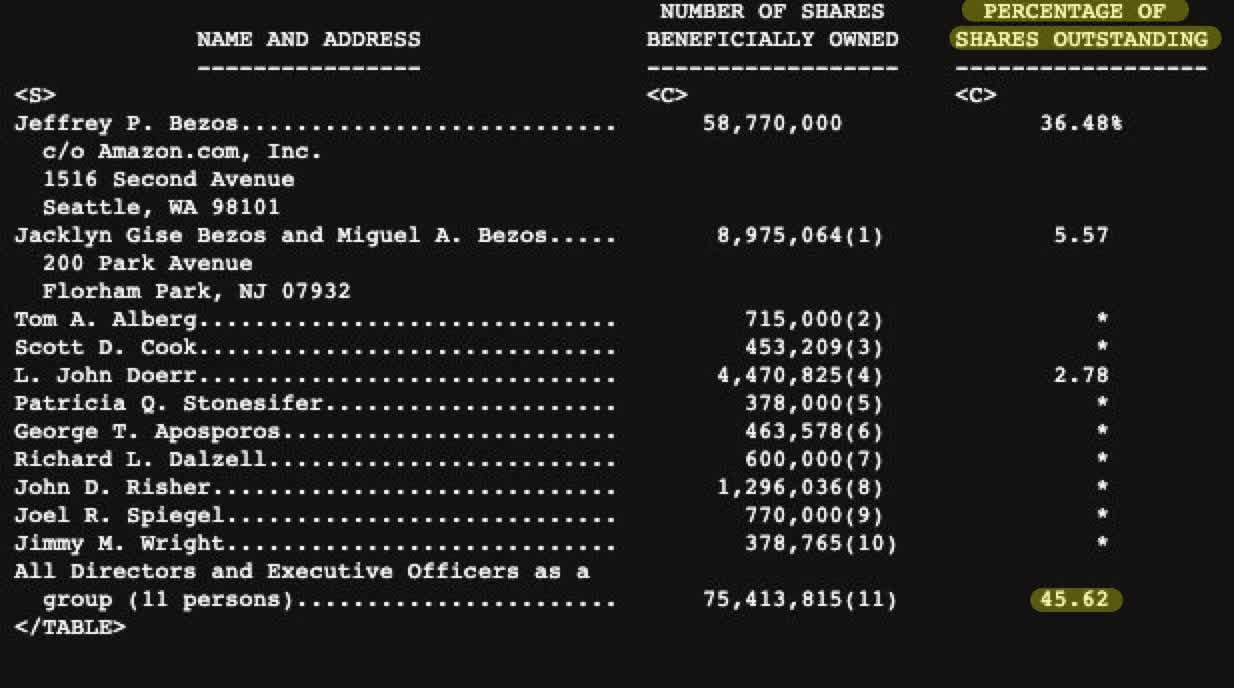
Today, just the same story seems to be going on. Remember that, one of the arguments of buying into an index such as the S&P 500, is diversification. Buying the best 500 companies in the United States, as they say. Though, heading into 2020, the S&P 500 looked more like the S&P 5.
In fact, the largest 5 companies made up 23.9% of the index at its peak. Where is the diversification here? Note that we’re not arguing about the top 5 companies not being great companies. We in fact believe they are. Although they became expensive in 2021, as a byproduct of inelastic markets.
BofA Global Investment Strategy, Bloomberg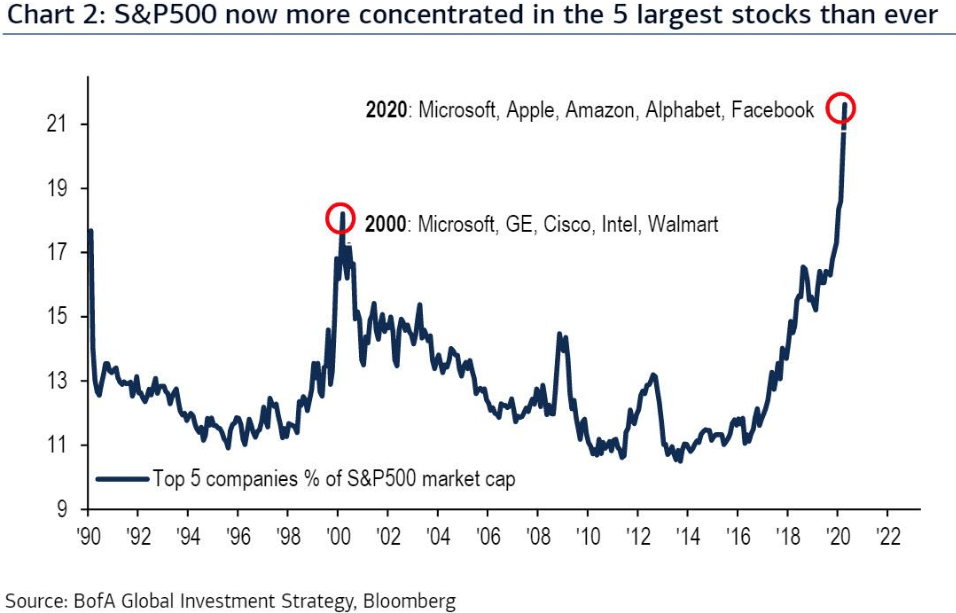
Concentration so high, that at its peak, Apple held nearly 7% of the S&P 500. There is even a rule in effect through the Investment Company Act of 1940, which defines a diversified index/firm as meeting the requirement that a firm must own no more than 5%.
That’s a problem, right? Not much so. Through lobbying and no-action letters, the SEC looked the other way and said: sure, go ahead. No worries.
SEC, No-action letter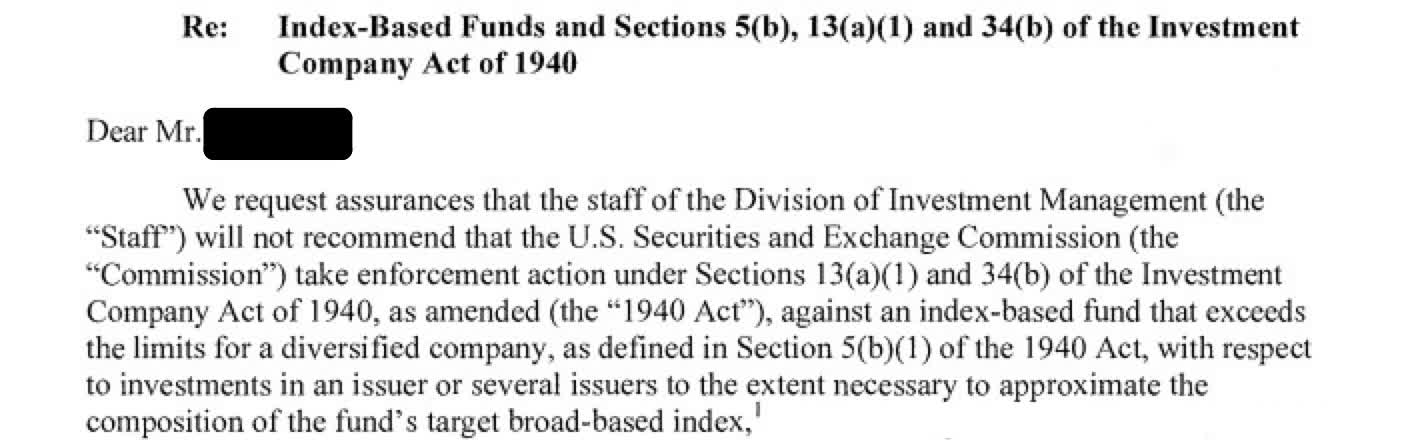
The fact that returns are the result of both future cash flows and fund flows, the inelastic market hypothesis would shed much light on phenomena such as Ark Invest, which attracted more than 25 billion in capital in just 12 months.
Many of those flows went directly to companies, including many small-caps, with less liquidity. In an inelastic market, this would mean, in a sense, that a huge amount of capital deployed in a short period of time, could lead to rapid appreciation in the value of the underlying stocks.
Which again is a winning strategy, and attracts even more capital to deploy in more such risky assets, like in 1997-2000.
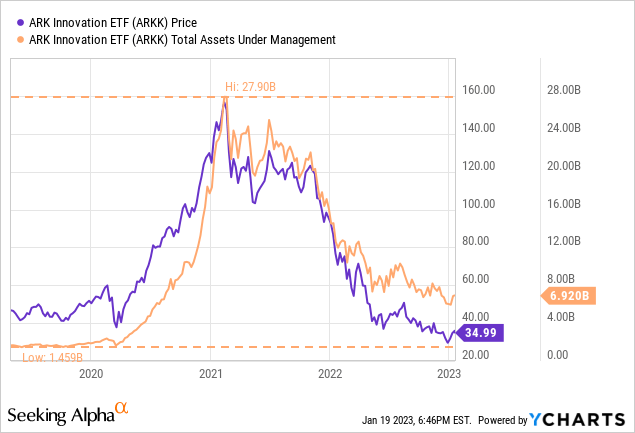
But like most things, it works, until it doesn’t. Not that it would’ve been deliberately done, since most of the academic research about inelastic markets on a macro scale has only been here since mid-2020.
It aligns completely with the hypothesis. When the flows reserved, everything came tumbling down. Whether that’s because of macroeconomic conditions, as is currently believed by many, or what we believe inelastic markets, is up for debate. But on a macro-scale, time may tell.
Bloomberg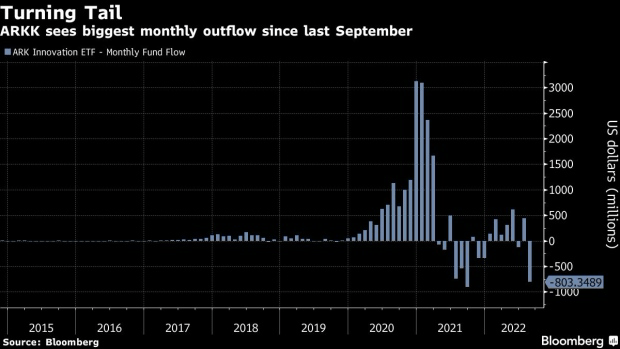
The same thing happened in China, in Shanghai through Singapore futures brokers, back in 2015, when trading of listed A-Shares was limited/ curbed, but index futures still flooded the market via Singapore, and resulted in a bubble that made the Nasdaq-100 look like a dwarf during the dot-com era. But that’s a story for another time.
Bloomberg
The GameStop debacle would certainly also become apparent, as passive players such as BlackRock, Vanguard and others continue to hold certain assets unless they actually file for bankruptcy. In the past, such forces did not come into play.
Before those passive players came on the scene, it would be impossible to borrow short shares so cheaply from a company that so distressed, because after all, outside the passive players, who would want to own such security? It became very cheap to borrow those shares, until at some point there were no more passive players to borrow from, and it suddenly became extremely expensive to borrow at the margin.
Consequently, if you try to cover after you realized how expensive rebates became, in an inelastic market with both active and passive players clinging onto their shares, that’s a short squeeze waiting to happen. The giant fuel thrown on the fire by small investors, who are able to get in on the action, buying securities and not willing to sell at any price, makes for spectacular outcomes.
Market participants not willing/ unable to sell at any given price point (perhaps if not by mandate). On a macro scale? Sounds like passive.
Remember the fall of Bill Hwang and Archegos? Describes perfectly inelastic markets. What happens when you lobby to remove regulation? The genius idea of total return swaps. What’s not to like about derivatives.
Bloomberg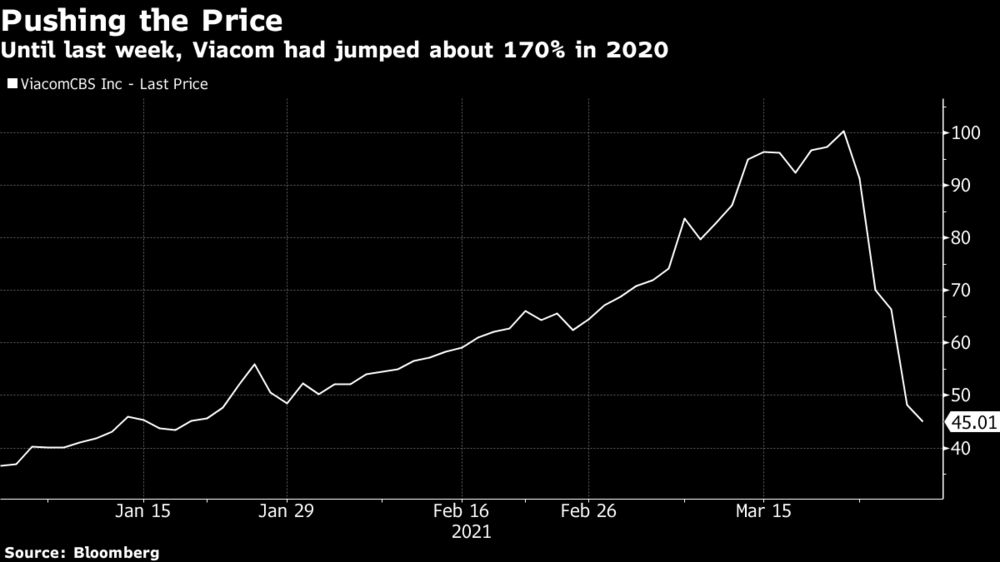
An academic study published by researcher/ quant Jean-Philippe Bouchaud confirmed such actions and proved that at the micro level, flows of day traders can move markets.
The Big Short Part 2?
Now that we know what the markets can do, is there a method to take advantage of this opportunity? Just go short? Maybe, although it’s a dangerous game. You definitely can still get burned. That is, if you are too early, you still lose. And as always, this elasticity can go both ways: a melt-up of the market would expose you to unlimited losses. And it’s so hard to predict flows.
Here’s what Burry had to say about such scenarios, citing the Inelastic Market Hypothesis (emphasis added):
The first step is to recognize that $5:$1 is not a natural ratio. It is a product of a paradigm. So what will continue this paradigm? What may reverse it? This is the knife’s edge, BECAUSE we are at 5:1. It may go to 100:1. Or become -5:-1. But parabolas don’t resolve sideways. (09/19/2021, Twitter).
Parabolas don’t resolve sideways. Since that tweet, a lot has changed. We’re quite sure about facing a recession, with the Federal Reserve tightening at a record pace. If we’re right, and things come tumbling down in a liquidity crunch, the question remains whether the Federal Reserve would intervene. We are on the same page, as Michael Burry explained recently:
Inflation peaked. But it is not the last peak of this cycle. We are likely to see CPI lower, possibly negative in 2H 2023, and the US in recession by any definition. Fed will cut and government will stimulate. And we will have another inflation spike. It’s not hard. (01/02/2023, Twitter).
If that were the case, in a market where momentum is inelastic, we think one idea might be to aggressively buy calls on inelastic companies before a fed pivot, i.e., large-cap Apple, Microsoft, etc., even if initially priced high, because people are unlikely to foresee the magnitude of such a melt-up.
On the other hand, at this point, as liquidity disappears from the system, the most inelastic securities should also fall the most. As they say, the higher the rise, the greater the fall. And we have certainly already witnessed chaos in the large-cap universe in 2022.
Investment Company Institute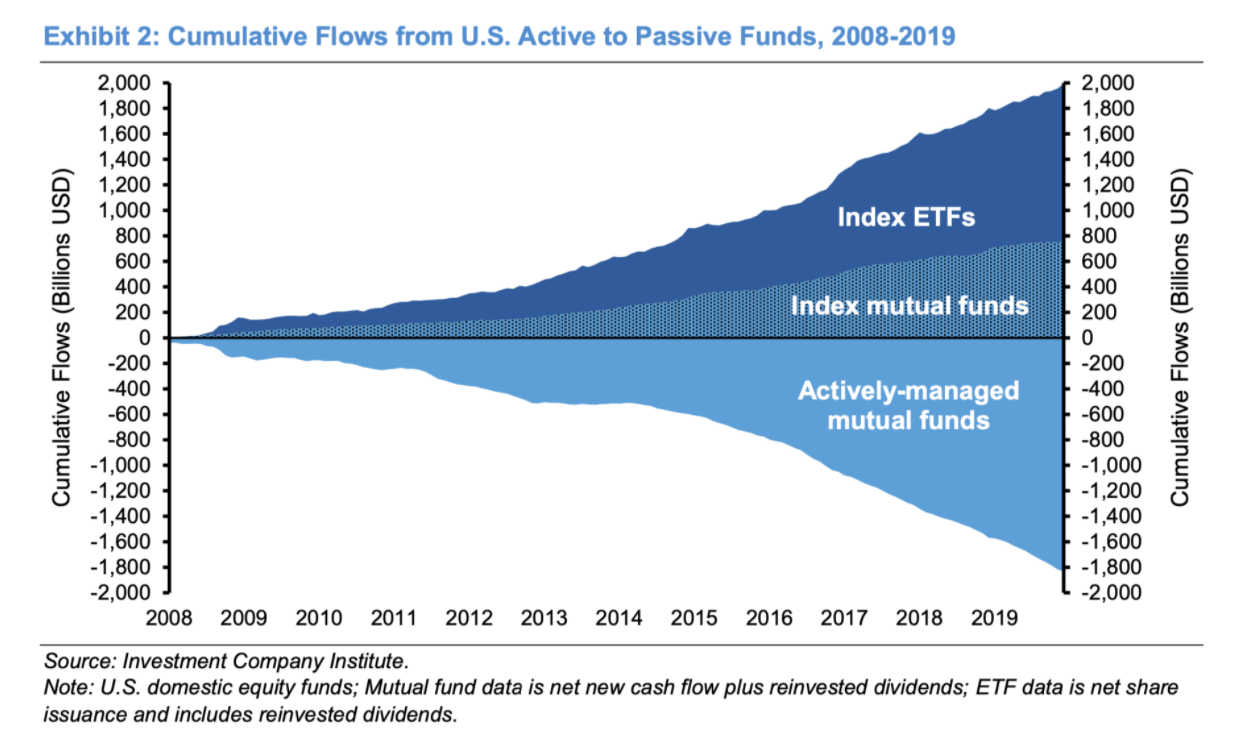
As Burry also pointed out, this parabola could also go to the extreme, as in 100:1, although that doesn’t sound logical in the current environment, where liquidity is being ripped out of the system, and asset prices are being and likely will continue to be crushed, due to the Federal Reserve’s tightening policies into a recession.
Another way might be to look for overseas companies, since they are not yet as exposed as companies in U.S. indications, or wait for reasonable valuations. But then you still have the possibility of a melt-up. An alternative asset class could be gold, especially if the Fed has to cut interest rates, have fiscal stimulus and revive the economy, creating a new wave of inflation.
We are also unlikely to experience a collapse like 1987, when the stock market and futures market collapsed, because we have put up barriers to that. There are circuit breakers, and after 1987 came what is known as the “United States President’s Working Group on Financial Markets” also known as the “Plunge Protection Team,” which would meet as it did in March 2020 in times of illiquidity. As Dr. Burry puts it:
156 years ago there was a market panic in England that led to the creation of the first modern-style central bank, paving the way for the Fed, and for our absolute dependence on every ducking word from its chairman. It has always been about Plunge Protection.
Where Is The S&P 500 headed?
Dr. Burry also noted some of the same conclusions we did, about what the unraveling of this might look like:
Re: paradigm shifts/speculative peaks, the SP500 bottomed 13% lower than 2002’s bottom in 2009, 17% lower than 2002’s bottom in 2009, 17% lower than 1998’s LTCM crisis low in 2002, and 10% lower than 1970’s low in 1975. 15% lower than COVID low is SPX 1,862, ~Shiller PE of 16, nominal PE of 9. In historic range. (05/03/22, Twitter).
Michael Burry (Twitter)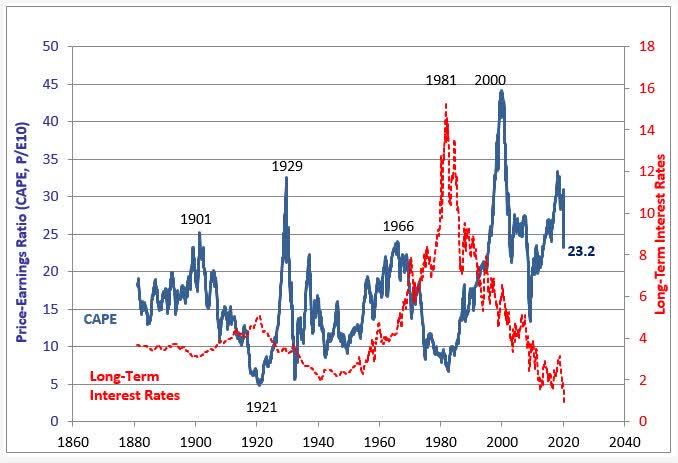
At Least We Tried
The hundreds of hours that was funneled into this research was not created to undermine passive investors, but we felt it necessary to share this research that many seem to hide/ overlook.
We felt necessary questions needed to be asked, such as: what if markets are not efficient? What if markets are inelastic? How close are we to passive investments distorting price discovery, or are we already there? How fast are we moving from active to passive? Or how would liquidity shocks affect the system?
It is as Jack Bogle himself, founder of Vanguard, once said in 2017:
If everybody indexed, the only word you could use is chaos, catastrophe. There would be no trading. There would be no way to turn a stream of income into a pile of capital or a pile of capital into a stream of income.
While we love Jack Bogle, we must also acknowledge that passive funds are based on the efficient market hypothesis, and that markets are as elastic as people in the literature believe, which has been refuted again and again by empirical evidence, and researchers underestimating the inelasticity of markets by two orders of magnitude.
Bogle also said this about passive ownership and a potential tipping point (emphasis added):
So, I’m not concerned about it. It’s going to take a long, long time [for indexing to get] anywhere near 50% [of the market], and things will change a lot in other ways by then.
And well, only 5 years later, we may already be there. Probably only time will tell how this plays out. But as a take-away, the notion that nothing is ever 100% safe should still be considered, as Warren Buffett would say, “There is no free lunch.”
Bloomberg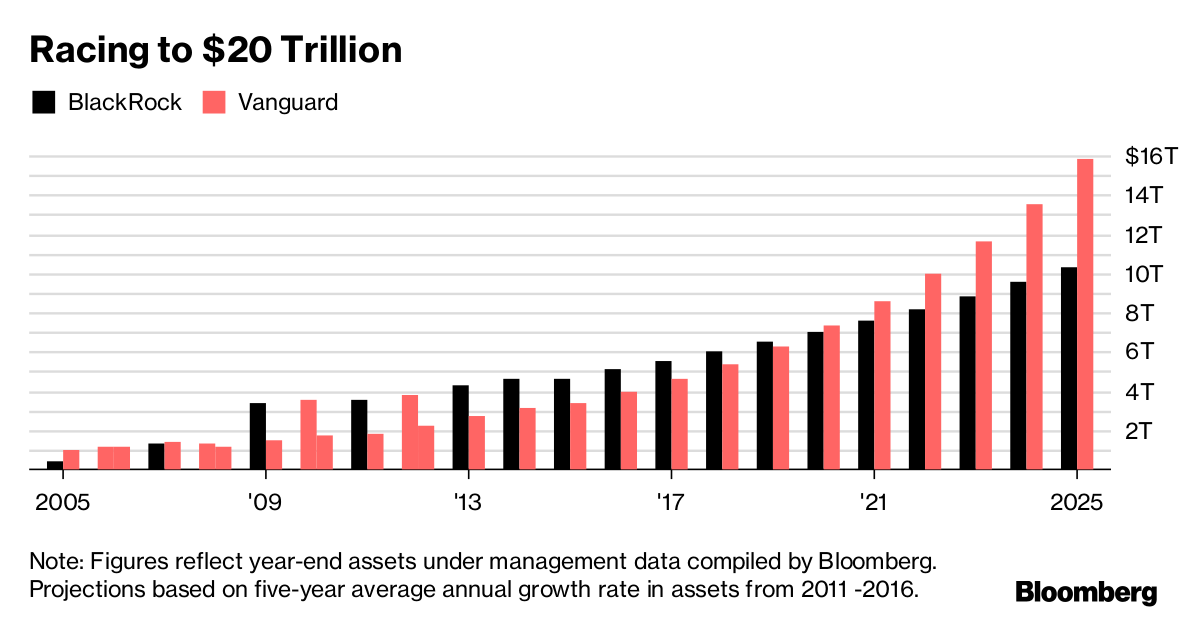
Unfortunately, in a world where data and research are so abundant, mainstream economists still seem to cling to models that have been proven wrong time and again. As if we are dealing with the binary judgment of a fundamentalist religion. Nothing screams hallelujah more than Ben Bernanke who won a Nobel Prize last year for his “groundbreaking research on banks and financial crises.”
Perhaps this time around, they might end up buying equities instead of bonds when the tides turn on them. Will ignorance be willful again like in 2008? Time will tell. We would not be surprised if one day the Fed starts buying equities like Japan or China.
The resonant message of 2008’s “too big to fail” is as relevant as ever. Not to point fingers at Vanguard or BlackRock, but along with large returns come vast lobbying opportunities, as in the run-up to 2008. It’s hard to put the genie back in the bottle, so to speak.
At least I tried. (Michael J. Burry, 04/22/2022).
Should I withdraw money from my 401-k retirement account? (Bloomberg)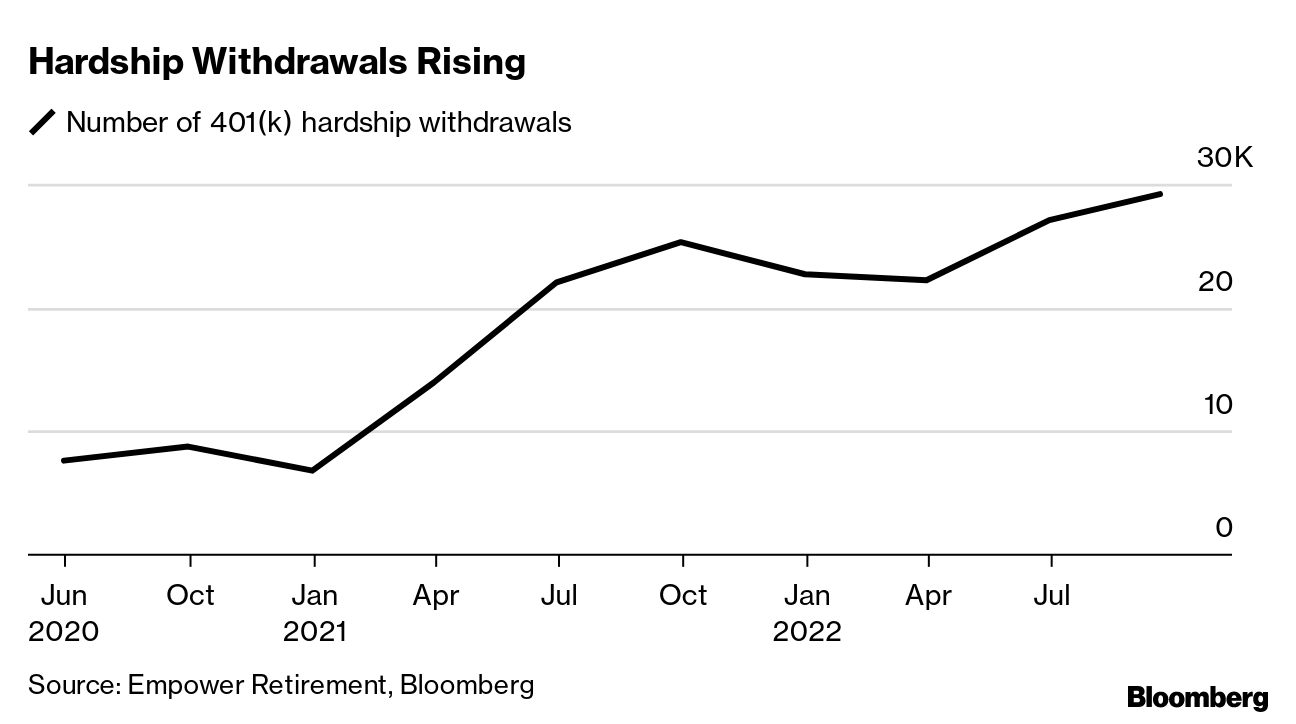
Be the first to comment