

genkur/iStock via Getty Images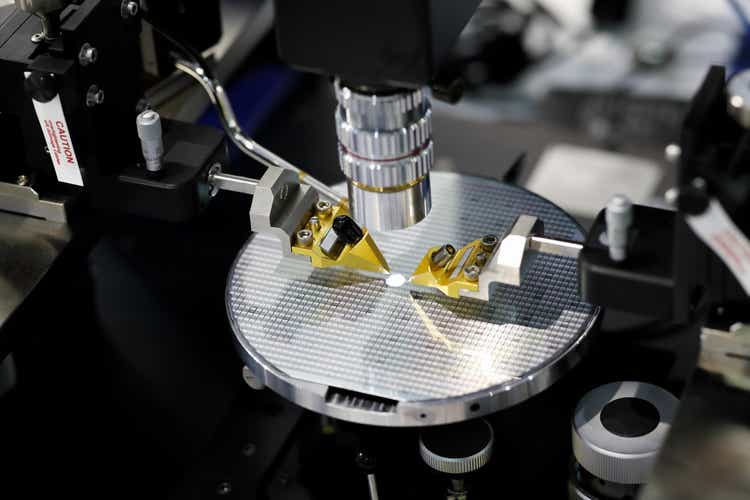
Investment Summary
We remain bullish on the long-term outlook of Mettler-Toledo International Inc. (NYSE:MTD) shares. The investment case we’ve laid out in previous analyses (here, and here) remains unchanged. We firmly believe the company’s differentiated capital management strategy insulates it from peers and remains accretive to unrealized value. There’s potential to harvest 4% in buyback yield, findings show. Further, recent operational gains have decompressed operating margins, freeing up FCF. Management have subsequently revised full-year guidance upwards, calling for 8% at the top in FY22. To that, we note MTD’s repeated history of outperforming guidance as a catalyst to move the needle.
Exhibit 1. MTD 12-month price action
Data & Image: Bloomberg
We also demonstrate recent bearish sell-side commentary overlooks several key factors in the investment debate, particularly at the macro level. The company’s efforts in improving vertical supply chain movements have come through the P&L, resulting in outperformance in its last earnings. The company’s portfolio, now well diversified, generates predictable FCF margins that continue expanding with time. Shareholders therefore have sizable value yet to be realized at the free cash level, by estimate. The value proposition is completed with MTD’s repurchase program, that is accretive to shareholder earnings and ensures a tidy premium to unlock long-term value. This serves as the key element underpinning the MTD investment debate. Rate overweight.
Sell-side fails to capture earnings catalysts
Recent sell-side commentary penalizes MTD for its exposure to industrials, and its growth mix “that’s skewed towards price.” The recent pessimistic note from Goldman Sachs also suggests macro-headwinds, including inflation, could “outpace the ability to offset (these) through pricing.” JPMorgan also noted “the macro backdrop continues to drive uncertainty for the rest of the year” post MTD’s earnings. We immediately challenge these suppositions and posit they completely overlook the simple economics of the debate.
1. MTD presents with differentiated investment characteristics that separate it from its peers in the large-cap life sciences space. Specifically – the company’s share repurchase program. This component heavily tilts the risk/reward calculus to the upside. We’re buyers of MTD at current multiples on this fact alone. Buybacks have been MTD’s capital budgeting tool of choice to unlock value since floating back in 1997. The company has been M&A light since this then, completing its last deal in FY21 (PendoTECH), and FY17 before that.
Market penetration has instead focused on targets that build out its operating capacity into adjacent markets. As such, the strategy has been to expand operations organically, generating high percentages of FCF to organic sales growth. To demonstrate, the company’s defensible top line growth has ensured a steady conversion of FCF below the bottom line. FCF margins have averaged 19.6% these past three years, well ahead of the industry’s 17.5%. FCF margin was also 19.3% on the last print, and MTD has grown FCF by 12% geometrically in the past five years. It printed $801 million ($34/share) in FY21. Similarly, EPS has averaged 16% YoY growth from FY18–FY21, ahead of 3-year average sales growth of 8.5%.
2. Attractive economics with potential 7% incremental buyback yield. Outside of its operational gains, the buyback program has been the cornerstone for shareholder value in this name, and continues to be so heading forward. FY22 guidance implies a $1 billion buyback ($43/share or ~4% of market cap), in line with previous approvals. At that cadence, earnings growth is highly probable. Since routinely repurchasing shares, the company has reduced shares outstanding by more than 16% to 23 million at the last filing, corresponding to a 330% growth in EPS, or CAGR 16% since 1997.
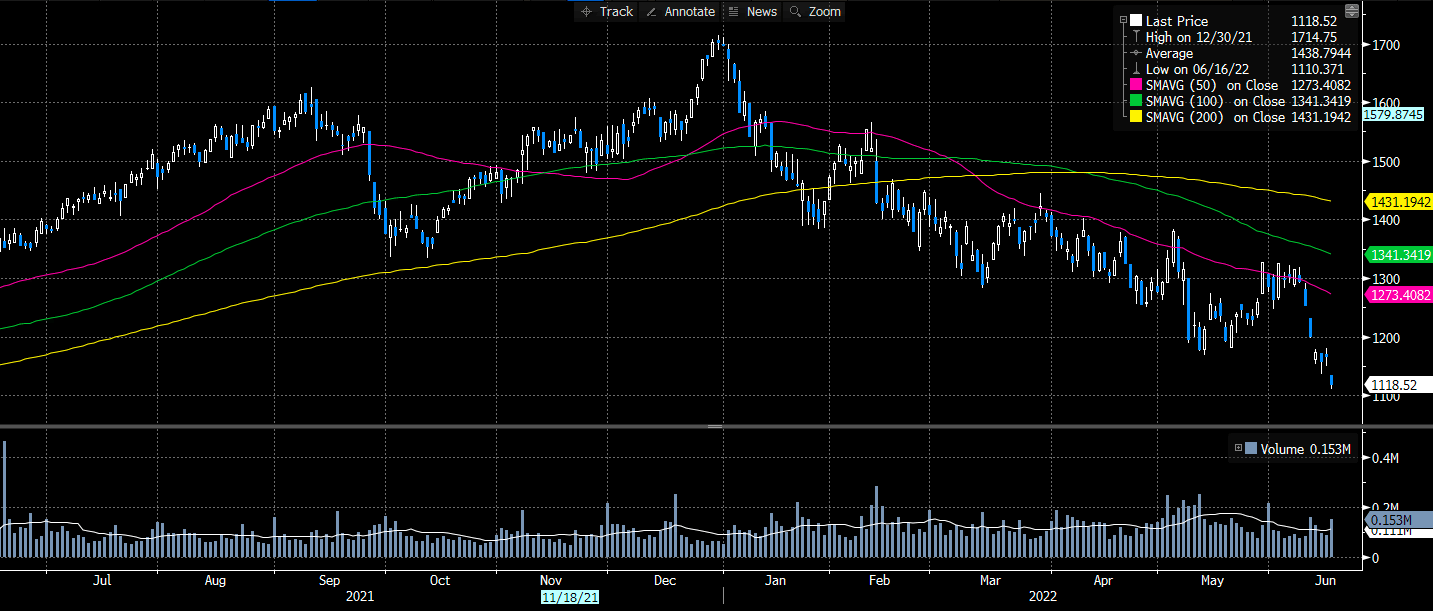
Exhibit 2.
Data & Image: MTD SEC Filings; Bloomberg; HB Insights
The evidence clearly shows that instead of concerning itself with the nuances of M&A, it simply rewards shareholders by repurchasing stock with its mammoth amounts of FCF. In the previous quarter, it spent $275 million to repurchase 190,593 shares at an average price of $1,442 per share. For comparison, the 50DMA was $1,417 whilst the 200DMA was $1,481 at the end of Q1. Back in Q1 FY21, it purchased at an average $1,167 per share on a 50DMA of $1,145. The average premium MTD paid is ~2% on these figures.
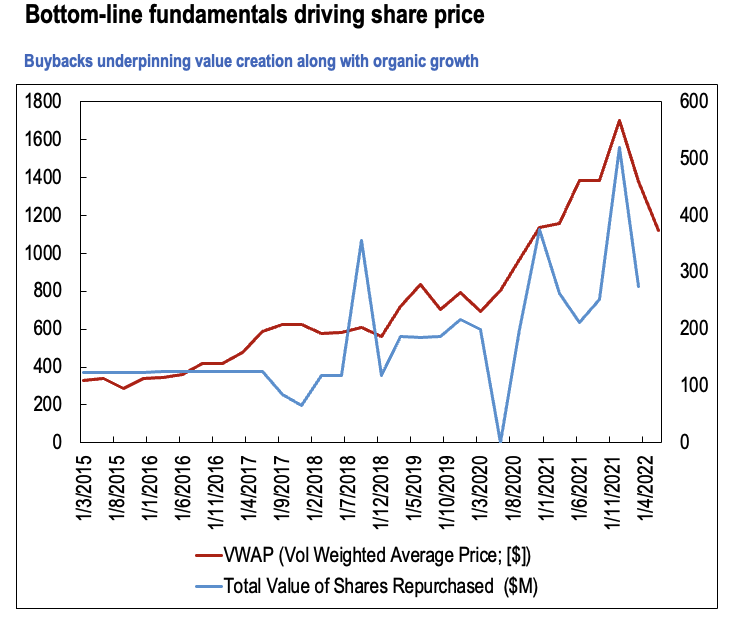
Exhibit 3.
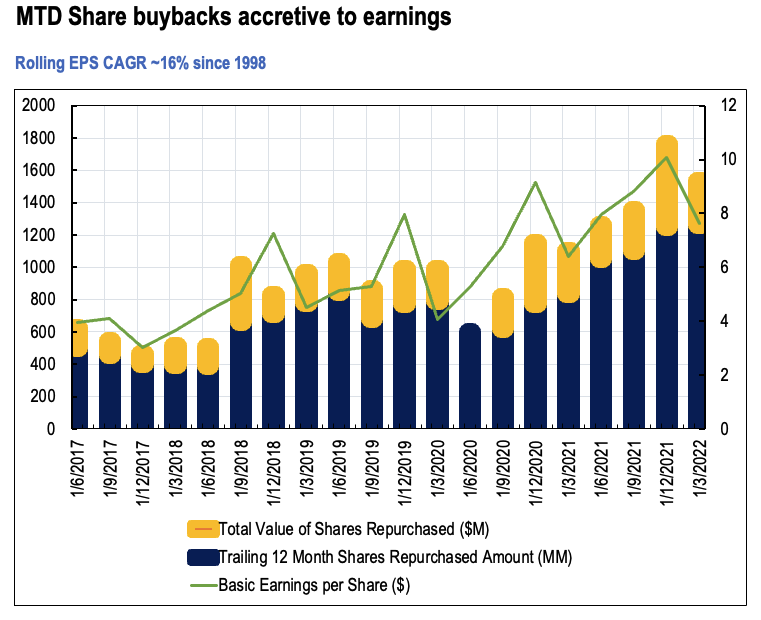
Data: MTD SEC Filings 1998–2022 Image: HB Insights
MTD expects to repurchase ~$1 billion of shares in FY22, leaving $750 million to play. It has another $1.8 billion in total authorised. On this basis, MTD’s “buyback yield” for FY22 is 3%–4% relative to its current market cap. The remaining capital ($1.8 billion) offers a 7.09% forward buyback yield with these assumptions. Our modeling also suggests that every $100 million produces ~$0.15 in EPS accretion with a volume weighted average price (“VWAP”) of ~$1,200 per share. Assuming another $275 million repurchase in Q2 FY22, this implies another $0.41 in EPS for the coming quarter, ~$1.25 annualised.
3. Next, addressing assumptions made by the sell-side in its diagnosis of MTD’s perceived headwinds. We demonstrate the thinking is off the mark here. About 90% of MTD’s top line is exposed to its laboratory and industrials segments. MTD’s grasp on precision instruments is a standout – it measures as one of the top suppliers of precision instruments and services in the world. But its portfolio is well diversified both segmentally and geographically. Laboratory revenues comprise ~57% of total revenue, with industrial exposure supplying 38%, foot retail the remainder. Within industrials, a blend of segments drive revenue growth, including transport plus logistics, weighing instruments, and industrial terminals to name a few.
The wider laboratory sector is traditionally more defensible due to lower equipment costs and a more benign pricing environment. Moreover, the laboratory segment is far less sensitive to macroeconomic crosscurrents. Opportunities for margin decompression exist in the sector due to price inelasticity and low fixed costs in equipment pricing. The same is roughly true for end-markets adjacent to laboratory.
MTD revised guidance last earnings and management now forecasts ~$4 billion at the top, calling for 8% in top line growth, ahead of consensus’ 7.3%. The upgrade rests in-line with three-year normalized sales growth of 8%, ~100bps below the GICS Industry peer median’s 9%. Therefore, ~57% of MTD’s top line is defended by a sustainable, stable growth outlook, and is positioned to absorb macro-headwinds as well.
Moreover, industrial sales grew 12% YoY last quarter with 15% upside in the core industrial segment. Growth was underscored by performance in China – a key market for MTD – with ~20% YoY expansion in Q1 FY22. MTD’s FY22 forecasts call for 18% YoY growth in industrial for FY22, alongside ~10% in laboratory. It also grew 15% YoY to 2021. The global industrial products and services market is estimated to grow at CAGR ~5.5% into FY28 with contrary research implying CAGR ~5% into FY26. MTD’s sales momentum in its industrial division is therefore poised for an above-market growth schedule, suggesting it will capture market share from competitors.
4. Operating margin is therefore well supported by revenue in this segment and has plenty of headroom to absorb cost pressures down the P&L, by estimation. This is a clear upside factor in the investment debate, especially in the current macro climate. Our research indicates that oscillations in global producer price index’s (“PPI”) and global purchasing managers index’s (“PMI”) are traditionally destructive to margin growth within large-cap life sciences. Both measures have curled up amid soaring inflation.
Yet, MTD printed operating margins of ~27% in Q1 FY22, a ~70bps YoY increase, aloft three-year operating margins of 25% and above the industry’s 16%. The loosening of operating margin secured a 50% YoY gain in operating profit. It was underlined by revenue volumes and the pull-through of vertical supply chain initiatives from 2020, that saw gross margin hold flat YoY in FY21 and Q1 FY22 at ~58%. MTD therefore benefited from pricing tailwinds in Q1 and management forecast a ~400bps tailwind from pricing in FY22, up from 350bps previously.
Operating leverage normalizes to 1.54x from Q4 FY19–Q1 FY22′ whereas FCF leverage averages more 2.5x in the same time, with earnings leverage of ~1x. MTD realizes this incremental leverage to operating income and earnings due to its low fixed cost base in laboratory. Therefore, as MTD builds more torque into its revenue fly wheel, it looks set to ratchet up FCF at pace in the same vein.
Exhibit 4.
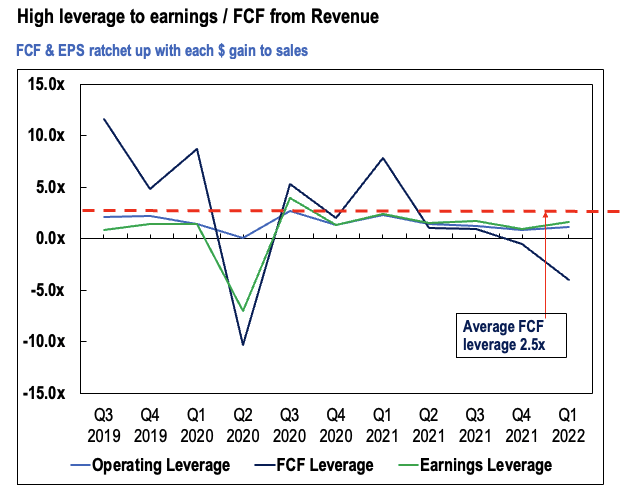
Data: MTD SEC Filings 2019–2022; Bloomberg. Image: HB Insights
The company’s top line is also hedged due to its geographic diversification. Roughly 35% of sales stem from emerging markets, however, MTD’s growth engine is powered by its exposure to China and APAC. Whilst sales results have been lumpy from the region in recent times, APAC revenue has been an integral driver to top line growth over the last 10 years. Sales growth in China printed 25% YoY in FY21, accounting for almost 20% of total revenue volume. Management project another 10% YoY growth in China in FY22 against a difficult comparison period in H1 FY21. Benefits of MTD’s geographical diversification were on full show last year, securing a 20.5% recovery in sales volume from FY20.
5. MTD has a repeated history of earnings surprises, regularly outpacing its own guidance. The pattern was seen again in Q1 following management’s upgrade to FY22 guidance. With the rebound of Chinese demand, coupled with a receding of COVID-19 headwinds, the main challenge that remains is non-specific to MTD – supply chain. This is a systematic risk that requires extra prose in diversifying away. Think logistics plays, such as GSL, or commodity-based hedges for respective end-markets.
Exhibit 5. Earnings surprises have been the norm
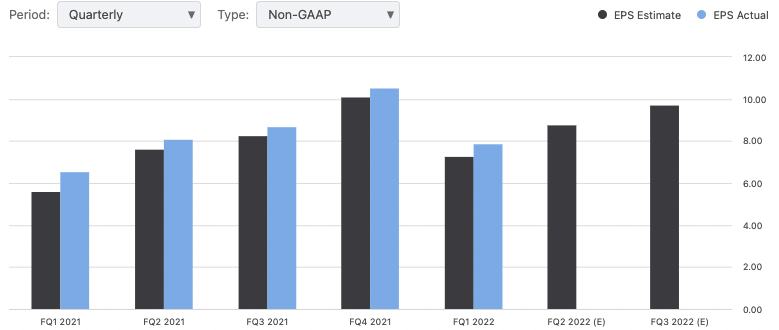
Data & Image: Seeking Alpha MTD EPS History & Estimates
In that vein, MTD’s profitability commands a valuation premium and further quashes the sell-side’s thesis. ROA has surged up from 19% in Q1 FY19 to ~25% in the last print, whereas ROIC has crept up from 30% to ~40% in the same time. MTD’s lifted gross margins by ~150bps in this time and added ~$5 million incremental operating margin last quarter. It’s managed this with sound management over the balance sheet and working capital.
It has reduced net leverage to 1.5x whilst accounts receivable turnover has ticked up to 6.4x last quarter. Days sales outstanding also narrowed to 57 days from 61 days YoY, whilst inventory turnover is tight at 4x. As a result, MTD’s cash conversion cycle has remained flat at 97 days since Q1 FY20, same with inventory to cash days. This has occurred as total inventory value has gained by ~53% in this time.
Valuation – MTD justifies premium to peers
Shares are trading at ~28x our FY22 EPS estimates, below four-year normalised P/E of ~41x. Shares also are priced at ~34x FCF, again below the four-year average P/FCF of 41x. Shareholders also realize a T12M FCF/share of $32 and have secured an average 2.6% FCF yield over the past 12 months. The sell-side (and others) continually penalize MTD based on its premium to multiples. However, closer inspection has us questioning what these analysts are even on about. It does all depend on what measure used, however, MTD currently trades in line on current P/E and offers far more realizable value in FCF/share.
Exhibit 6. On current prices, multiples are attractive v peers
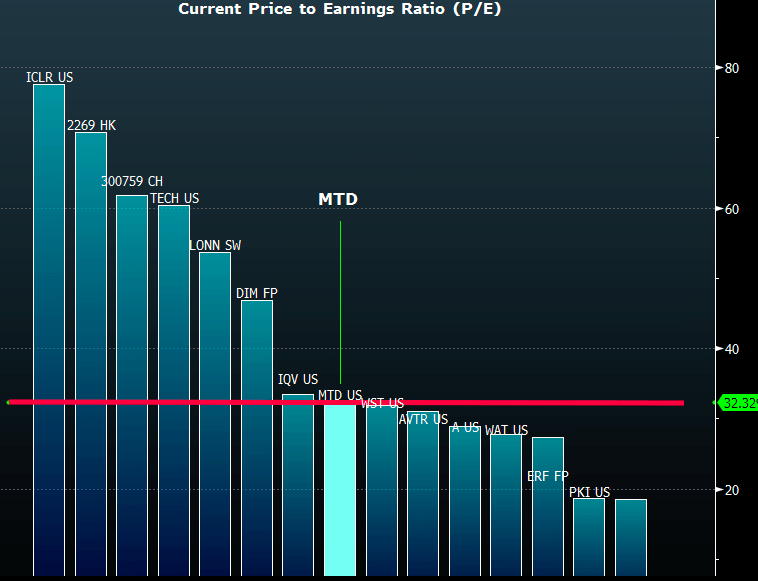
Note: Valuation premiums are absent on today’s multiples. The sell-side is discounting MTD on assumptive industry risk. The market is saying otherwise. Data & Image: Bloomberg.
Exhibit 6. The narrative changes when examining realised value (i.e. FCF)
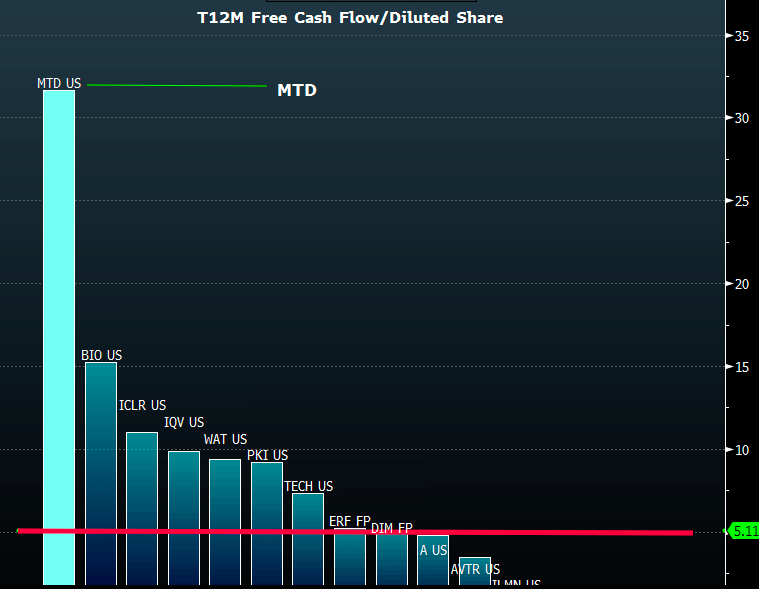
Note: The bear thesis overlooks the realisable value in shareholder return. Cash is king with MTD. Data & Image: Bloomberg
Shares are in fact commanding an average 24% premium across key multiples to the GICS industry peer median on a forward looking basis (Exhibit 7). The question is if this premium is justified. Some research suggests MTD is substantially overvalued, whilst the Street is put off by MTD’s premium to peers on a comps basis. What these parties miss is the premium MTD commands based on factors discussed in this report.
Exhibit 7. Multiples and Comps
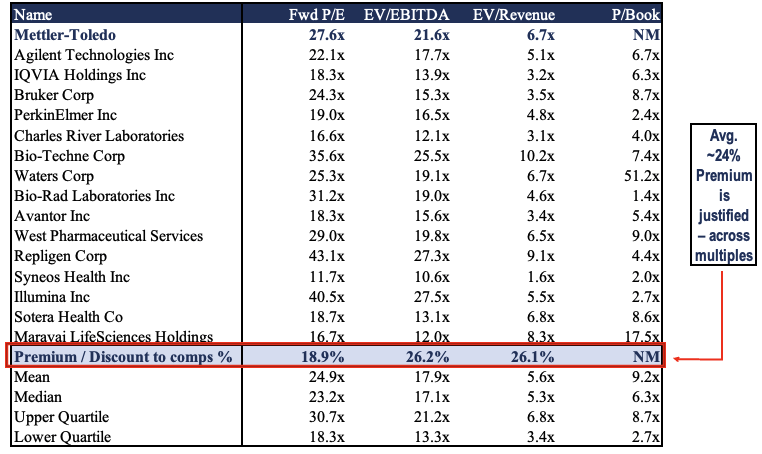
Data & Image: HB Insights
We argue this premium is justified on a number of fronts. The arguments above are front of mind – particularly around the buyback. Noteworthy however, is MTD’s high and predictable FCF schedule that’s offered shareholders equally high realizable value in FCF per share since FY15–date. The growth in FCF per share clearly demonstrates the realizable value MTD has created from shareholders, outside of operational gains and its repurchase program. Whilst “artificially” high due to a reducing share count, in absolute terms, FCF/share growth has surpassed the industry median’s $4.19 in the past seven years to date.
Exhibit 8. FCF/share growth adds to realizable value for shareholders

Data & Image: Bloomberg
Further dislocating the sell-side’s thesis from reality is the predictability of MTD’s future FCFs. An ongoing schedule of high FCF margins has produced a steady conversion of FCF for the company to date. There’s no reason to doubt this will continue, by estimation. With that in mind, we’ve forecasted a normalized growth for MTD’s FCF in the coming years. Our DCF model makes assumptions on MTD’s current share count – ~23 million shares – meaning values may increase as time goes on per the dilutive effect of its buybacks.
The valuation of MTD is then discerned by discounting the company’s future cash flows available to shareholders in today’s terms. Our modeling there’s a total of $1,560 in unrealized value for shareholders in FCF per share (Exhibit 9.), implying a large subset of future value yet to be priced into the stock.
Exhibit 9. DCF Summary
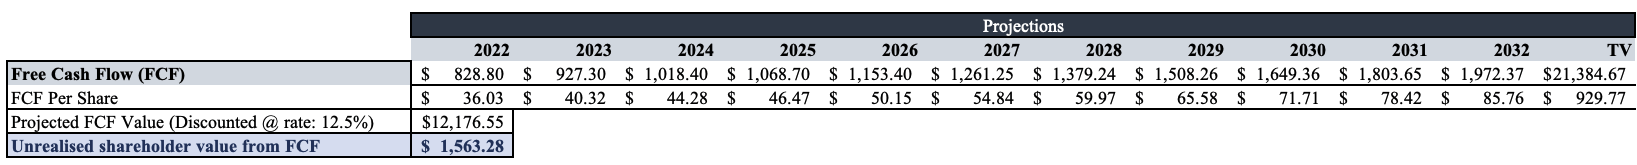
Data & Image: HB Insights
Further, utilising normalized price multiples often proves a cleaner forecasting tool, in our experience. Assigning the four-year normalized 41x FCF to our FY22 FCF estimates of $828 million yields a price target of $1,476. Although, this year’s FCF result is set to be behind schedule, as predicted. Assigning the same 41x forward FCF to FY23 estimates, and discounting this back at 12.5% – a rate that reflects the opportunity cost of holding the SPX + current yield on long-dated treasuries – sets a price objective of $1,468. Some might argue the 41x forward target is unreasonably high. However, to push back, MTD commands a premium in this domain given its superior cash flow metrics and tangible shareholder value in FCF/share that sits well above the peer group.
An unambiguous set of measures is also required to understand the market’s psychology behind the stock as to where it could head next. Point and figure (“P&F”) charts display these directional moves without the noise of time. Our P&F charting on a daily chart suggests points to multiple upside targets in the $1,386–$1,466 regions. Price action has broken below the bullish trend line and we await further direction on this. Further downside may establish potential targets at ~$1,207 although this has not yet activated. This needs to be factored into entry decisions, as further pullback could widen the buyback yield further.
Exhibit 10. Multiple price targets, tilted upside

Data & Image: Bloomberg
Blending these five inputs on an equal weighted basis yields a price target of $1,471. We’re therefore seeking a return objective of 31% or $352/share before revisiting the position. Importantly, these assumptions are all anchored to a share count of 23 million shares. This figure is likely to tighten however, meaning per-share metrics are likely to jump accordingly. Earlier we calculated the FY22 buyback yield based on MTD’s pattern of buybacks at 4%, and any forward share price targets need to have this adjustment applied, presuming MTD will continue paying an average 2% premium.
Applying the adjustment sets our price objective to $1,529. The return objective is 36% or $410 per share. Market makers support this kind of risk/return too. Goldman Sachs’ venue offer of a Mettler-Toledo turbo long with a strike of 1.169,1362 was knocked out on 13 June. Similar priced turbo structures are offered on the long-side on venue up to the 1.112 strike with 7.3x leverage with June 16 knockouts.
The next question becomes how to position MTD within an equity-based portfolio? Assuming no cardinality restraints (number of securities) or asset selection restraints, and long/short allowances, we’ve run a number of scenarios on our own portfolios to understand how MTD can slot into to a diversified, cross-asset/multi-factor portfolio. Below shows the allocations of our cross asset long/short strategy as it’s positioned on 16 June 2022.
Investors can note the change in positioning from 2017–December 2021 to Jan–June 2022 below (Exhibit 13). Notice that we’ve de-levered and reduced long equity exposure, and tightened up fixed income holdings. Exposure to alternatives is dotted throughout our equity plays. We’ve also opened up our directional equity hedges that came into the money as of May 2022.
Exhibit 11.
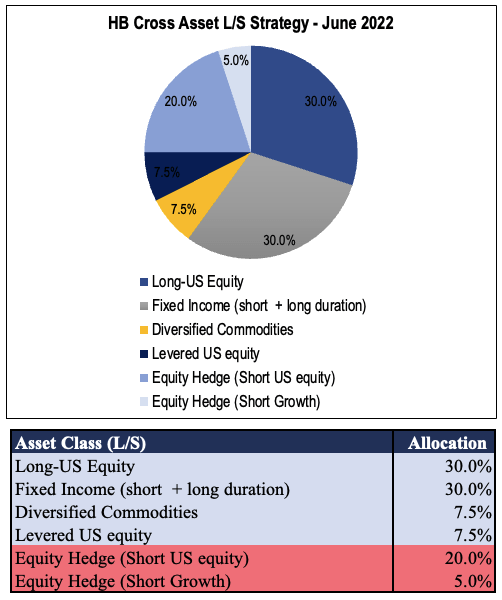
Data & Image: HB Insights
Exhibit 12.
Data & Image: HB Insights
Exhibit 13.
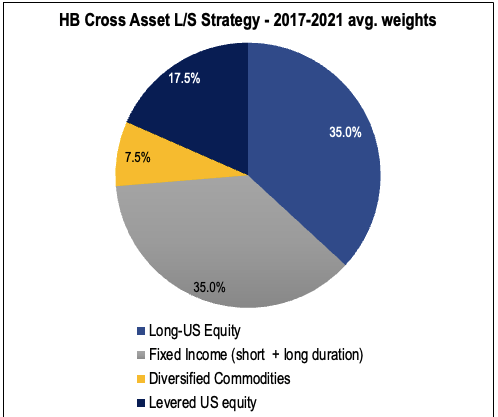
Data & Image: HB Insights
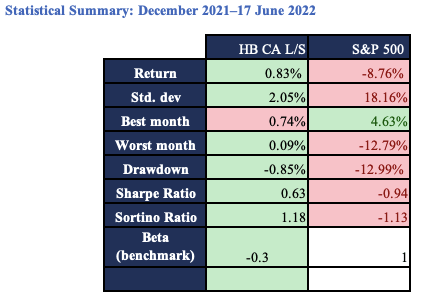
The examination period is from December 21′ to June 16, 2022. The aim is to blend MTD within equity at an opportunity cost. In the current (Exhibit 11) setup, our findings indicate a long MTD position up to a 0.5% weighting as a speculative, directional equity play has potential to maintain the current level of return without impeding the level of drawdown and Sharpe/Sortino ratios.
Exhibit 14. MTD Inclusion – negligible change to base stats. with 0.5% weighting
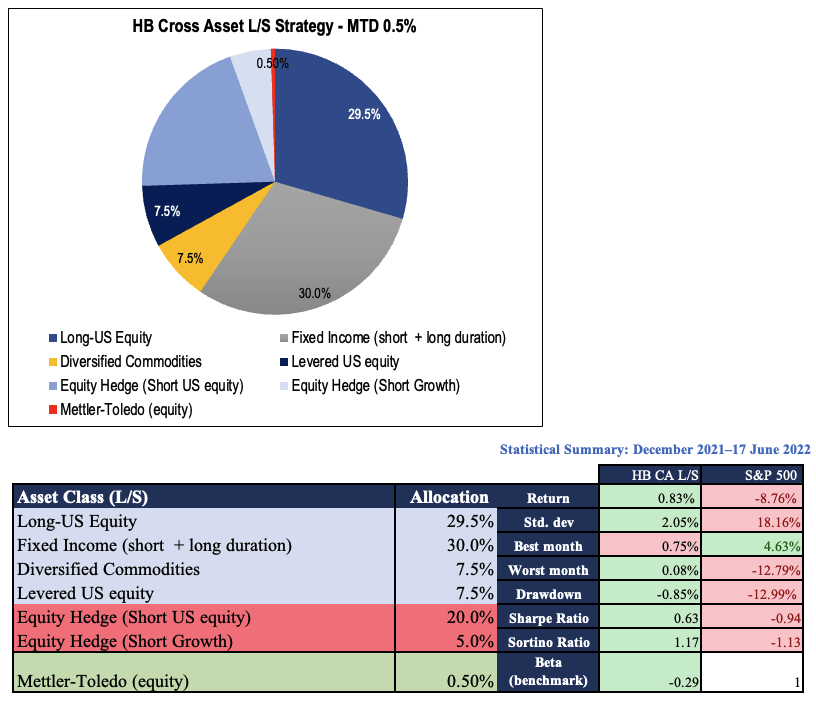
Data & Image: HB Insights
Anything above the 0.5% hurts each of these. Even a 1% holding increased drawdown to ~1%. Note, there are anywhere between 26–72 security holdings at any one time in this strategy. With MTD’s inclusion on a 0.05% weighting, differences in the statistical summary are negligible. Questions do arise on the applicability of a 0.5% yield in some portfolios. These portfolios are constructed by quantitative and fundamental analysis, without parameters on turnover or transaction cost in the composite. Carry cost and a volatility weighting is included in the composite. That’s food for consideration. There’s also case to be made with the 4% yield, offering further downside cover, advocating for a larger weighting. The return objective is ~36% under these constraints.
Technical Studies
On a six-month daily cloud chart, shares are trading below cloud support and have tested resistance on 2-3 occasions in the last five months. Downside activity isn’t sharp, however, and prices have been mean reverting whilst sliding into the red. The stock recently hit its 52-week low and the angulature of on balance volume (“OBV”) has continued within its longer-term uptrend sustained over the last 12 months. Shares are therefore at a key level and must show a turning point to conform to trends indicated by OBV. Momentum also has slowed right up lately and has remained cyclical in nature. We’d argue this is seldom a momentum play, however. These technicals are neither bullish or bearish, by estimation.
Exhibit 15. Trading below cloud support
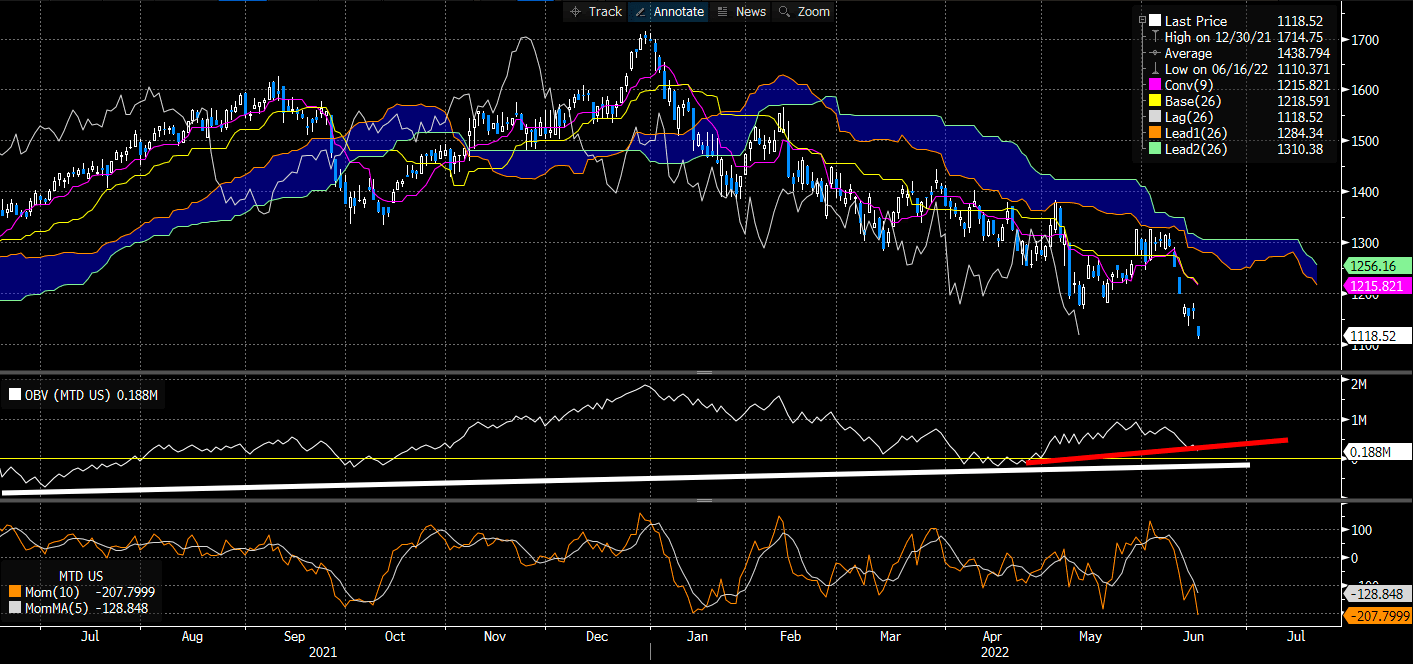
Data & Image: Bloomberg
Not much else is to be gained from these trend indicators or additional charting analysis. Fundamentals appear to be driving this stock more so.
In short + risks
The adage of a great company versus a great investment is an appropriate thematic in MTD’s case. Arguments are made for the company’s strengths – robust FCF growth, sustainable FCF margins, diversified top-line, defensible industry, low fixed costs. However, the real flesh of the skeleton is in its buyback program, that’s averaged a tidy 2% buyback premium for investors on average over the past several years. The current MTD share price offers a 4% buyback yield, by our estimation.
That, coupled with numerous upside targets toward the $1,500 mark, we remain constructive on the name and seek a ~36%/$410 per share return objective, coupled with a potential 4% in buyback premium as mentioned. We price MTD at $1,529 and note a 0.5% weighting is suitable for a cross-asset long/short portfolio strategy.
To conclude, the key risks to this strategy are that MTD withdraws its buyback program, or incurs substantial losses in the coming years. The last two black swan events (GFC and COVID) saw the company stop repurchases to preserve liquidity. Should the buybacks be stopped, a large part of the investment thesis is unwound. This must be heavily considered into the investment debate as well.
Be the first to comment