

Solskin
Investment Summary
Following our reiterated buy thesis on Medpace Holdings, Inc (NASDAQ:NASDAQ:MEDP) in July, the clinical development and medtech company came in with an equally strong set of numbers in Q3 with upsides versus consensus at the top and bottom lines. Post-earnings drift has been tremendously strong to the upside over the past week, and MEDP now trades back at its FY21 market capitalization [Exhibit 1] – near its corresponding all-time high. Those holding the stock throughout its FY22 lows have enjoyed a 20.7% TTM return on equity with TTM EPS of $4.81, and investors can now enter long with the stock trading at ~30x forward earnings with the recent fundamental and technical momentum to the upside.
Here I’ve gone a little deeper than MEDP’s printed Q3 FY22′ numbers and siphoned the additional factors contributing to the MEDP investment debate. Net-net, we continue rate the stock a buy and revise the price target to $269 per share in the base case.
Exhibit 1. Return on the MEDP share price to FY21 market cap highs, recent rally well supported from fundamental and technical bedrock
- MEDP Share Price, Total Price Return FY19-Date
Note: Price return in USD. (Data: Updata)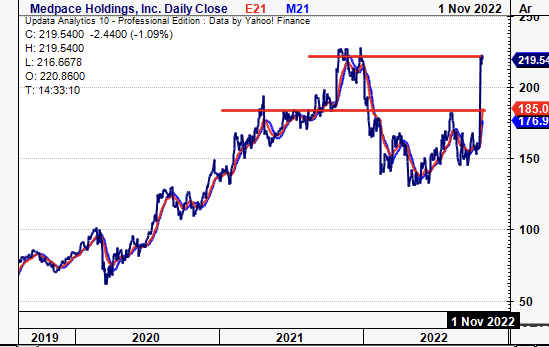
MEDP Fundamental Bedrock
What I mean when saying MEDP’s recent upside is supported by a ‘fundamental bedrock’ is more than just the company’s YoY changes [29.8% YoY growth at the top-line; 31% YoY growth in net operating profit after tax (“NOPAT”); and 58.9% yearly change in EPS]. MEDP is also tremendously profitable and has continued to grow return on invested capital (“ROIC”) and return on equity (“ROE”) on a sequential basis throughout the pandemic period-date, as observed in Exhibit 2.
The particularly important lines in the below Exhibit show ROIC and NOPAT earnings per share. Both illustrate upward mobility over the FY19 period to date. This is matched with a jump in NOPAT QoQ growth. Subsequent mean-reversion of FCF suggests the company’s capital budgeting cycle has come back into the money, with TTM FCF yields also rising to 3.7% at the time of writing [5.2% at the Q3 exit]. This is in-line with the previous year, albeit with 53% YoY growth in FCF.
Exhibit 2. Whilst GAAP numbers are strong NOPAT growth and ROIC are equally as robust and continue to exhibit growth through the capital budgeting cycle.
Note: All figures in $mm or [%]. All calculations made using GAAP earnings with no reconciliations. FCF calculated as [NOPAT – investments]. ROIC calculated as [NOPAT ÷ Invested Capital]. (Data: HB Insights, MEDP SEC Filings )
Meanwhile, there’s been some concern amongst analyst circles regarding MEDP’s drastically reduced on-balance sheet cash & equivalents, having narrowed 93.3% from $461mm in December FY21′ to $31mm by the end of Q3 FY22′. Net working capital [ex-cash] (“NWC”) also dipped to a $514mm outflow vs. $327mm outflow in FY21. However, in keeping with the above findings regarding MEDP’s NOPAT and ROIC, these numbers [and reduced cash balance] actually stack up incredibly well for the company in my estimation.
Moreover, per the Q3 10-Q, MEDP outlines the difference as “primarily due to share repurchases during the nine months ended September 30, 2022”. This isn’t a drain, leak or pull on liquidity, rather a capital budgeting move. As seen in Exhibit 3, the company’s ROIC and FCF have each curled upward since Q1 FY22 lows, whilst its net-cash burn continued to ensue. The divergence in cash balance to profitability is further evidence of MEDP’s ability to generate sufficient return from its investments. Second, the company also generated c.$109mm in CFFO during Q3 FY22′, whilst reducing its credit facility liability by $110mm, bringing the gross debt position to $139.7mm at the end of the third quarter from $952mm in December 2021. MEDP also has no notes or bonds outstanding.
Finally, the pace of cash burn aligns with trends in MEDP’s cash conversion cycle, as seen in Exhibit 4. The cash conversion cycle has crept up by a negligible 4 days since Q3 FY19, pushed by a similar jump in accounts payable turnover and accounts receivable collection days. Hence, whilst the overall cash balance is alarming on face value, cash on the balance sheet is not required and additional analysis shows profitability is at the centre of the mantlepiece for MEDP.
Exhibit 3. Despite cash & equivalents narrowing 93% in 6 months, MEDP compounds capital at double-digit rates of return and saw 53% YoY growth in FCF during Q3 FY22′.
Data: HB Insights, MEDP SEC Filings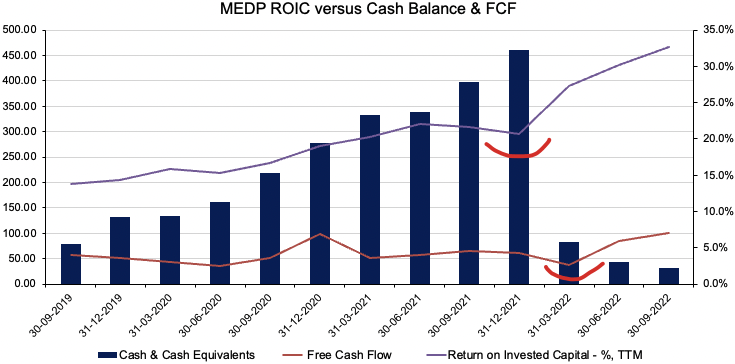
Exhibit 4. MEDP Cash Conversion Cycle, FY19-date
Data: HB Insights, MEDP SEC Filings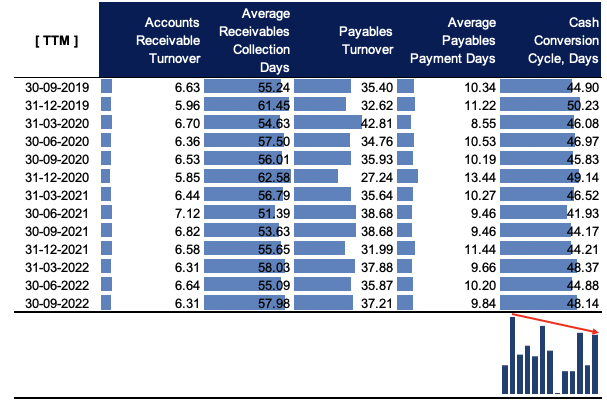
Supporting Technical Factors
Given the post-earnings drift exhibited by the stock since MEDP posted earnings on October 25, defined entry points and price objectives are critical to understand MEDP’s price evolution looking ahead. Fundamentals are supportive, but market mechanics also need to add up. I wanted first to examine just how authentic the recent moves in MEDP were, or if just a function of sector beta or even broad equity market beta. Equities via the SPX have posted the 3rd relief rally of 2022 after backing and filling throughout October. Investors continue to be buyers of major indices and this could inflect on the MEDP share price.
As seen in the chart below, MEDP has been gaining in strength relative to the S&P 500 health care equipment and life sciences index since July this year. The recent spike in October is corroborated with additional strength against the index, as observed. Of equal importance is the plateau in the company’s equity beta to the index, that has remained relatively constant – albeit above 1 – despite the various moves in both share price and index value. The October price action hasn’t disturbed the covariance structure of the MEDP share price to the index, suggesting the recent upside is in fact idiosyncratic and an alpha opportunity.
Exhibit 5. Despite uptick in share price and relative strength vs. benchmarks, equity beta remains plateaued indicating idiosyncratic return and therefore alpha opportunity.
Data: HB Insights, Updata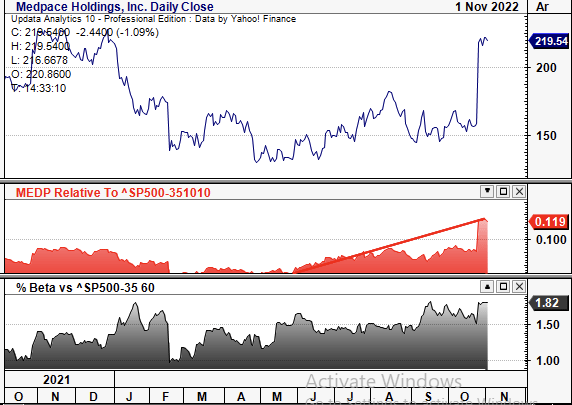
Further, on a 6-month daily cloud chart, shares have now punched up well above the cloud and the lag line suggests bullish price action ahead. Long-term trend indicators of on-balance volume (“OBV”) and momentum further illustrate the validity of the uptrend, particularly given the lift in OBV that began as early as September 2022, as seen below. With the gap-up in price distribution post-earnings, question now turns to what price objectives to expect with this investor activity and trend line.
Exhibit 6. Daily cloud chart with long-term trend indicators equally supportive of further upside potential
Data: Updata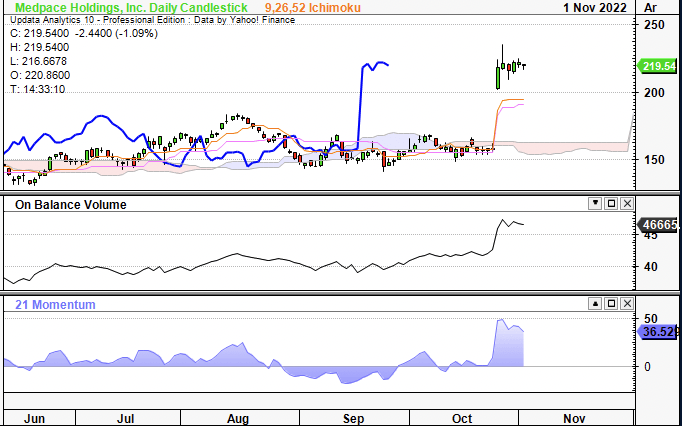
Valuation and conclusion
Objective price targets via point and figure (“P&F”) charting remove the noise of time. As seen below, daily P&F charting suggests bullish price action with multiple price targets above the $219 level. As this is a daily chart my estimation is that we will see further upside targets beyond the $225 level as we move through more sessions of the trading calendar.
Exhibit 7. Uptrend heavily enforced with P&F charting
Data: Updata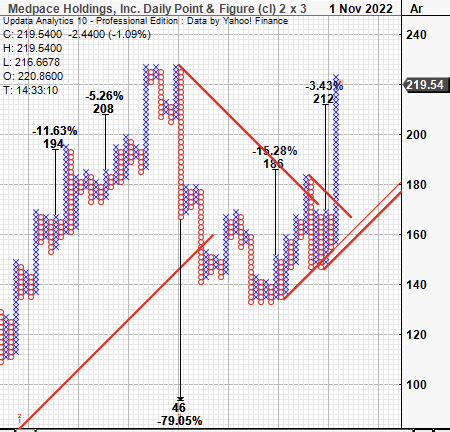
Our internal team also estimates MEDP to print $6.97 in EPS for FY22, a growth of ~45% YoY. As seen in the valuation model below, we believe the stock should trade at 38.6x forward earnings – a premium to the GICS Life Sciences industry peer median of 27.9x – versus the 31.4x forward P/E that is prescribed by Bloomberg consensus [a 22.9% difference].
At this multiple, we see shares trading to a price objective of $269, a return potential of ~23%. I’d also point out this is a substantial rise from our previous target as well, reiterating the bullish stance and buy rating.
Exhibit 8. MEDP Fair value; having no outstanding notes/bonds means the company’s WACC = Fair cost of equity.
Data: HB Insights US Equity Strategy, HB Insights Estimates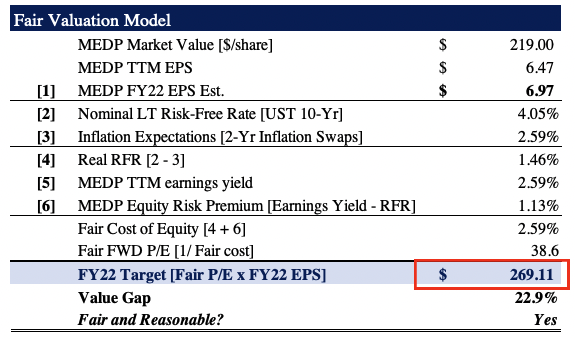
Where the valuation picture gets let down for MEDP is the fact it is trading at a substantial 16.5x FY22 estimated book value. This is a factor for consideration and a number we’ll keep a close eye on moving forward in order to understand what value the company is providing equity holders. For now, I’m happy with the premium to book value considering the profitability metrics outlined in this analysis.
Net-net, we continue to rate MEDP a buy and revise the price target to $269 per share. Numerous factors confluence to illustrate the company’s profitability – namely the ability to compound cash on its capital in the double digits, whilst growing sales, CFFO and NOPAT in the same process. Rate buy $269 price target.
Be the first to comment