

NATURAL GAS (HENRY HUB) ANALYSIS
- Heating degree days (HDD) look bearish
- Storage data scheduled this week
- Strong technical pattern unfolding
LNG FUNDAMENTAL BACKDROP
LNG spot prices remained relatively subdued this week after last weeks strong bearish move. Some positive news for Natural Gas bulls has come from a report done by McKinsey & Company who stated that “gas will be the strongest-growing fossil fuel” and “is the only fossil fuel expected to grow beyond 2030”.
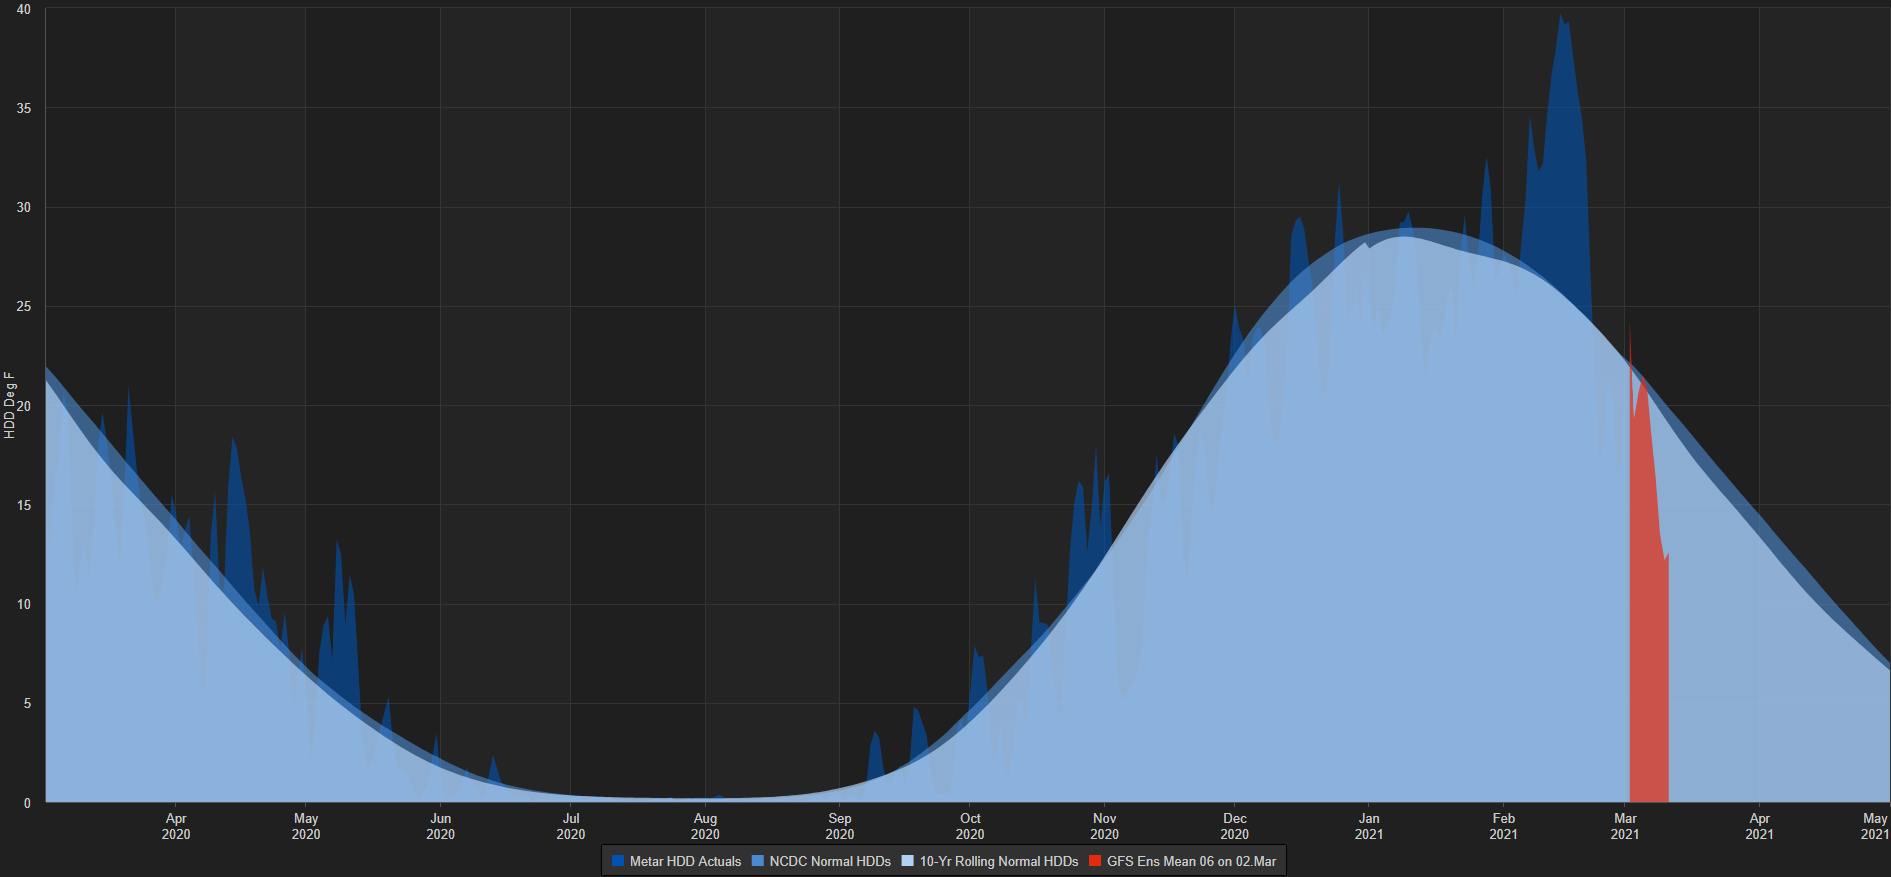
The recent downtrend shown in HDD’s do not serve well for short-term heating demand as temperatures are gradually rising. “Heating degree days (HDD) are a measure of how cold the temperature was on a given day or during a period of days. For example, a day with a mean temperature of 40°F has 25 HDD” – using 65°F as a standard temperature in the U.S.
US-LOWER 48 HDD, LATEST GFS VS. NORMAL
Chart prepared by Warren Venketas, Refinitiv
LNG STORAGE DATA
Previous storage data suggests stocks are (blue) lower than the 5-year average as well as lesser than the previous week. Thursday’s (March 4, 2021) data release could continue this trend but as overall export demand is on the rise.
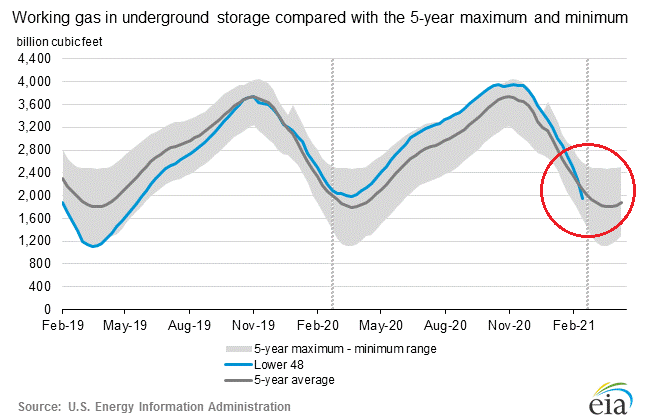
Chart prepared by Warren Venketas,EIA
Enhance your knowledge on Natural Gas with my Top Trading Strategies and Tips!
NATURAL GAS TECHNICAL ANALYSIS
Natural Gas weekly chart:
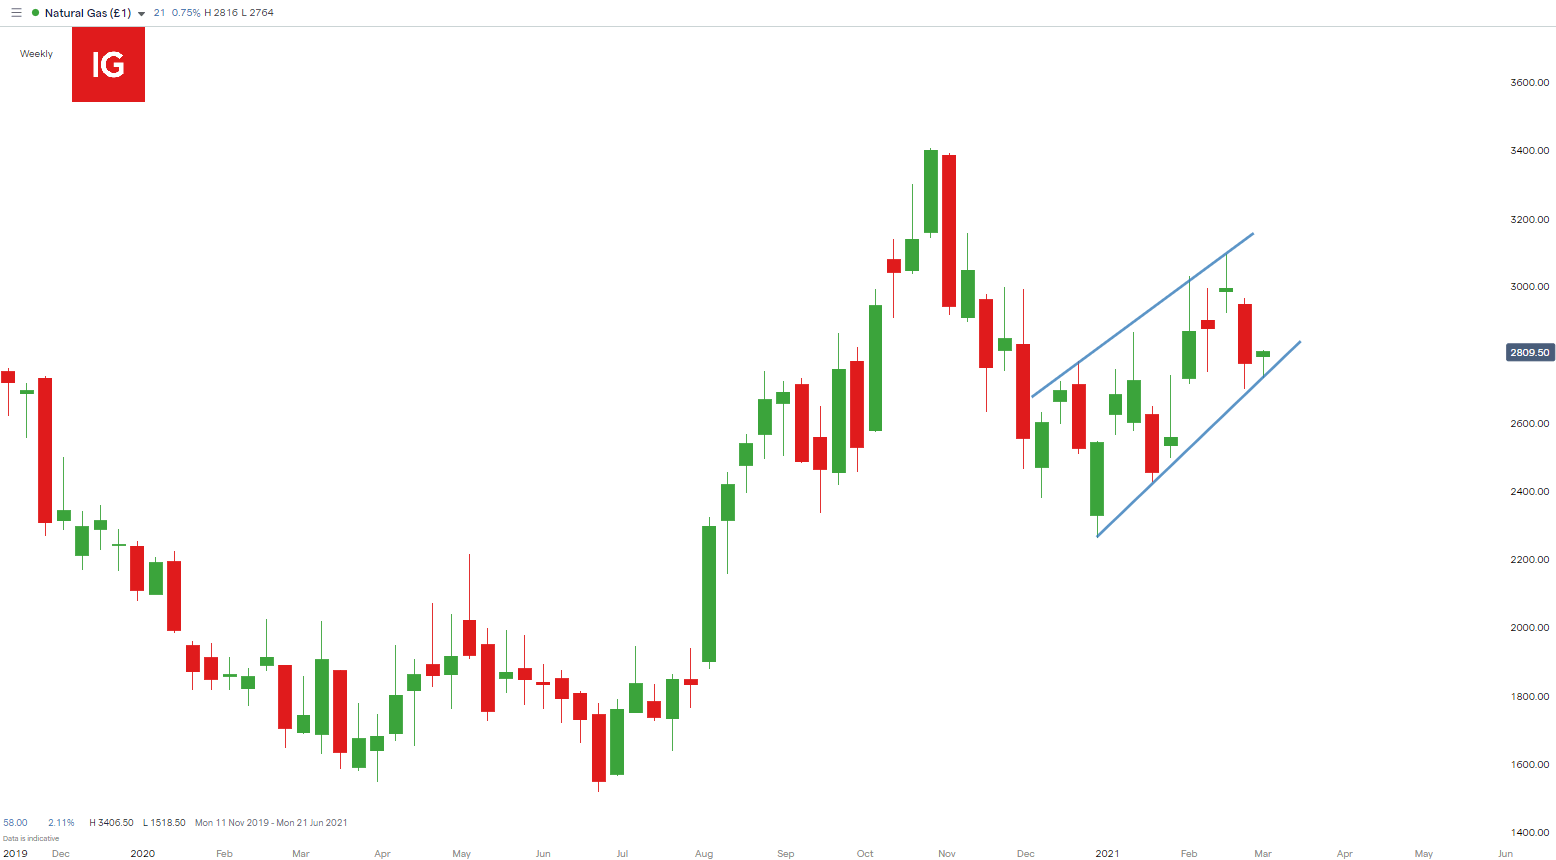
Chart prepared by Warren Venketas, IG
The weekly LNG chart continues to trade within the rising wedge formation (blue) with prices failing to trade above the 3.0000 psychological level at trendline resistance. The rising wedge generally associates itself as a reversal pattern which suggests a move to the downside should prices break below trendline support.
Natural Gas daily chart:
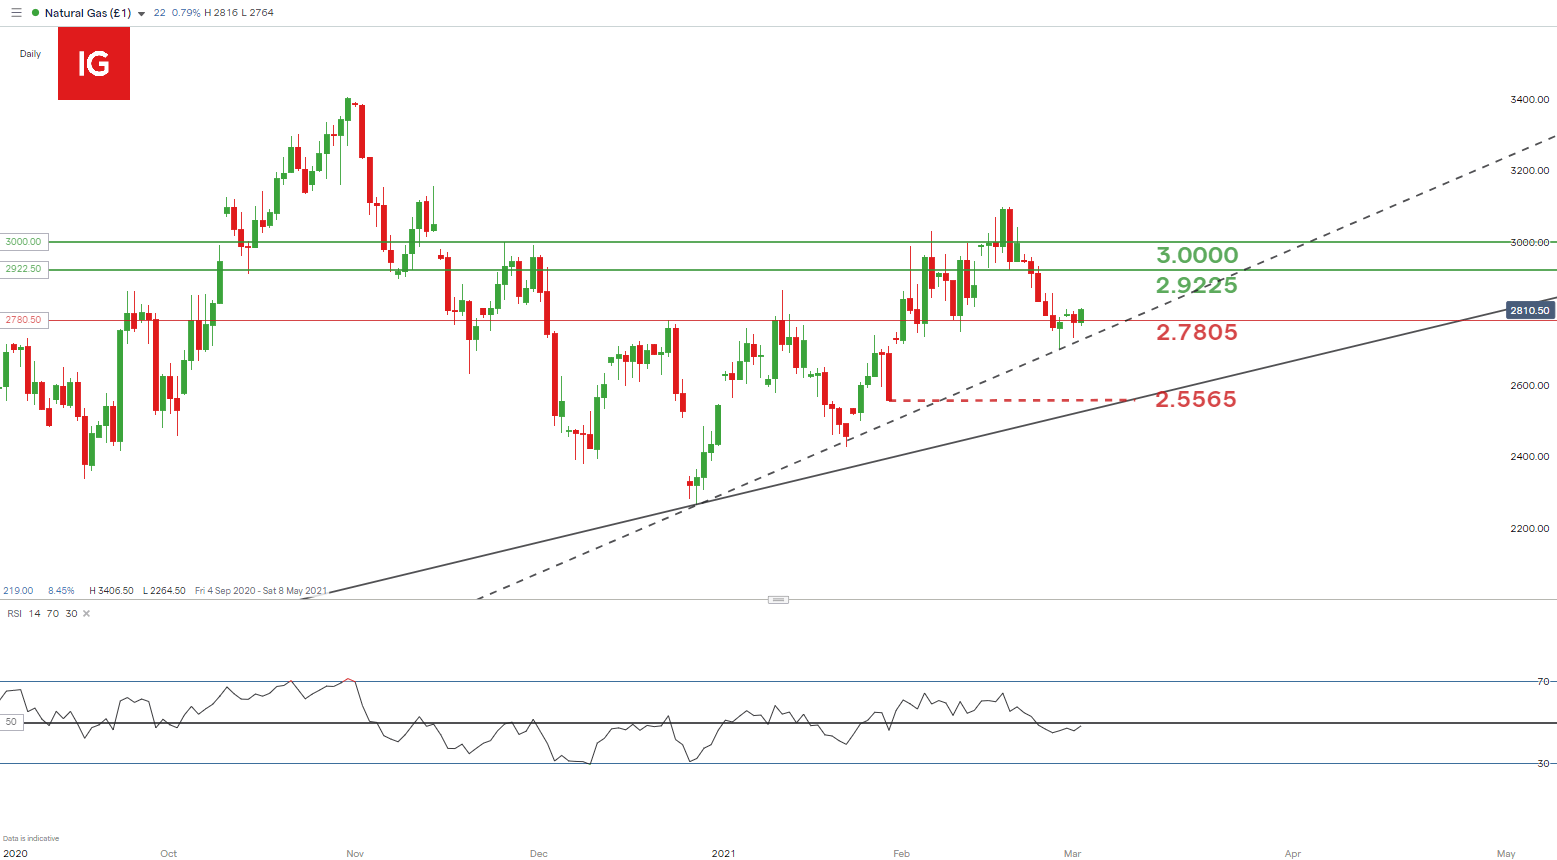
Chart prepared by Warren Venketas, IG
Focusing into the daily time frame, price action is currently trading at a precarious juncture as key short-term trendline support (dashed black line) is yet to be broken. Price rejection (long wick candles) around this support zone has been evident which could indicate short-term upside. Should the short-term trendline support fail to hold, the next area of confluence will be provided by the medium-term trendline support (solid black line) which may coincide with the 2.5565 January swing low.
The Relative Strength Index (RSI) remains around the midpoint (50) level which favors neither upside nor downside momentum. This further supports the recent consolidation in price which may be fueled by upcoming fundamental factors.
Form a bullish perspective, a push toward 2.9225 will serve as initial resistance should short-term trendline support hold.
Starts in:
Live now:
Mar 02
( 18:03 GMT )

Keep up to date with price action setups!
Trading Price Action
Key technical points to consider:
- Rising wedge on weekly chart
- Resistance at 2.9225
- Support trendlines
— Written by Warren Venketas for DailyFX.com
Contact and follow Warren on Twitter: @WVenketas
Be the first to comment