


da-kuk
International investing risk hops from one region to another right now. Europe was the focal point of selling early in 2022 after China led emerging markets lower in 2021. The world’s second-largest economy is back in the negative spotlight following last weekend’s elections.
President Xi Jinping won re-election, as expected. What shocked financial markets, though, was the severe reaction to risky assets in China with all ETFs related to the region suffering big on Monday. The Chinese Yuan also cratered to a fresh all-time low. The turmoil comes as the country’s Q3 GDP report revealed a stronger-than-forecast growth figure.
USD Climbs To New Highs Against The Yuan
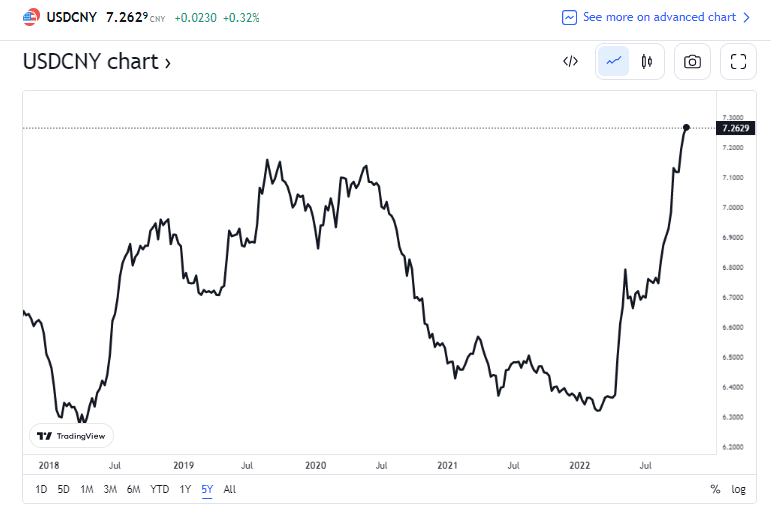
TradingView
At the heart of the selling pressure are Internet-related shares that have endured steep selling since early last year. At the low on Monday, the KraneShares CSI China Internet ETF (KWEB) was down a whopping 84% from its peak last year. The ETF broke below its March lows, a spot from which a major 67% bear market rally began.
KWEB Notches Fresh Lows, Under the March Trough
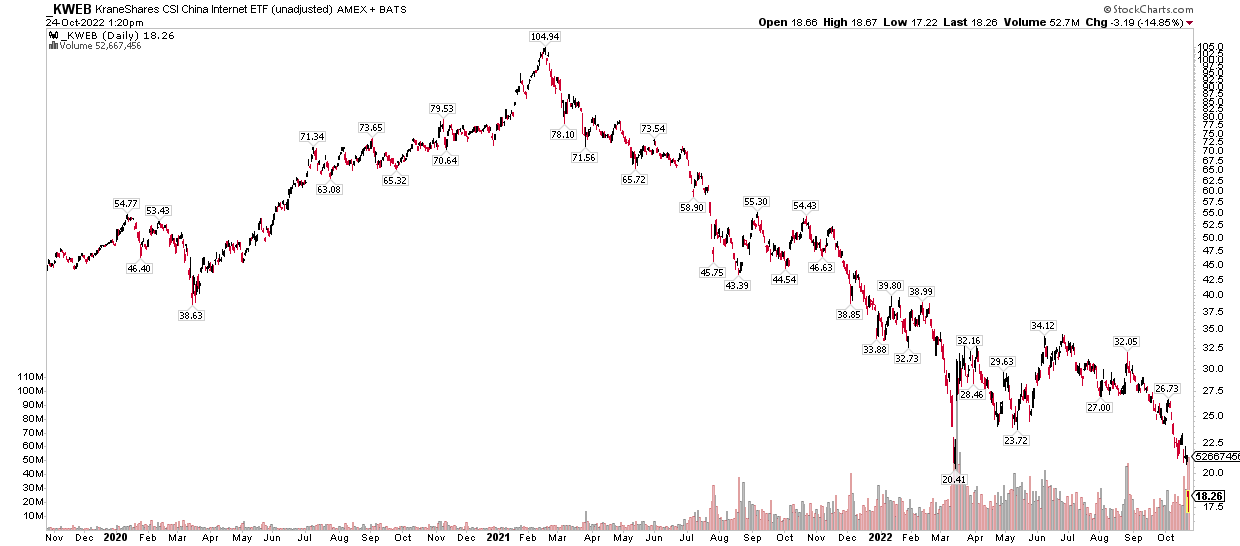
Stockcharts.com
More broadly, there are a few China country funds that investors have been dumping hard to start the week. The iShares MSCI China ETF (NASDAQ:MCHI) tracks the investment results of an index composed of Chinese equities that are available to international investors, according to iShares. I outlined a value case for the fund back in August, but also was sure to note lackluster technicals and to buy the fund on a bullish breakout from its prior trading range. That, of course, did not pan out. It’s now on watch for another leg lower in its trend down from 2021. Sometimes paying closer attention to the charts is wise, despite what the P/E multiples show.
But what’s the trade now? We will not get a refresh on valuation measures until later in the week, but according to Morningstar, as of last Friday, MCHI traded at just a 9.6 price-to-earnings ratio compared with the USA’s multiple near 17. The fund pays a 2.3% yield, which is not particularly impressive relative to other countries and regions. Expect high volatility with this large-cap ETF while its long-term earnings growth rate is solid at 10%. The fund is 11.5% weighted in Tencent (OTCPK:TCEHY), 8% in Alibaba (BABA), and lesser percentages in its other 631 holdings.
MCHI Factor Profile And Key Style Measures
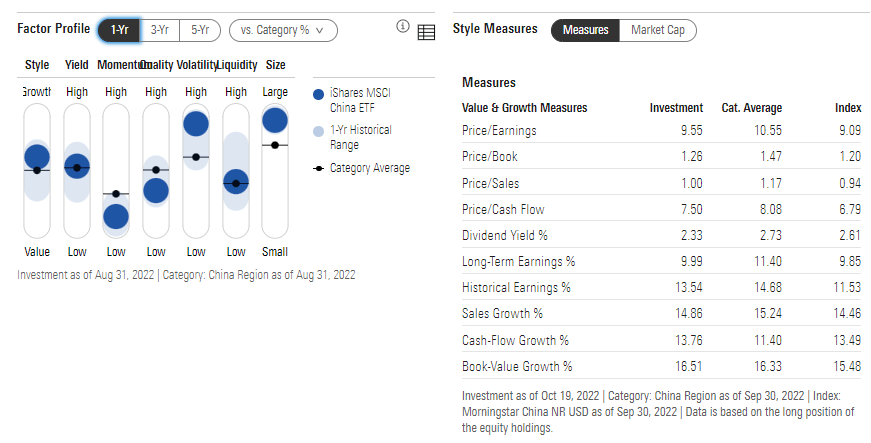
Morningstar
One-Day Performance Heat Map: A Sea Of Red Across China Today
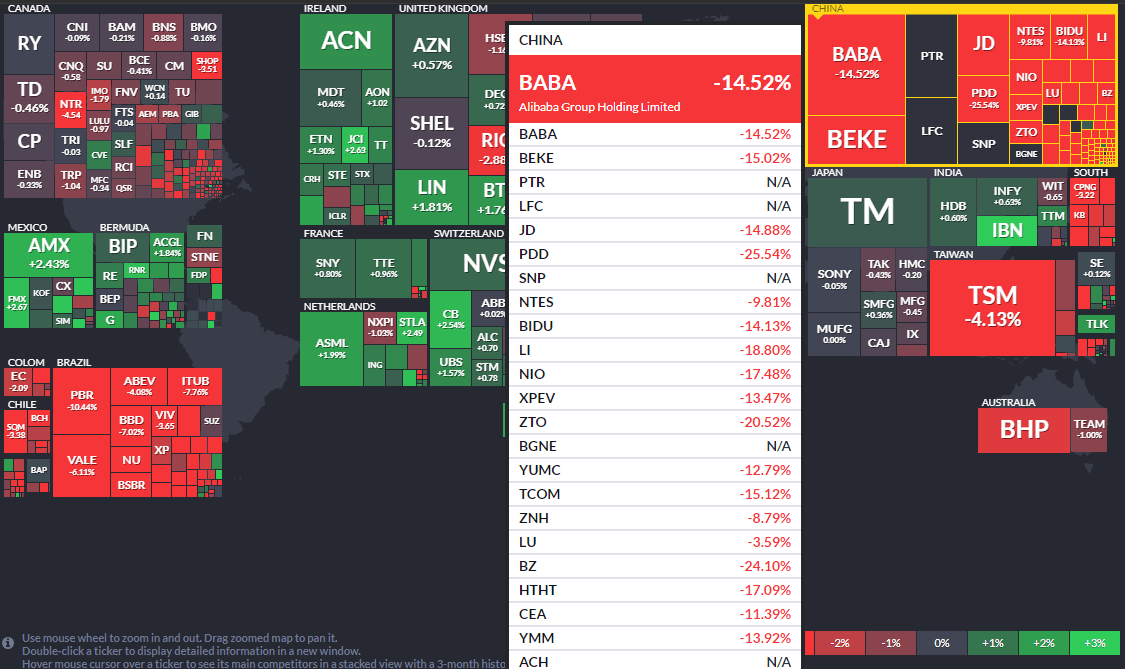
Finviz
There’s considerable headline and political risk with China – made obvious by today’s move. It remains to be seen whether this plunge is indicative of a capitulation type of event or if it is yet another move in the trend of larger degree. Let’s dig into the chart to spot clues.
The Technical Take
Remarkably, MCHI is testing its all-time lows going back to 2011. The ETF held that spot during global turmoil in early 2016 before a multi-year rally began. Sometimes it’s hard to imagine a turnaround ever happening when shares drop so hard in less than two years, but MCHI nearly tripled in just five years to early 2021 – with a 35% haircut along the way.
Traders should use the $33 to $35 zone as their bogey. Given the high-volume dump today, it could be worth a swing long with a stop under $33. Profits should be taken, though, should MCHI rally back up to resistance that begins around $50. While the 2016-2017 rally looked easy in retrospect, this time there could be much more wood to chop given the overhead supply that appears to linger in the $50 to $65 range. Also, notice how the weekly RSI confirms the new low in price – that’s a clear bearish signal.
MCHI: Long-Term Chart Shows Potential Support, But Also Major Bearish Overhead Supply
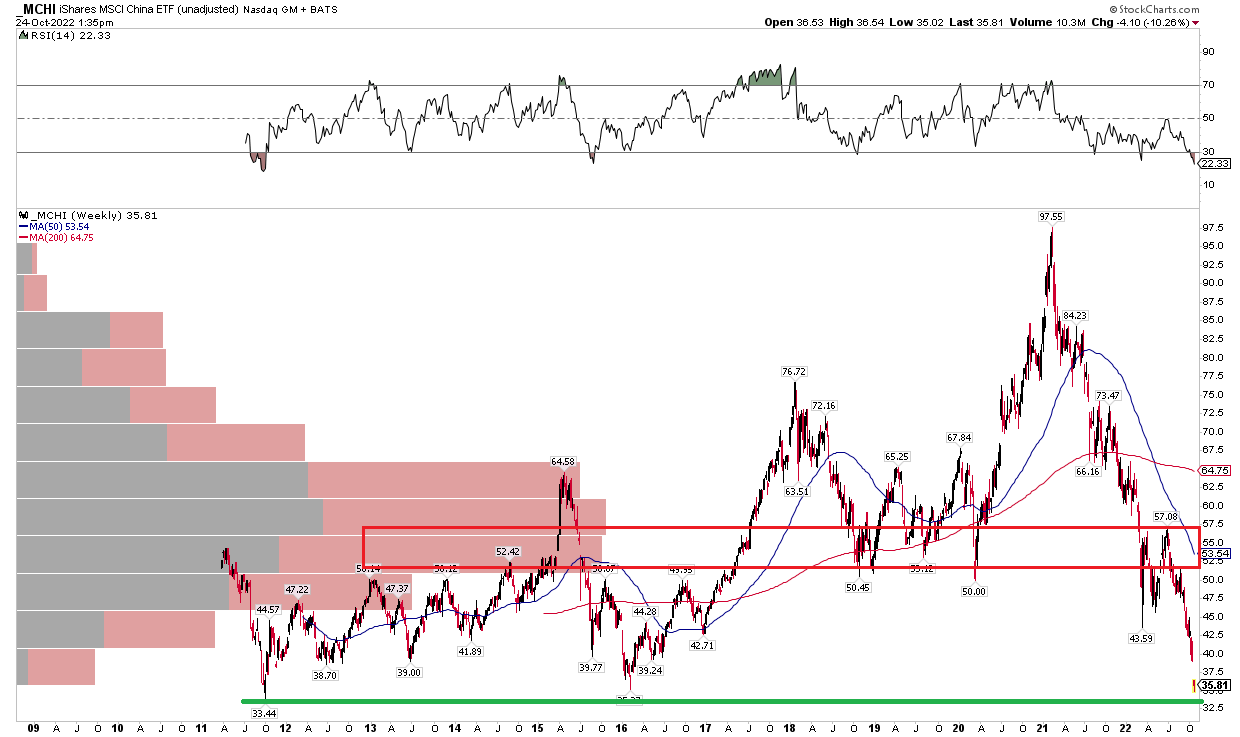
Stockcharts.com
The Bottom Line
Going long here for a trade on MCHI could work based on possible capitulation after a more than 18-month collapse in MCHI shares. A risk management stop under $33 is key, however. More concerning might be its limited upside given significant overhead resistance. While gut-wrenching, long-term investors should not panic today. China is notorious for major booms and busts, and we’re more likely toward the end of a bust than the beginning.
Be the first to comment