

marchmeena29
Another thing: inflation. Just when you thought the construction cost spike was abating, it hit a new record.
Sales of new single-family houses have been zigzagging along low levels for months. In October, they rose 7.5% from September, after having plunged 11% in September, according to the Census Bureau on Wednesday. At a seasonally adjusted annual rate of 632,000 houses, they were down 5.8% from the already low levels a year ago and down 37% from two years ago.
These sales are based on signed contracts between buyer and homebuilder, and they’re no indication of how many of those deals actually close. And those sales that actually close are far lower amid a huge wave of cancellations. Homebuilders have been lamenting those cancellation rates for months. But those cancellations are not reflected here. We’ll get to them in a moment.
New Single-Family Houses Sold Annual Rate (In Thousands, Seasonally Adjusted) (Author)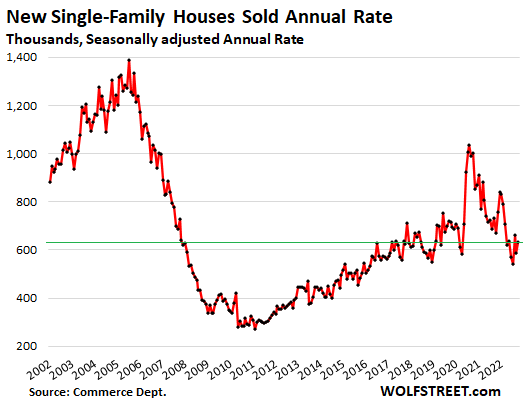
A similar plunge occurred in sales of previously owned homes: -34% from peak in October 2020 and -28% from a year ago.
Homebuilders reported plunging traffic of prospective buyers of new single-family houses, according to the National Association of Home Builders last week. Its index of Traffic of Prospective Buyers has plunged for eight months in a row, and in November fell below the May 2020 level.
Beyond the lockdown low of April 2020, it was the lowest since 2012, during Housing Bust 1. But this time, the descent has been far faster than during Housing Bust 1.
NAHB/Wells Fargo: Traffic Of Prospective Buyers (Author)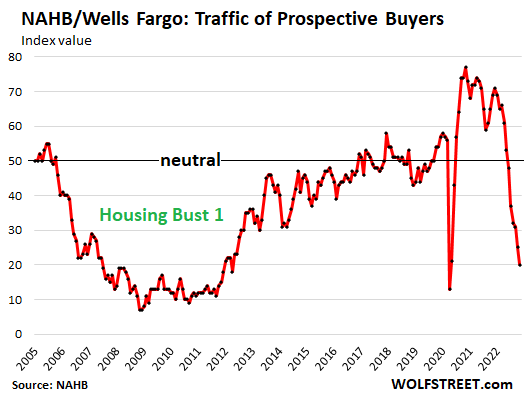
Cancellations Spike, Worst in the Southwest
And many of those folks that do show up to look at a house, and that then do sign a sales contract are massively getting second thoughts, followed by buyer’s remorse, followed by canceling those contracts – and those spiking numbers of cancellations are not included in the new-house sales data by the Census Bureau above, which just tracks signed contracts.
According to the homebuilder survey by John Burns Real Estate Consulting – with a sample size of roughly 20% of all new home sales – the cancellation rate spiked to 25.6% in October, up from a rate of 7.9% in October 2021 and from 10.9% in October 2019. Over a quarter of the signed contracts are cancelled! Chart via Rick Palacios Jr., Director of Research at John Burns:
Homebuilder Cancellation Rate: National (John Burns Real Estate Consulting)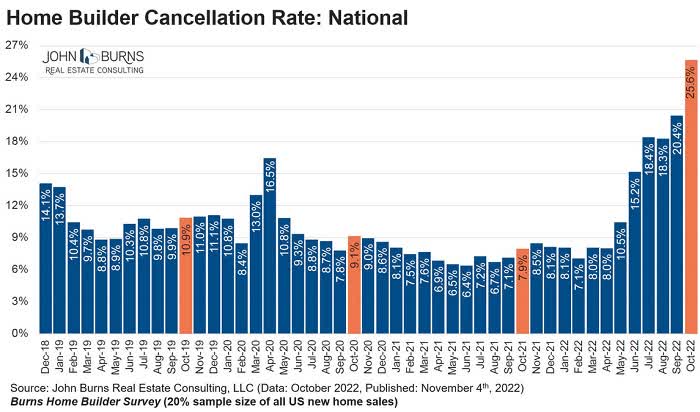
The cancellation rates vary substantially by region: In the Southwest, the cancellation rate spiked to 45%. Nearly half of all contracts signed are then cancelled! This was up from a cancellation rate of 9% a year ago. In Texas, the cancellation rate spiked to 39%, up from 12% a year ago.
This kind of huge spike in cancellation rates renders the sales contract signings data a practically irrelevant figure, because a cancelled contract is no longer an actual sale (chart via Rick Palacios Jr., John Burns):
Homebuilder Cancellation Rate: Regional (John Burns Real Estate Consulting)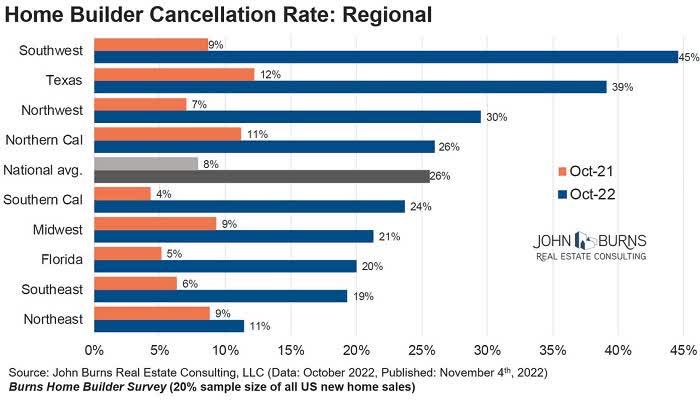
From shortage to glut: Inventories continue to spike
Inventory for sale in all stages of construction jumped to 470,000 houses, up by 21% from the high levels in October last year, the highest since March 2008. Compared to the early phases of Housing Bust 1, it was the highest since September 2005:
New Single-Family Houses For Sale (In Thousands, Seasonally Adjusted) (Author)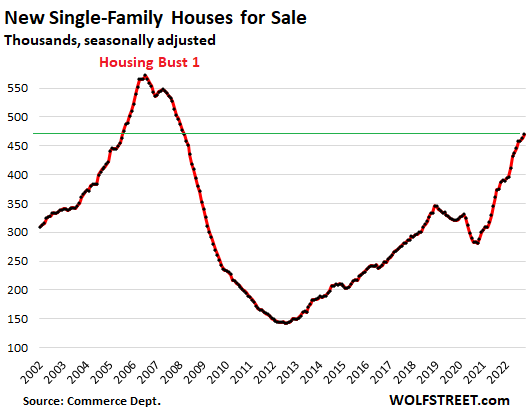
Supply of unsold new houses has been in the 8-10 months range since April, due to the combination of low sales and the surge in inventory. Supply in October was 8.9 months, Housing Bust 1 levels.
Supply is figured as how many months it would take to sell the current inventory at the current rate of sales – but the current rate of sales is based on contract signings, and those contracts are getting canceled at record rates, and the fact that sales keep falling through is fueling the relentless surge in inventory.
Another thing: Inflation – Just when you thought…
Construction costs of single-family houses – excluding the cost of land and other non-construction costs – seemed like they’d peaked in June, and then the spike slowed or stalled, and on a year-over-year basis, the spike backed off from a historic record of 18.3% in June to 16.7% in August. But then it started spiking all over again, and in October, hit a new historic record of 18.4%. This inflation will continue to dish up surprises, just when you least expect it.
Construction Costs Index, % Change From Year Ago (For Single-Family Houses Under Construction) (Author)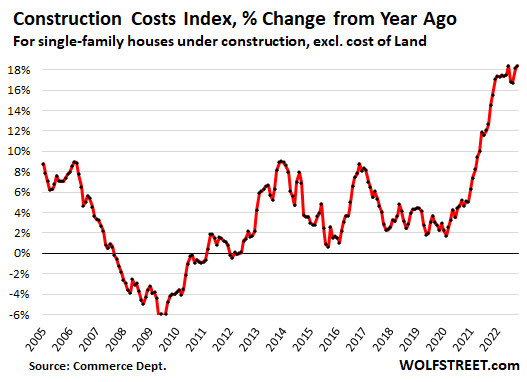
Editor’s Note: The summary bullets for this article were chosen by Seeking Alpha editors.
Be the first to comment