

bjdlzx
Part I – Introduction
Texas-based energy explorer Marathon Oil Corporation (NYSE:MRO) released its third-quarter 2022 results on November 2, 2022.
Note: This article is an update of my article published on September 16, 2022. I have followed MRO on Seeking Alpha since Dec. 2020.
The company owns a multi-basin portfolio. However, MRO is also producing oil from Equatorial Guinea, West Africa.
MRO owns a 63% operated working interest under a production sharing contract in the Alba field and an 80% operated working interest in Block D. Also, MRO owns a 52% interest in Alba Plant LLC, accounted for as an equity method investment, which uses an onshore LPG processing plant located on Bioko Island.
MRO Assets map presentation (MRO Presentation)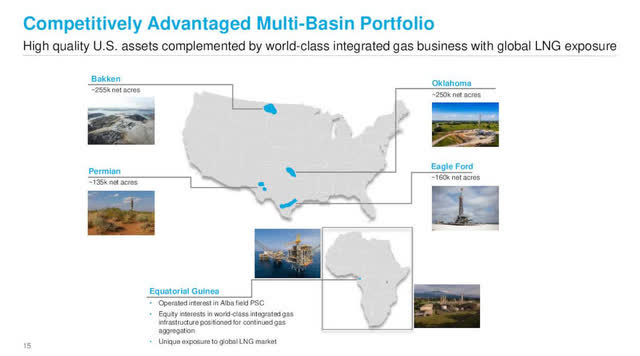
Furthermore, on November 2, 2022, Marathon Oil acquired the Eagle Ford assets of Ensign Natural Resources (a private company) for total cash consideration of $3.0 billion.
The 130,000 net acres (99% operated, 97% working interest) Marathon Oil is acquiring from Ensign Natural Resources span Live Oak, Bee, Karnes, and Dewitt Counties across the condensate, wet gas, and dry gas phase windows of the Eagle Ford. Estimated fourth quarter 2022 oil equivalent production is 67,000 net boed (22,000 net bopd of oil). Marathon Oil believes it can hold fourth quarter production flat with approximately 1 rig and 35 to 40 wells to sales per year.
1 – 3Q22 results snapshot
The company reported a third-quarter 2022 adjusted net income per share of $1.24 or $832 million, which easily beat analysts’ expectations compared to $0.39 per share a year ago.
Marathon Oil’s results were solid due to robust liquid realizations and better-than-expected domestic production of 295K Boep/d. Marathon Oil reported revenues of $2,247 million, well above the year-ago revenues of $1,453 million, beating expectations.
MRO 3Q22 Highlights (MRO Presentation)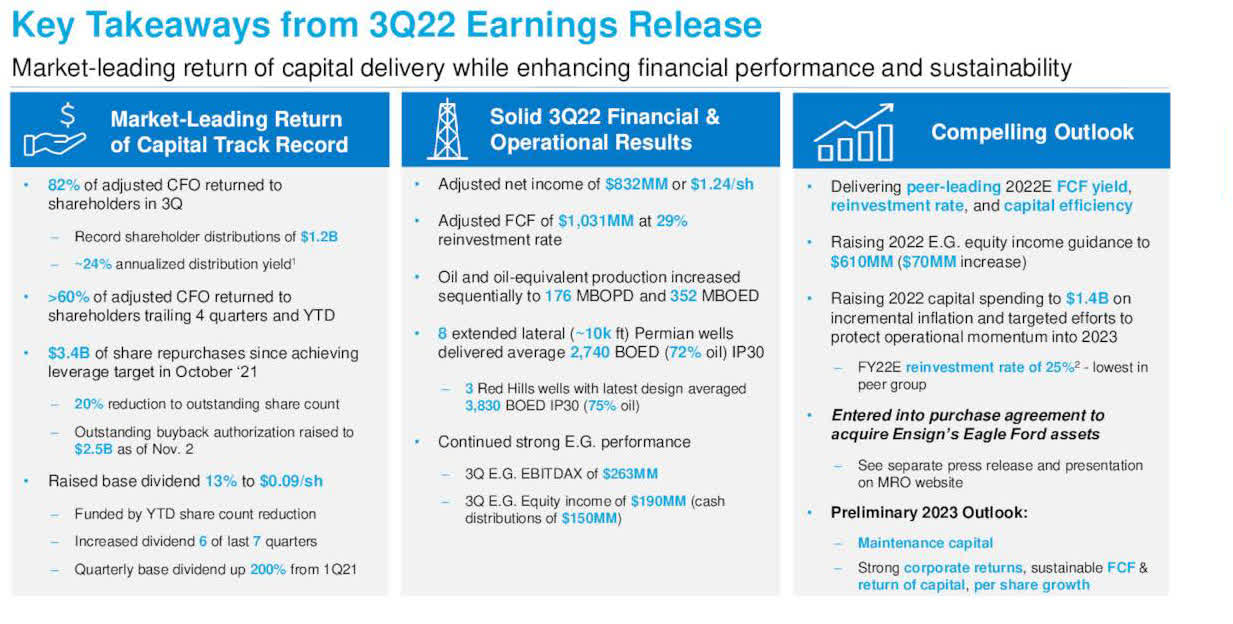
The company uses its excess cash to reward shareholders with dividends and buybacks.
The Board of Directors increased outstanding buyback authorization to $2.5 billion as of Nov. 2 and raised the quarterly base dividend by 13%, or a quarterly dividend of $0.09 per share.
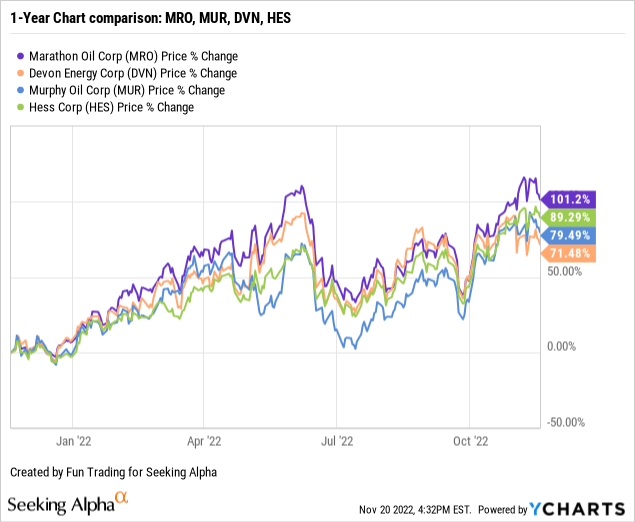
2 – Stock performance
A quick one-year comparison with a few E&P (primarily domestic) shows that MRO has outperformed the group, with an increase of 101% on a one-year basis.
3 – Investment thesis
Marathon Oil is an attractive E&P company and a significant U.S. E&P producer. 83.8% of the total oil equivalent production in Q3 2022 comes from the USA. Thus, it protects shareholders from substantial risks attached to geopolitical turmoil.
Marathon Oil is an excellent stock to own from a long-term investor’s perspective. On the negative side, the quarterly dividend yield is only 1.17%, which pales compared to Marathon’s peers.
The oil market’s high volatility and cyclicity are crucial characteristics of this industry. Oil is subject to unpredictable and recurring swings. High oil prices have contributed to record inflation which may well push the world economy into a severe recession with demand destruction in 2023, which could hurt oil prices.
On the other hand, even though oil and gas prices have pulled back significantly in the past few months due to a growing risk of recession triggered by rampant inflation, I believe the sector will be solid in 2023. On November 9, ING wrote:
Lower than expected supply growth from the US leaves the market more vulnerable over 2023. In addition to ongoing OPEC+ supply cuts, Russian oil supply should fall as the EU ban on Russian crude and refined products comes into effect. Lower US supply growth gives us even more confidence in our view that Brent will average US$110/bbl in 4Q23.
Finally, the risk attached to the international segment (Equatorial Guinea, West Africa) is non-negligible and represents 16.2% of the company’s total output.
Thus, I recommend trading LIFO about 35-40% of your position to take advantage of those fluctuations while keeping a core long-term position. This dual strategy is what I am suggesting in my marketplace, “The Gold and Oil corner.”
CEO Lee Tillman said in the conference call:
in addition to our standard quarterly earnings materials, we are also very excited to discuss our acquisition of Ensign Natural Resources’ Eagle Ford assets, a truly compelling opportunity for our company that furthers each and every one of our core strategic objectives.
Marathon Oil – Financial Table 3Q22 – The Raw Numbers
| Marathon Oil | 3Q21 | 4Q21 | 1Q22 | 2Q22 | 3Q22 |
| Revenues from contracts in $ million | 1,438 | 1,732 | 1,761 | 2,168 | 2,008 |
| Revenues and others in $ Million | 1,453 | 1,800 | 1,753 | 2,303 | 2,247 |
| Net Income in $ Million | 184 | 649 | 1,304 | 966 | 817 |
| EBITDA $ Million | 868 | 937 | 1,244 | 1,608 | 1,333 |
| EPS diluted in $/share | 0.23 | 0.84 | 1.78 | 1.37 | 1.22 |
| Operating cash flow in $ Million | 816 | 1,146 | 1,067 | 1,678 | 1,556 |
| CapEx in $ Million | 289 | 274 | 332 | 355 | 430 |
| Free cash flow in $ Million | 527 | 872 | 735 | 1,323 | 1,126 |
| Total cash $ million | 485 | 580 | 681 | 1,162 | 1,109 |
| Long-Term Debt in $ million | 4,013 | 4,014 | 4,014 | 3,982 | 3,981 |
| Dividend per share in $/share | 0.06 | 0.07 | 0.08 | 0.08 | 0.09 |
| Shares outstanding (diluted) in Million | 789 | 779 | 732 | 705 | 672 |
| Oil Production | 3Q21 | 4Q21 | 1Q22 | 2Q22 | 3Q22 |
| Oil Equivalent Production in K Boe/d | 345 | 353 | 341 | 343 | 352 |
| US Onshore Crude oil price ($/b) | 69.40 | 77.03 | 94.43 | 110.10 | 93.67 |
Sources: Marathon oil release
Part II – Analysis: Revenues, Earnings Details, Free Cash Flow, Debt, and Oil and Gas Production
1 – Total revenues were $2,008 million in 3Q22
MRO Quarterly Revenues history (Fun Trading)
The third quarter’s revenues were $2,247 million, up 54.6% from the same quarter a year ago and down 2.4% sequentially.
Total costs in 3Q22 were $1,143 million, $37 million higher than the prior-year period. Marathon Oil reported an adjusted CFO of $1,440 million for the third quarter, up significantly from $775 million a year ago.
2 – Generic free cash flow was $1,126 million in 3Q22
MRO Quarterly Free cash flow history (Fun Trading)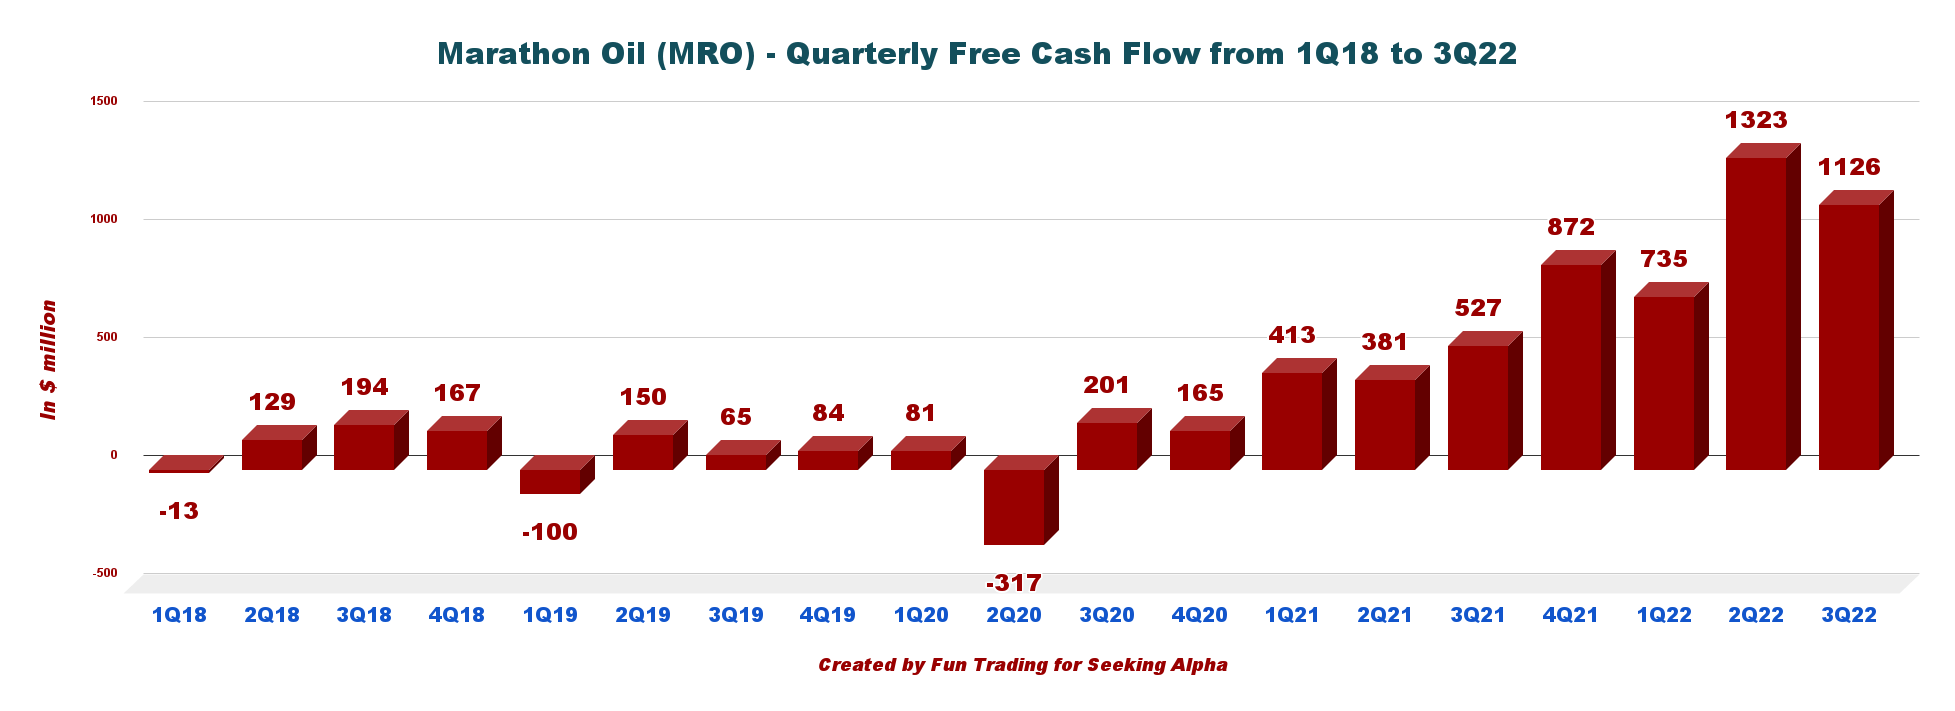
Note: The generic free cash flow is cash from operating activities minus CapEx.
Trailing twelve-month free cash flow was $4,056 million, with a 3Q22 free cash flow of $1,126 million.
This quarter, the quarterly dividend has been increased to $0.09 per share, which means a yearly cash expense of $242 million, easily covered by free cash flow.
Marathon initiated $3.4 billion of share repurchases since achieving the leverage objective in Oct. 2021, reducing the outstanding share count by 20%. In addition, the company executed $760 million of share repurchases this quarter, reducing the diluted share count by 3.7%. Shares outstanding diluted are now 672 million compared to 789 million in 3Q21.
3 – Production of oil equivalent was 352K Boep/d in 3Q22
MRO Quarterly Oil equivalent production history (Fun Trading)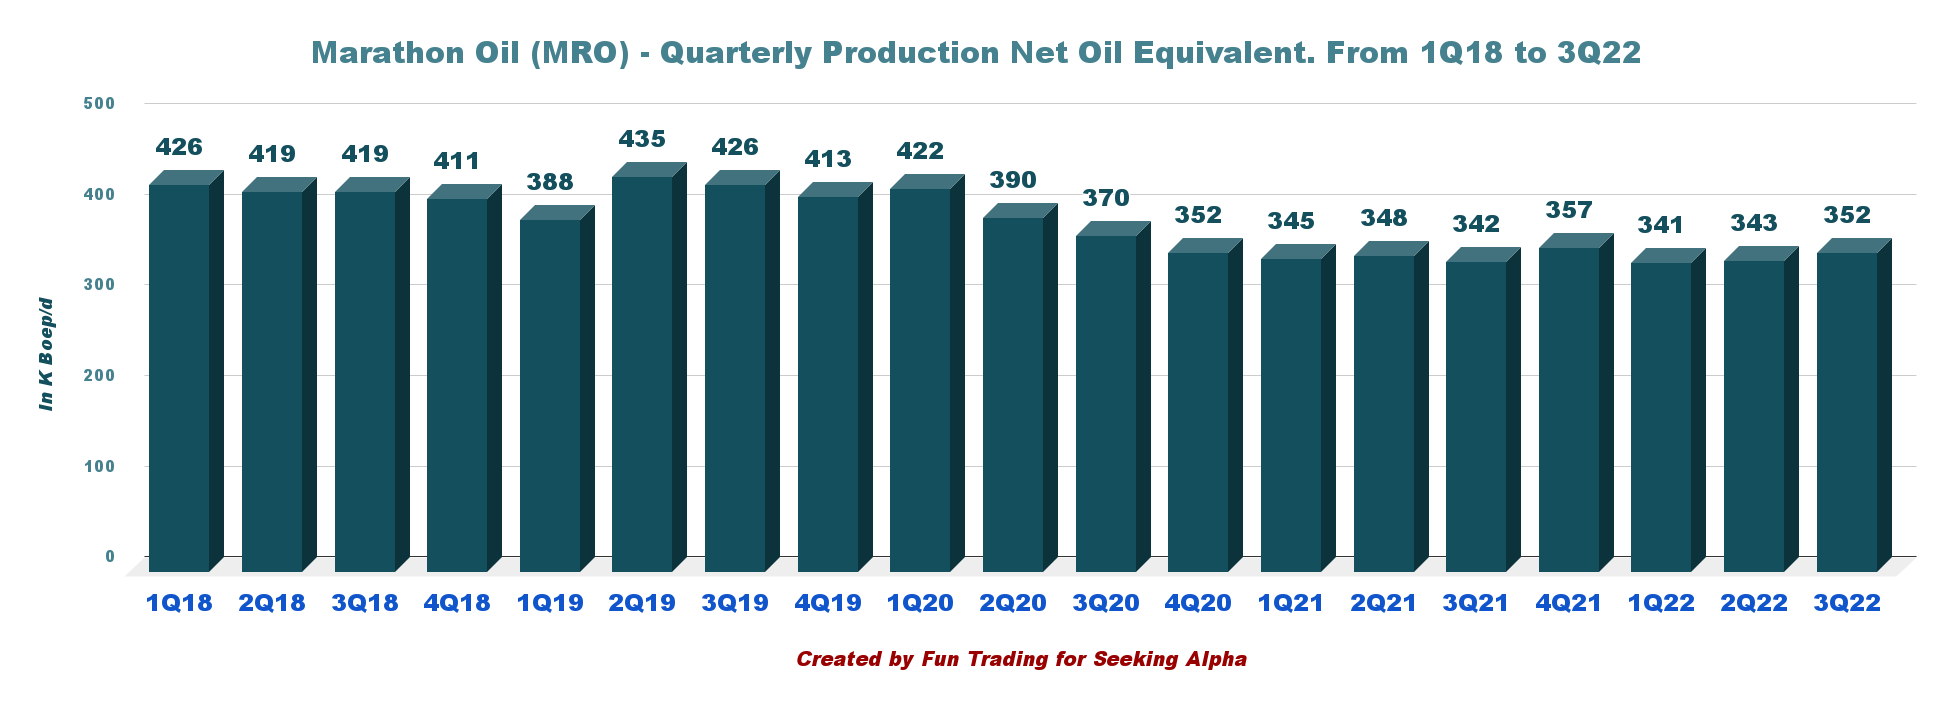
Total net production (from U.S. and International segments) in 3Q22 came in at 352K Boep/d compared to 342K Boep/d in the year-ago period.
3.1 – US segment
This U.S. upstream segment reported an income of $723 million, up significantly from $305 million in the year-ago period due to higher oil and gas prices.
- Marathon Oil’s average realized liquids prices (crude oil and condensate) of $93.67 per barrel were considerably above the year-earlier level of $69.40.
- Average realized natural gas prices jumped 88% year over year to $7.84 per Mcf.
MRO 3Q22 Resources play update (MRO Presentation)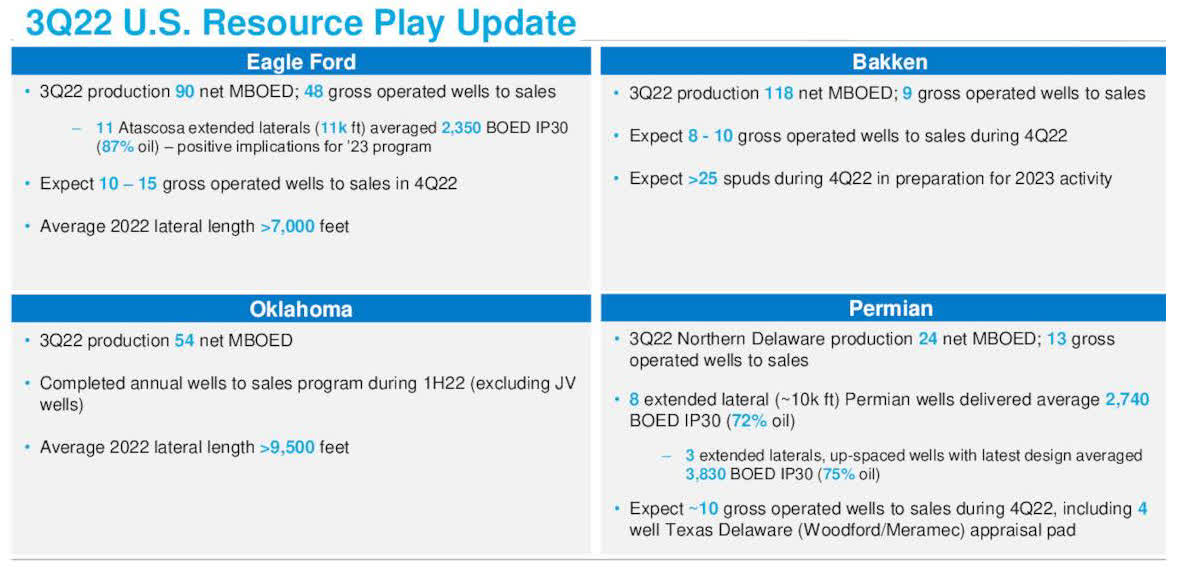
It was a good production quarter for the U.S. segment.
| U.S. Oil equivalent Production K boep/d | 3Q21 | 4Q21 | 1Q22 | 2Q22 | 3Q22 |
| Eagle Ford | 95 | 93 | 80 | 84 | 90 |
| Bakken | 103 | 124 | 118 | 114 | 118 |
| Oklahoma | 55 | 56 | 51 | 56 | 54 |
| Northern Delaware | 21 | 22 | 20 | 20 | 24 |
| Other US | 7 | 9 | 11 | 9 | 9 |
| Equatorial Guinea | 61 | 53 | 61 | 60 | 57 |
Source: Excerpt from Fun Trading file.
MRO Quarterly chart comparison 2Q22 versus 3Q22 (Fun Trading)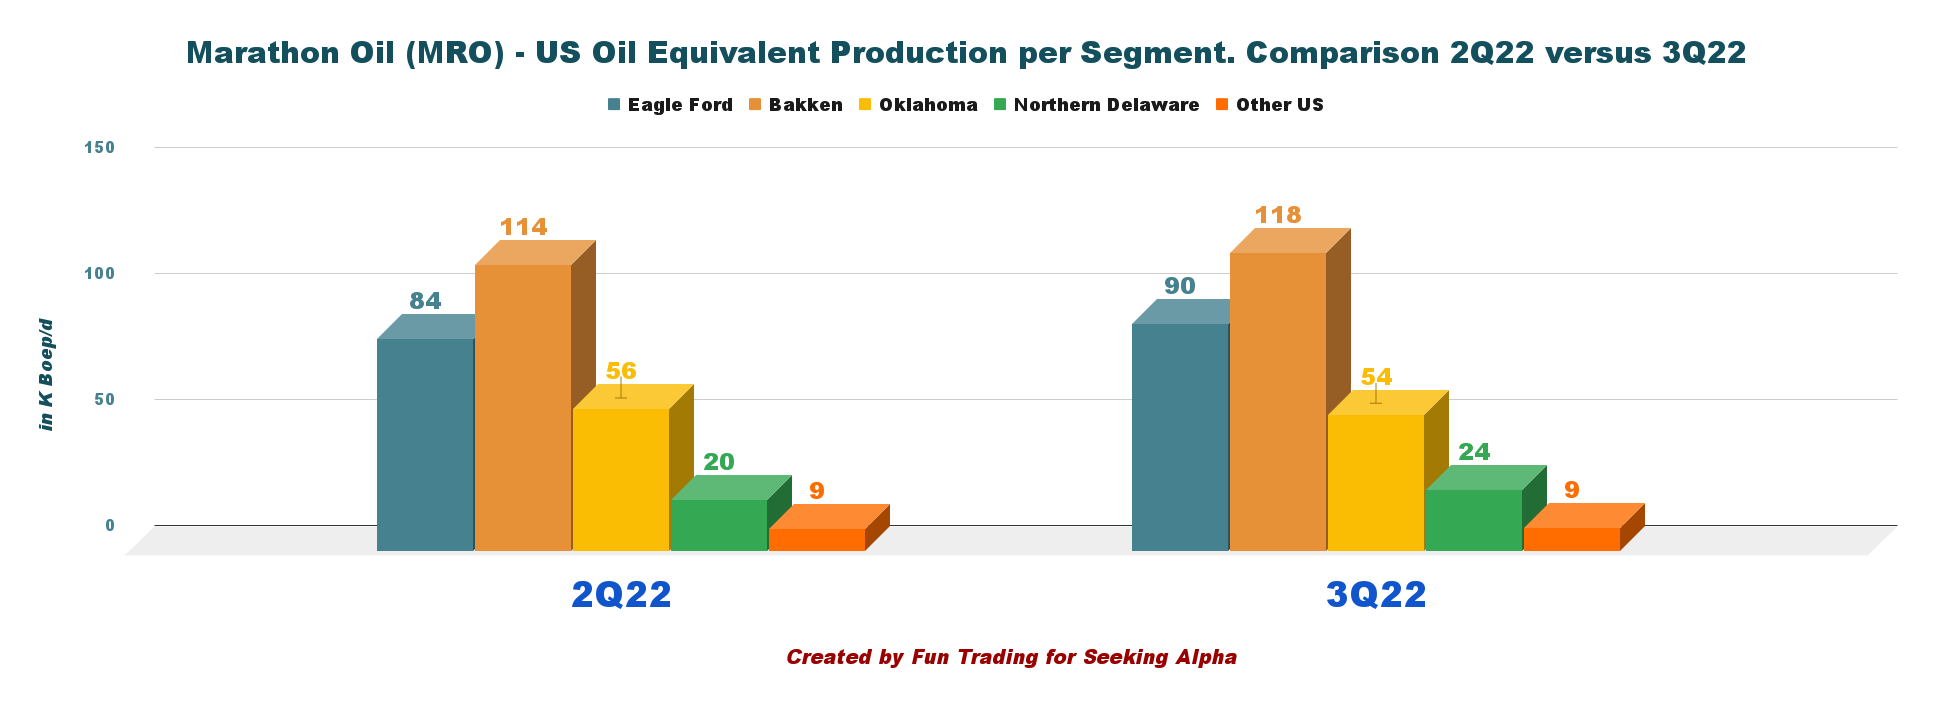
3.2 – The Equatorial Guinea segment
The segment reported earnings of $181 million compared with $93 million in the year-ago period due to improved liquids prices. Production was 57K Boep/d net.
MRO raising annual Equatorial Guinea equity income guidance (MRO Presentation)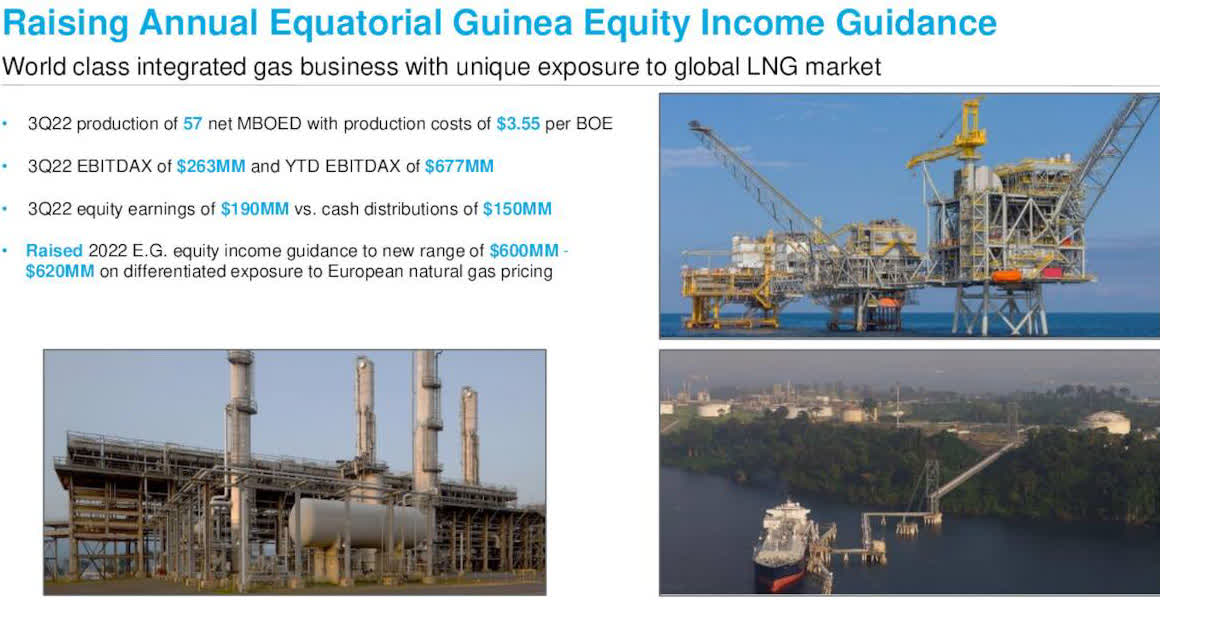
3.3 – Oil and gas prices
Marathon Oil’s average realized liquids prices (crude oil and condensate) of $93.67 per barrel were particularly above the year-earlier level of $69.4.
Natural gas liquids’ average price realization was $34.00 a barrel compared to $30.68 last year.
Also, average realized natural gas prices were up 88% yearly to $7.84 per thousand cubic feet.
MRO Quarterly Oil and Gas prices history (Fun Trading)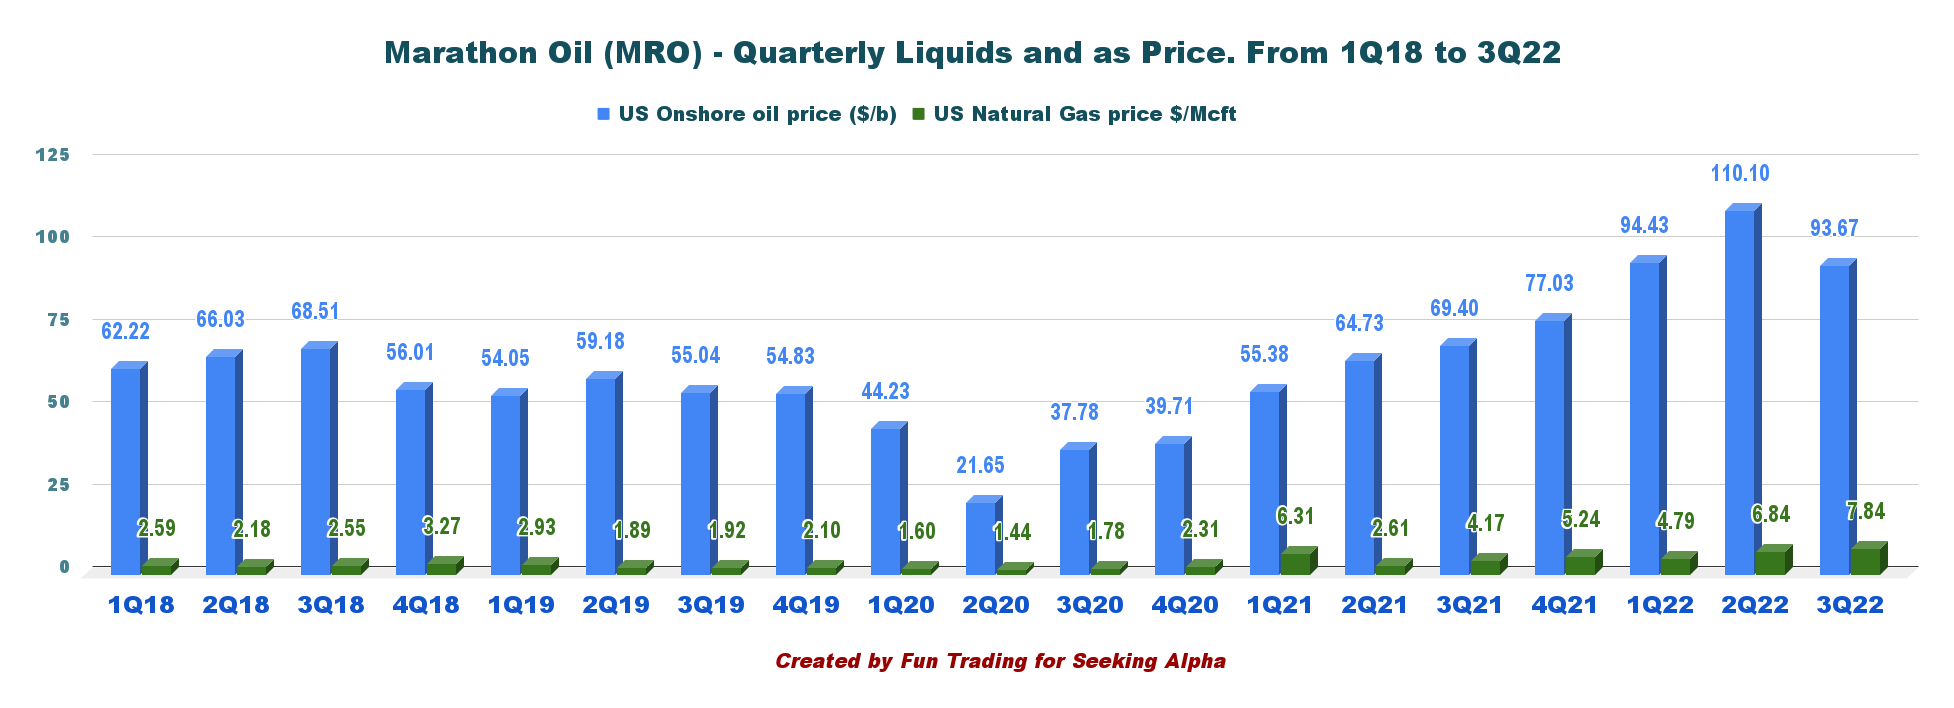
4 – Net debt was $2.87 billion in 3Q22
MRO Quarterly Cash versus Debt history (Fun Trading)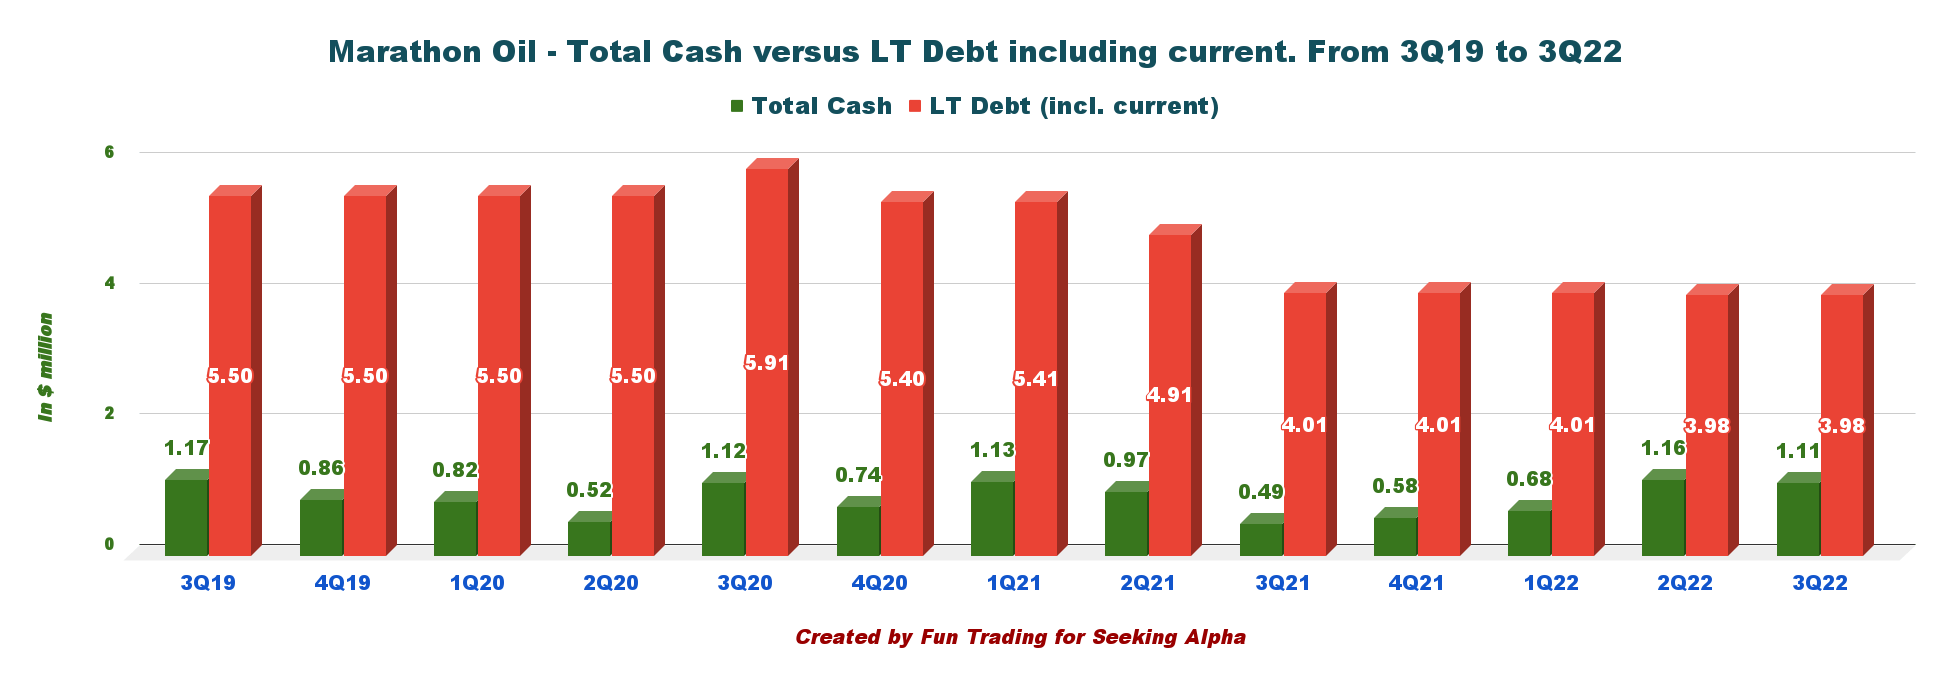
As of September 30, 2022, MRO had cash and cash equivalents worth $1,109 million and long-term Debt of 3.981 billion, including current. Liquidity is now $3.6 billion.
Note: In July, the Company extended its revolving credit facility by three years to 2027 and amended the capacity to $2.5 billion.
5 – Guidance 2022
Marathon increased the CapEx guidance to $1.4 billion for 2022.
MRO is expecting production in the range of 340K Boep/d to 350K Boep/d, unchanged from the last year.
Oil volumes in the band of 168K-176K Bop/d.
MRO Production and capital guidance 2022 (MRO Presentation)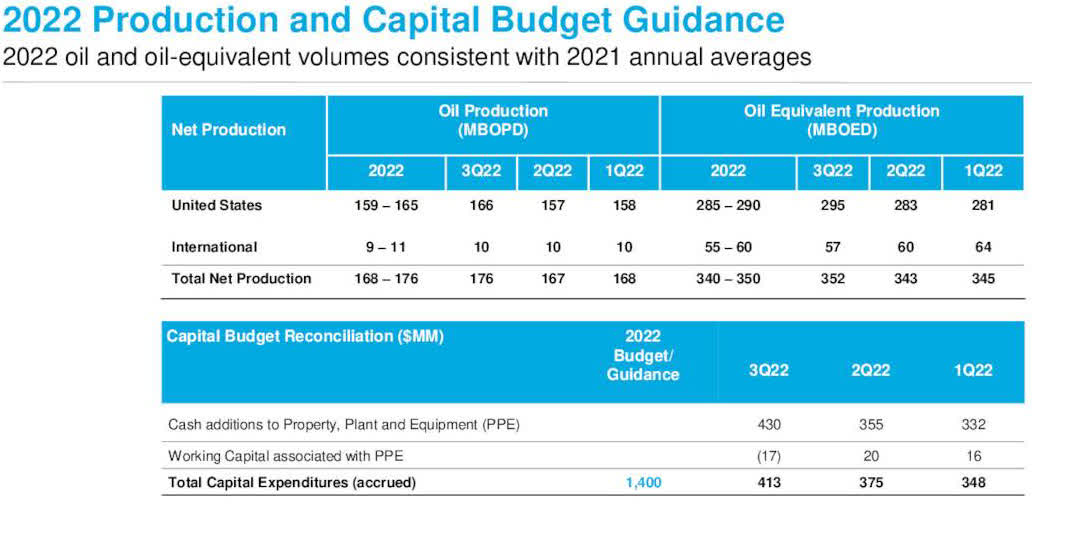
Assuming $60 WTI, Marathon Oil expects to return a minimum of 40% of its cash flow from operations.
Technical Analysis (Short Term) and Commentary
MRO TA Chart short-term (Fun Trading StockCharts)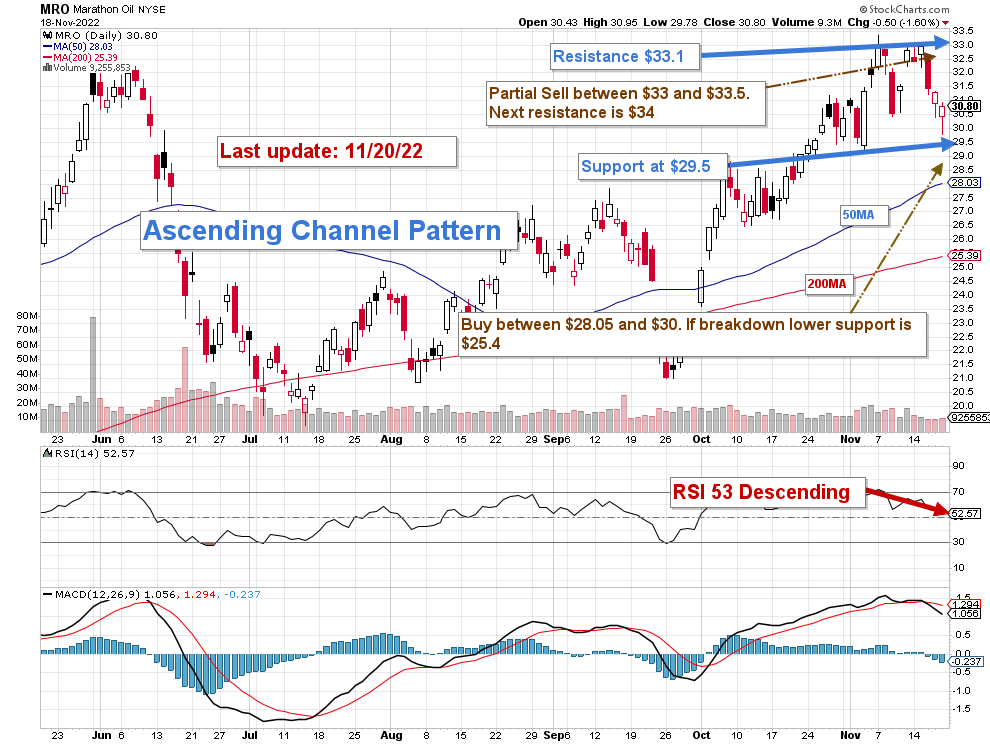
Note: The graph is adjusted for the dividend.
MRO forms an ascending channel pattern with resistance at $33.1 and support at $29.5. Ascending channel patterns are generally short-term bullish, moving higher within an ascending canal. However, these patterns often form within longer-term downtrends as continuation patterns.
The trading strategy is to sell about 40-45% of your position between $33.5 and $33, with possible higher resistance at $34, If oil prices turn bullish.
Conversely, if the oil prices drop lower, MRO may fall between $30 and $28.05, with potential lower support at $25.4 if the oil fall is significant due to elevated recession risk.
Watch oil and gas prices like a hawk.
Warning: The TA chart must be updated frequently to be relevant. It is what I am doing in my stock tracker. The chart above has a possible validity of about a week. Remember, the TA chart is a tool only to help you adopt the right strategy. It is not a way to foresee the future. No one and nothing can.
Author’s note: If you find value in this article and would like to encourage such continued efforts, please click the “Like” button below as a vote of support. Thanks!
Be the first to comment