

canbalci
Investment thesis
While U.S. Bancorp (NYSE:USB) and Citigroup Inc. (NYSE:C) are operating in slightly different segments, they are the 4th and the 5th largest U.S. banks. Both of them are undervalued and have almost the same dividend yields, so investors can ask: should I go for the smaller, one of the best-run main street banks, or the better-valued but business-model changing diversified bank? I believe one of them is better for income investors and the other one is better for long-term value investors.
Main points of USB and C
U.S. Bancorp
U.S. Bancorp is one of the U.S.’ largest regional banks, with more than $600 billion in assets. USB is one of the best-run regional banks, with more than 2200 branches across the Midwest and West regions. The company has been growing gradually over the years, and the management’s recent move is to get exposure to California via the Union Bank acquisition. This will add 1 million customers, and 190,000 small business customers to USB. The closing date of the deal has been extended until the end of the year in mid-September.
The good news is that despite the rising interest environment and slowing economy, loan demand doesn’t look like it’s about to taper off soon. Many small and middle-market companies need to borrow to fund their growth. On the other hand, new home buyers will be in a tough situation, as mortgage rates are at a record high. Due to this, USB expects that the mortgage revenue will decline in the upcoming quarter by 30-35%. This is not the bank’s primary income source, so overall I still expect revenue growth. What investors should keep an eye on is the deposit situation. Deposits rose just 1% QoQ at the end of the second quarter.
Citigroup
Citigroup is a diversified financial services bank. It provides various financial products and services to consumers, corporations, governments, and institutions all around the world (however, this has been changing since the new CEO in 2020). Before its new CEO, the bank delivered mediocre ROE figures due to its fragmented business. It was not effective due to competing in too many markets, in too many segments. In addition, this situation increased the capital requirements for Citi. The new CEO has started to shift the business model, but the rebranding is not without challenges. However, by the end of this business model shift, the bank will be more effective, it will require less capital, and can focus on its core strengths. This is one of the reasons why Warren Buffett bought Citigroup earlier this year.
Citigroup makes most of its revenue from its Institutional Clients Group segment (approximately 70%), and that is why it is selling almost all of its consumer branches. The good news is that during the rising interest rate environment the bank should flourish. The management expects that a 100 basis points parallel shift in rates, and cross-currencies, would increase the bank’s NII by $2.5 billion. The risks investors have to take into consideration is that investment banking revenue has already plummeted due to the bear market, and if the unemployment rates rise by 100-150 basis points, the bank might need to absorb additional uncalculated loan losses.
Underlying business and valuation comparison
In terms of common equity tier 1 capital ratio, U.S. banks must maintain a minimum capital ratio of 8%, of which 6% must be Tier 1 capital. Both USB and C are well capitalized at the moment, C has a CET1 ratio of approximately 13% while USB has a ratio of approximately 11.5%. So, in a financial distress, C is better capitalized. (This is a huge difference from Citi’s 2008 ratio of just slightly above 2%.) Citi also wins in the race in current valuation. C has a P/B ratio of 0.47x and it is not only undervalued compared to almost all of its peers but to its 5-year average as well. Citi’s 5-year P/B average is 0.78x so at the moment it is trading almost 40% below its average. USB has also been affected by 2022’s bear market and its P/B ratio fell but not as significantly as Citi’s. USB has a P/B ratio of 1.46x and its 5-year average is only 13.5% higher than its current figure (5-year average: 1.74x).
Seeking Alpha
If we compare the revenue growth of the 2 banks, we can see a significant difference. Citigroup has shown extensive EPS growth, but that was mainly due to its share buyback program. The average shares outstanding shrunk by approximately 14% during the last 3 years. We also saw some revenue setbacks, and Citi’s revenue growth is more volatile than USB’s. USB only reduced its shares outstanding by 7% during the last 3 years, and except for 2020 investors could count on slow and steady revenue growth every year. I expect moderate revenue growth for both banks over the next year due to the faster growth of NII compared to the interest expenses.
The chart is created by the author. All the figures are from the company’s financial statements.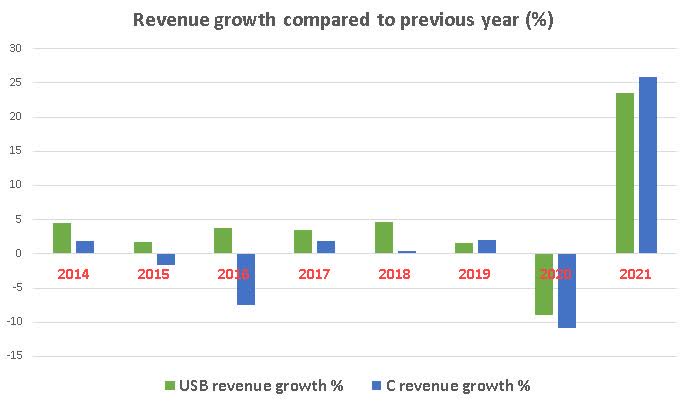
Comparing the 2 banks’ interest efficiency ratios (interest expense/total interest income), investors can see USB has an interest efficiency ratio of 10.2% while C has a ratio of 23.45%. So not only does USB have a more stable revenue growth, but also has a better interest efficiency ratio. However, if we take into consideration the “classic” efficiency ratio, Citigroup has a lead due to its wider business segments. The interest income yield skyrocketed for both institutions by the end of the second quarter of 2022 and during the third quarter, I expect further increases due to the current hawkish fed policy. The average interest income yield among all U.S. banks was 2.77% in Q2 2022 a major increase from 2.47% in Q1 2022. Citigroup has an interest income yield of 2.97% and USB has a yield of 2.66%. The ROA for both institutions is slightly better than the U.S. banks’ average of 1.08 in the second quarter (USB and C had a ROA of 1.1).
bankregdata.com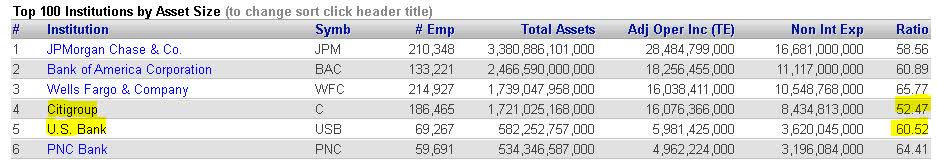
In terms of market projections and credit projections, they behave similarly because USB and C started to increase the provision for loan losses. USB tripled its figure in Q2 compared to Q1 and C more than quadrupled this figure. It means that after a great 2021, when both banks reduced their “cash reserves” for problematic loans that can go bust, 2022 changed significantly. They are building up large “cash cushions” for the upcoming economic slowdown. This information does not directly help investors decide which bank to buy but it gives a clear signal that both of them are preparing for what is coming and that the shareholders’ equity is protected.
Dividend comparison
U.S. Bancorp
USB has been a steady dividend payer for 19 years and has an 11-year consecutive dividend growth history. Since the 2008 financial crisis, the bank had a dividend growth rate of over 10% per year but the forward estimates calculate with more moderate growth for the upcoming years (3-5% per year). U.S. Bancorp raised its dividend by 4.3% to $0.48 for the third quarter. I expect that they will increase their dividend for the 12th consecutive year in 2023 to $0.495-$0.505 per share. The bank also has a healthy payout ratio, and it will remain under 50% even after the Union Bank acquisition.
In 2022, the management did not comment on dividends in their earnings call (in addition no questions mentioned dividends), which suggests to me that they do not have any intention to change the current dividend policy.
The table is created by the author. All figures are from the company’s financial statements and SA Earnings Estimates.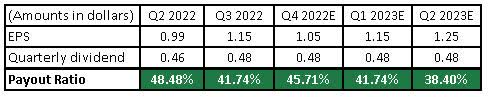
Citigroup
C has been paying dividends for 10 years (they had to suspend their dividends due to the 2008 crisis until 2011). Since then, the management has been paying dividends consecutively. However, the increase of the dividend is more like an ad hoc method than a carefully planned execution. They have not changed the $0.51 per share dividend since 2019, and according to the management, investors cannot calculate any increases soon.
The management assured investors in both the first and second quarterly conference calls that they intend to be a stable dividend-payer institution despite high capital expenditures. But, as their CFO said: “And so we will likely continue to lean that way (share buybacks) as opposed to doing a lot to change the dividend.” – Mark Mason CFO The share repurchases might slow down in the last part of the year compared to what we saw earlier, but still I expect no dividend increases, surely not until the rebranding finishes.
The table is created by the author. All figures are from the company’s financial statements and SA Earnings Estimates.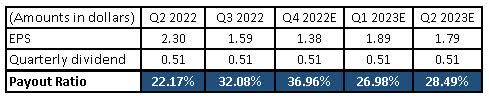
From an income investor’s point of view, USB is a better choice at the moment because in a high-inflation environment it is fair to expect yearly dividend increases. Citi will not be able to give that advantage, and looking back to the financial crisis of 2008 when Citigroup stopped paying dividends for more than 2 years, U.S. Bancorp kept up (reduced) payments to investors. So even in a drastic economic downturn, I believe that USB is a safer choice from a dividend perspective.
Conclusion
I believe both banks have their place in a portfolio. C is ideal for longer-term value investors, and USB could be ideal for income investors. But luckily the line is not so strict between the two banks. Citi could be bought for income purposes, and USB can be bought for value purposes as well. Both of them appear to be undervalued, and Citi has a better valuation at the moment. While there are some risks on the horizon, such as lower mortgage revenue, a slowing economy, the Union Bank acquisition for USB, and rebranding for C, the overall trend is in their favor. This is why I see the current pricing of both as a solid value opportunity for long-term value and income investors.
Be the first to comment