

Anna Bliokh
While the stock price of oil and gas companies increased significantly in 2022 as a result of hiked oil and gas prices mainly due to the war in Ukraine, Magellan Midstream Partners’ (NYSE:MMP) stock price increased just by 10% since the beginning of the year. The company’s 3Q 2022 financial results were significantly better than in the same period last year. However, its leverage ratios show that MMP’s financial health deteriorated in 2022. With high oil prices, the company will be able to improve its leverage ratios in the following quarters. However, it is important to know that with the current market condition, MMP’s 4Q 2022 and 1Q 2023 financial results will not be as strong as in the past two quarters. The stock is a hold.
3Q 2022 highlights
In its 3Q 2022 financial results, MMP reported total revenues of $876 million, compared with 3Q 2021 total revenues of $639 million, driven by increased product sales and transportation and terminals revenue. The company’s total costs and expenses increased from $400 million in 3Q 2021 to $523 million in 3Q 2022, driven by hiked cost of product sales. MMP’s operating profit increased from $278 million in 3Q 2021 to $396 million in 3Q 2022. MMP reported a net income of $330 million, or $1.59 per common unit (diluted) in 3Q 2022, compared with a 3Q 2021 net income of $237 million, or $1.08 per common unit (diluted).
In the third quarter of 2022, MPP’s transportation revenue per barrel shipped in the refined products segment increased by 9% YoY to $1.873. MMP’s total volume shipped in the refined products segment in 3Q 2022 was 141.3 million barrels (compared with 141.8 million barrels in 3Q 2021). MMP’s transportation revenue per barrel shipped in the crude oil segment decreased from $0.803 in 3Q 2021 to $0.519 in 3Q 2022. The company’s volume shipped in the crude oil segment increased from 49.2 million barrels in 3Q 2011 to 61.2 million barrels in 3Q 2022, up 24% YoY.
In 3Q 2022, in the refined products segment, MMP’s transportation and terminals revenue increased by 6% YoY to $370 million, and its product sales revenue increased by 106% YoY to $318 million. In 3Q 2022, in the crude oil segment, MMP’s transportation and terminals revenue decreased by 3% YoY to $114 million, and its product sales revenue increased by 367% YoY to $70 million. “Based on our performance to date and outlook for the remainder of the year, we are increasing our annual guidance for 2022, reinforcing the resiliency of our business model and importance of the energy services we provide,” said Aaron Milford, chief executive officer. “We remain focused on maximizing long-term investor value, demonstrated by more than $375 million of equity buybacks so far this year, coupled with the latest increase in our quarterly cash distribution and recently-launched capital project to generate a low-risk, attractive return on the expansion of our West Texas refined products pipeline capabilities,” he continued.
The market outlook
According to Figure 1, during this winter (October 2022 to March 2023), the U.S. average consumer price and expenditures for heating oil are expected to increase by 26.6% YoY to $2354, driven by higher consumption and increased prices. The U.S. average consumer consumption of 518.8 gallons during the winter of 2022-2023, is significantly higher than in the last few winters.
Figure 1 – U.S. average consumer expenditures for heating oil
eia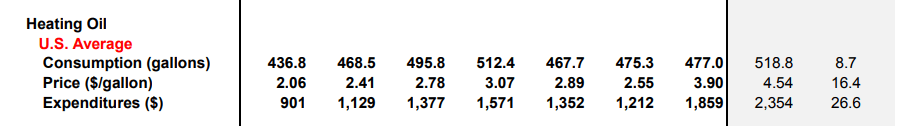
Figure 2 shows that Brent crude oil price increased from $73.45/b in 2Q 2021 to $113.84 per barrel in 2Q 2022 (due to the war in Ukraine and increasing demand for crude oil). However, due to the economic recession and increased interest rates to combat inflation, combined with China’s new COVID- 19 restrictions, it decreased to $100.53/b in 3Q 2022 and EIA expects Brent crude oil price to be $92.98/b in 4Q 2022 and $93.30/b in 1Q 2023. In the past two weeks, Brent crude oil price increased to $98 per barrel due to the news about China easing COVID-19 restrictions (see Figure 3). However, China dashed hopes there would be a relaxation of the COVID-19 restrictions. Thus, for now, China’s oil demand is not expected to increase and won’t have a positive effect on oil prices. However, the OPEC+ production cut of 2 mb/d (which is the largest cut since the pandemic started) and the European Union ban on Russian crude that will come into effect in December 2022, combined with continuing Iranian oil sanctions, support oil prices.
Figure 2 – Energy prices
eia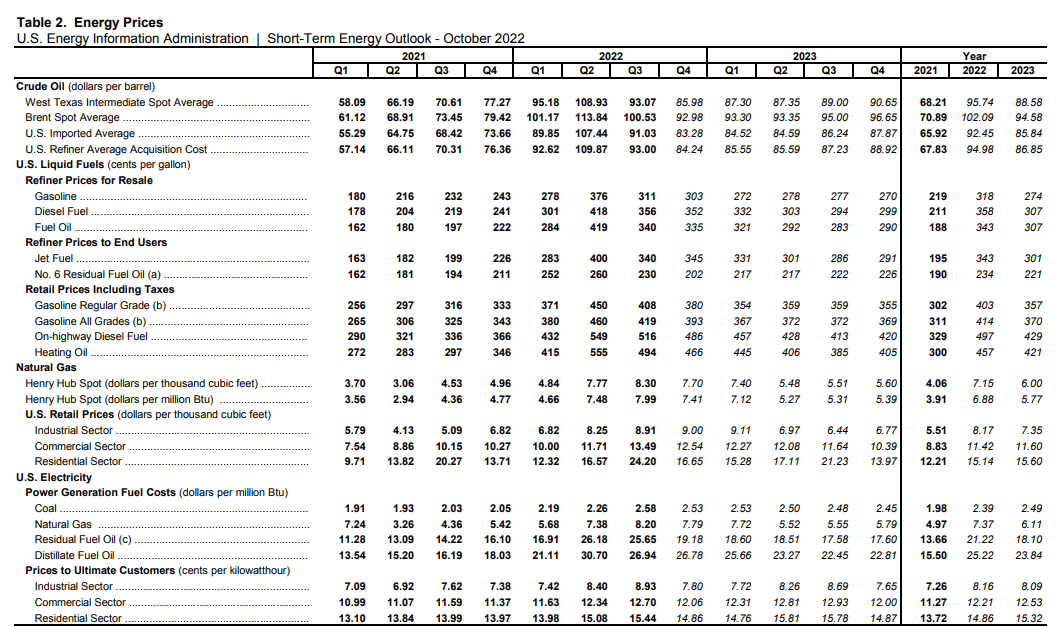
Figure 3 – Brent crude oil price
tradingeconomics.com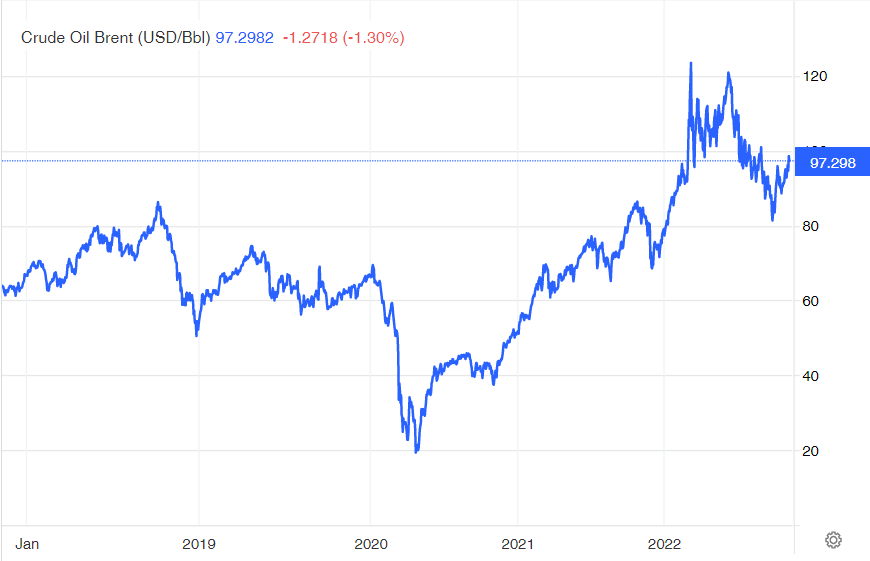
Moreover, Figure 2 shows that U.S. gasoline, diesel fuel, and fuel oil in during this winter will be higher than last winter; however, lower than in 2Q 2022. According to Figure 4, U.S. petroleum and other liquids supply and consumption in 4Q 2022 and 1Q 2023, will be higher than in 3Q 2022. EIA expects U.S. retail gasoline average $3.80 per gallon in 4Q22 and $3.57/gal in 2023. Moreover, EIA expects U.S. motor gasoline and consumption in 4Q 2022 to be as equal as in 3Q 2022; however, it will decrease in 1Q 2023. U.S distillate fuel oil consumption in 4Q 2022 will be higher than in 3Q 2022 and increase further in the first quarter of 2023.
Based on the oil prices and U.S. petroleum and other liquids supply and consumption levels from October 2022 to March 2023, I expect MMP’s 4Q 2022 and 1Q 2023 financial results to be attractive. However, it is important to know that with the current market outlook, MMP’s upcoming financial results will not be as strong as in 3Q 2022 and 2Q 2022.
Figure 4 – U.S. petroleum and other liquids supply and consumption
eia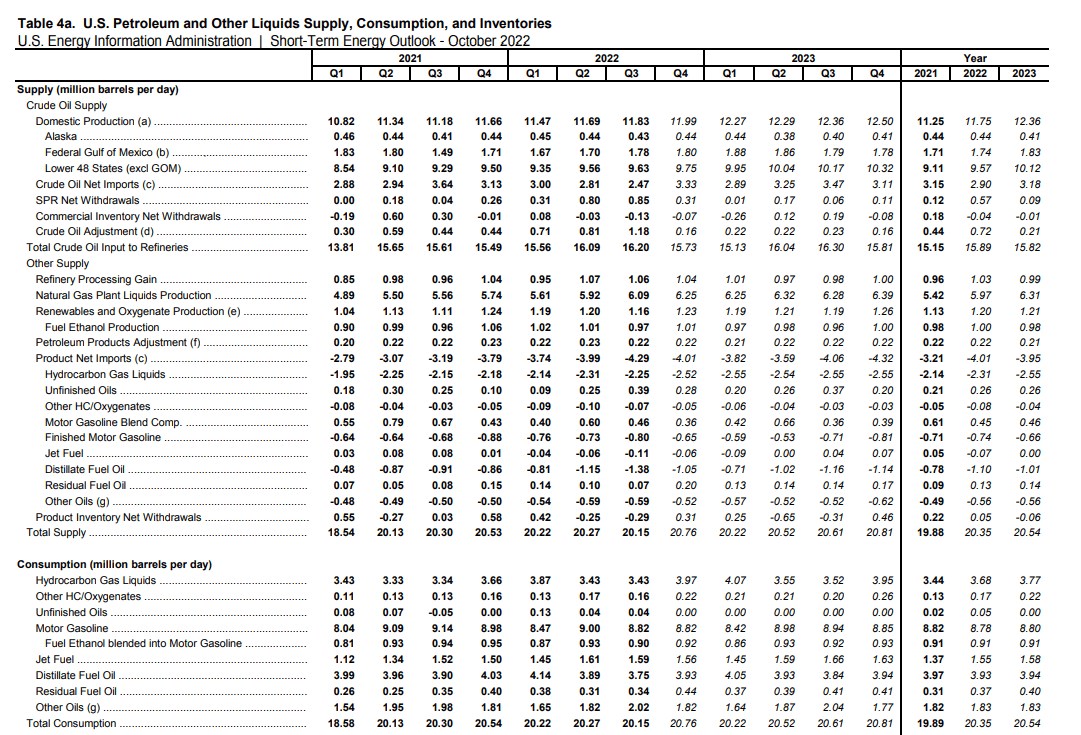
Performance outlook
In this detailed analysis, I used some common leverage ratios that have significant comparability to its debt. The proportions are calculated in comparison with previous years to be more helpful.
The debt-to-assets ratio is one of the significant calculations that measure the company’s debt capacity. This ratio indicates the proportion of assets that are being financed with debt. The higher the ratio, the greater the degree of leverage and financial risks. MMP’s debt-to-asset ratio increased in the past years. The company’s debt-to-asset ratio of 0.66 at the end of 2021 didn’t change in the first nine months of 2022. Moreover, MMP’s debt-to-EBITDA ratio, which determines the probability of defaulting on debt, decreased from 4.49 at the end of 2021 to 4.19 at the end of the third quarter of 2022. The company’s debt-to-EBITDA as of 30 September 2022 is higher than its pre-pandemic levels. Finally, MMP’s asset-to-equity ratio increased from 4.23 at the end of 2021 to 4.46 on 30 September 2022. The increasing assets-to-equity ratio during the past years indicates that the company has used debt increasingly to finance its assets. As a result, the leverage ratios of Cenovus Energy show that MMP’s financial risks are getting bigger and with low oil prices, the company may not be able to cover its obligations easily (see Figure 5).
Figure 5 – MMP’s leverage ratios
Author (based on SA data)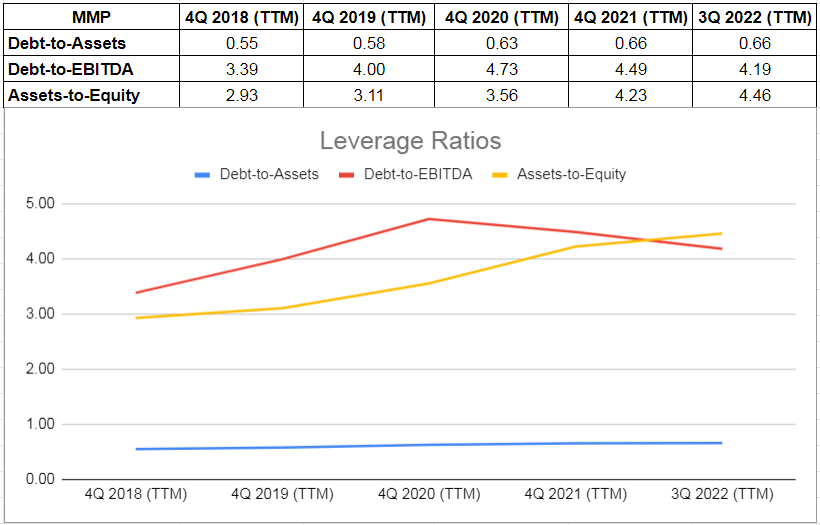
Summary
In terms of the market condition, due to the continuing war in Ukraine, OPEC+ production cut, colder temperatures in the following months, and Iranian oil sanctions, oil prices will be high in 4Q 2022. However, the company’s financial result in the fourth quarter of 2022 will not be as strong as in 2Q 2022 and 3Q 2022. In terms of financial health, MMP’s leverage ratios suggest that the company may face problems if oil prices drop. The stock is a hold.
Be the first to comment