

triloks
2022 U.S. Review
2022 was a mixed year. Most significantly, it was the worst down year for the S&P 500 since 2008. But we ended the year with strong fourth quarter performance and outperformed the S&P 500 for the second year in a row.
Compared to our style benchmark of the S&P 500 Value, we lagged by a wide margin. Most of that underperformance occurred during the first part of the year, and the headwinds we faced relative to that index abated in the fourth quarter. Moreover, we still remain well ahead of that benchmark over the last three years due to our significantly better performance through COVID.
We always enter each new year believing we have assembled the best portfolio we could from the opportunity set available to us. As fundamental value investors, this typically means trying to get the best earnings and growth for the lowest price. From a valuation perspective, after last year’s decline, our P/E ratio is near the low-end of our historical range, both on an absolute and relative basis, and this has historically been a harbinger of higher-than-normal forward returns. Furthermore, from an earnings perspective, our portfolio continues to have the best long-term growth profile in our firm’s history. Given this setup, our return expectations are higher than normal as we enter 2023.
Another Year Ahead of The S&p 500
Our long-term performance history, presented in the graph below, can be simplified into three periods.
The first period is Lyrical’s initial nine years from 2009 to 2017, when we outperformed the S&P 500 for most of those years, and cumulatively outperformed by 185 percentage points. While it was a bad period for the large cap value indices like the S&P 500 Value, it was a good time for value stocks, and an even better one for the value stocks we owned.
Growth of $1,000 since 1/1/2009 (ITD)
Source: FactSet.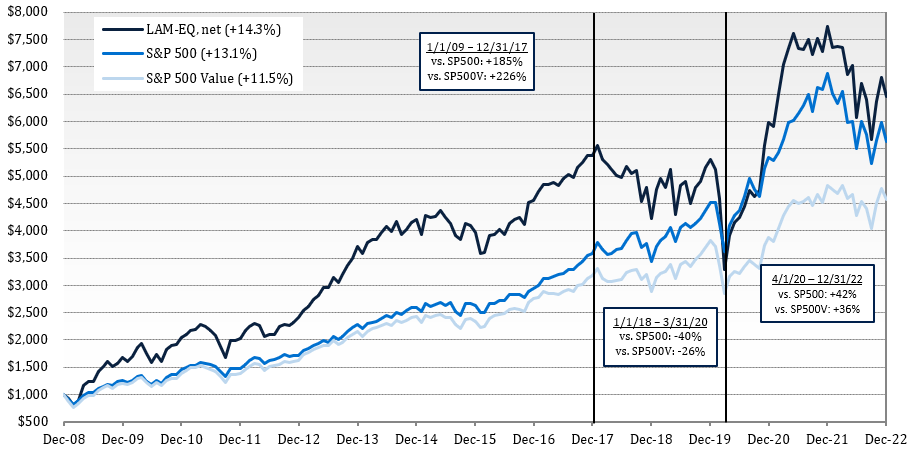
| Note, Lyrical exercised discretion in determining when each cycle began and ended. |
The second period began in 2018, when, like the flip of a switch, value stocks began to underperform broadly and persistently. This lasted for about 20 months, before it looked like the downcycle for value stocks was over in late 2019. But, when the market crashed with COVID in early 2020, value stocks experienced another leg down of underperformance. The COVID sell-off bottomed in March 2020, and over that trailing 27-month period we underperformed the S&P 500 by 40 percentage points.
The third period began after March 2020 and continues today. Like all value downcycles to date, the last downcycle ended, and since then we have outperformed in the last nine months of 2020, and the calendar years of 2021 and 2022. Our cumulative outperformance in this upcycle is 42 percentage points so far, and we believe there is much more to come in the years ahead.
But a Difficult Year Relative to The S&p 500 Value
Although we lagged our style benchmark of the S&P 500 Value by a wide margin in 2022, our long-term (and last three-year) history relative to that benchmark is even better than our record against the S&P 500.
Before we dive into our 2022 relative performance, let’s take a longer-term look at how the S&P 500 Value has performed, compared to the S&P 500. On the graph below we present the annual return of the S&P 500 Value relative to the S&P 500, going back to the year 2000. The tech bubble burst in March 2000 and the value index had an amazing year, outperforming by over 15 percentage points. Over the next six years, the value index continued to outperform, and over the full seven-year period, the value index cumulative return was 44.5% compared to just 8.1% for the S&P 500, an outperformance margin of 36.4 percentage points.
In 2007 the good run for the S&P 500 Value ended, and for the next 15 years it underperformed almost every single year. Over that period, the S&P 500 Value still appreciated 199.5%, but it lagged the 356.8% return of the S&P 500 by a whopping 157.3 percentage points.
Now, finally, in 2022 the S&P 500 Value had its best year of relative performance since the tech bubble ended in 2000, outperforming by 12.9 percentage points.
S&P 500 Value Returns Relative to S&P 500
Source: FactSet.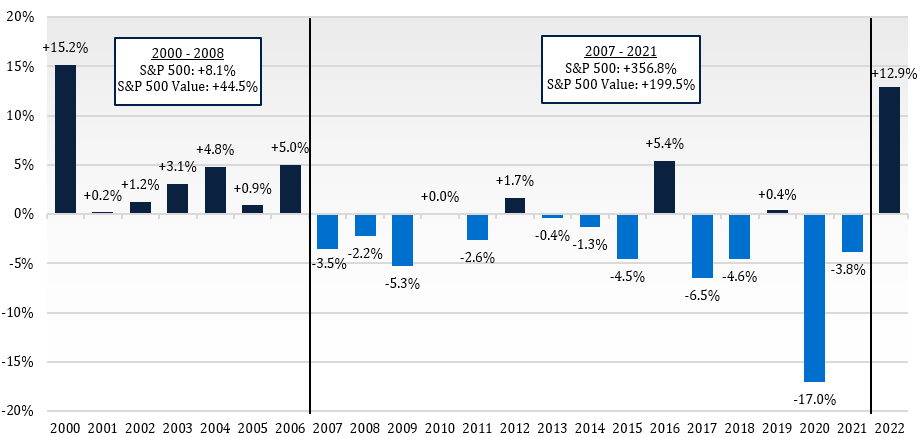
Lyrical’s returns have not always been in sync with those of the S&P 500 Value Index. Given the horrible long-term performance of the S&P 500 Value, we see this is as a very good thing. As we wrote above, during Lyrical’s first nine years from 2009 to 2017, it was a bad period for the S&P 500 Value. While we cumulatively outperformed the S&P 500 by 185 percentage points over these years, we outperformed the S&P 500 Value by 226 percentage points, 51 percentage points more.
We were able to outperform in this “bad” period for value because it was “bad” for the value indices, but not bad for value stocks. As we have discussed in prior letters, we have ample reason to assert that the S&P 500 Value index is a poor proxy for investing in value stocks (i.e. the cheapest stocks). In fact, cheap stocks did very well from 2009 to 2017, and so did Lyrical.
Cheap stocks entered a downcycle in 2018 that lasted 27 months until the COVID sell-off ending in March 2020. During the downcycle, our deeper value approach was more impacted than the S&P 500 Value, and we underperformed by 26 percentage points. Again, we assert that the S&P 500 Value index is a poor proxy for value investing. When value investing is in an upcycle, like the nine years from 2009 through 2017, it does not do as well. But the flip side is that in a downcycle, like the 27 months from 2018 to March 2020, it does less poorly.
Since March 2020, value stocks appear to be in an upcycle again, and we have outperformed again by 36 percentage points, even including our underperformance in 2022.
Sector Not Style in 2022
Prior to 2022, the only time in our history when we significantly lagged the S&P 500 Value was during the 27-month value downcycle from 2018 to March 2020. As we wrote above, this underperformance was driven by the disconnect between the S&P 500 Value index and value stocks. Value stocks outperform the value index over time, but when they are out of favor, they can underperform.
We believe our underperformance relative to the S&P 500 Value in 2022 was driven by something else entirely, namely sector factors not value factors. To illustrate this point, let’s first look at sector mix and performance for the S&P 500 and S&P 500 Value. On the graph below we present the sector performance for the S&P 500 and the S&P 500 Value with the bars, and the difference between the two with the dots. This graph is for 2015, a year when sector was not much of a factor. In that year there were significant differences in sector returns for seven sectors. This is what it looks like when style, not sector, drives performance.
Total Return by Sector (2015)
Source: FactSet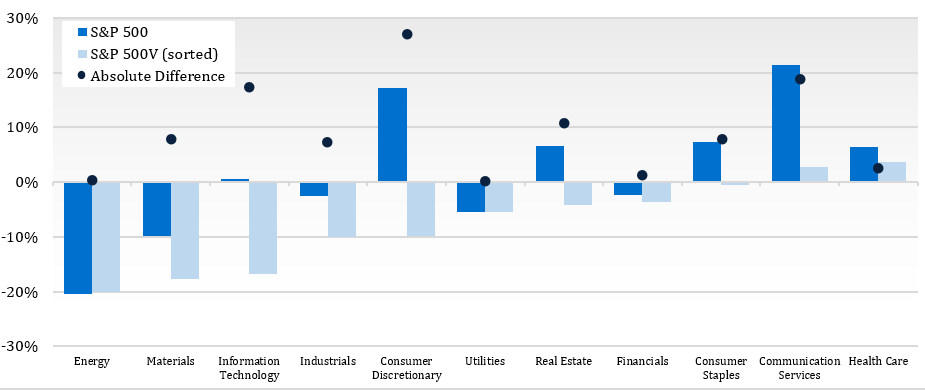
Now look at the chart below. This chart only covers the first nine months of 2022, as the story of “sector not style” went away in the fourth quarter, as did most of our underperformance.
If style was the key driver, we would expect big differences in the returns between the S&P 500 Value and the S&P 500 for many sectors, like what we observed in 2015. That is not what we see, though. For the first nine months of 2022, when essentially all our underperformance versus the S&P 500 Value occurred, the return for the S&P 500 Value was about the same as the return for the S&P 500 for almost every sector.
One notable exception where the returns were different was in the Communication Services sector, with almost 10 percentage points separating the two indices. For the S&P 500, this sector includes mega-caps Alphabet, Meta, and Netflix which, combined, make up 62% of this sector but are not in the S&P 500 Value. Through the first nine months, these stocks were down 34%, 60%, and 61%, respectively. If you remove them, as we have done in the fourth set of bars on the left, almost all the performance difference disappears.
Total Return by Sector (1/1/22 –9/30/22)
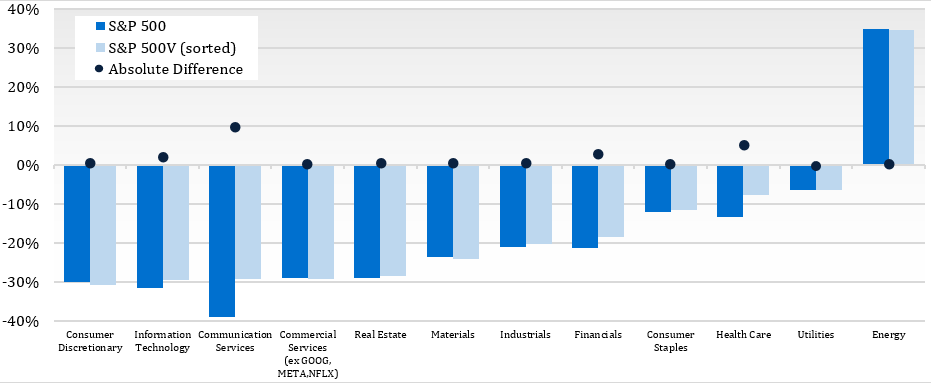
Portfolio Weight
Source: FactSet
Now let’s look at our sector mix. You can see our sector allocations compared to the S&P 500 and S&P 500 Value in the table at the bottom of the graph above. Compared to the S&P 500 Value, we had 15% more allocated to the two worst sectors (Information Technology and Consumer Discretionary), and 16% less allocated to the three best sectors (Energy, Utilities and Consumer Staples).
Our sector weights emerge from our bottom-up stock selection process, not from an active top-down, macro view. As you know, beyond Value, we look for Quality and Analyzability in our stocks. The traits of Quality and Analyzability have led us toward cheap stocks with attractive growth in Information Technology and Consumer Discretionary, and away from expensive stocks with little growth in Utilities and Consumer Staples.
Our bottom-up approach has served us well for most of our first 13 years, but it left us exposed to sector headwinds in 2022 (our 14th year).
Looking Forward
Presented on the graph below are our current and historical portfolio P/E ratios and the P/E of the S&P 500, with the bars at the bottom showing the valuation spread between the two. While we are well off the peak P/E spread of March 2020, our P/E spread versus the S&P 500 remains historically wide at 90%.
Furthermore, the declines in the equity market over the past year have compressed our year-end NTM P/E ratio to 8.8x and 9.2x for our EQ and CS composites, respectively. Those are very low valuations, even by our standards, and reflect the extreme negativity discounted in our stock valuations. In fact, the valuation at the end of 2022 was in the top decile of how cheap it’s been in our fourteen-year history.
Historical P/E Ratios and Valuation Spread
Source: FactSet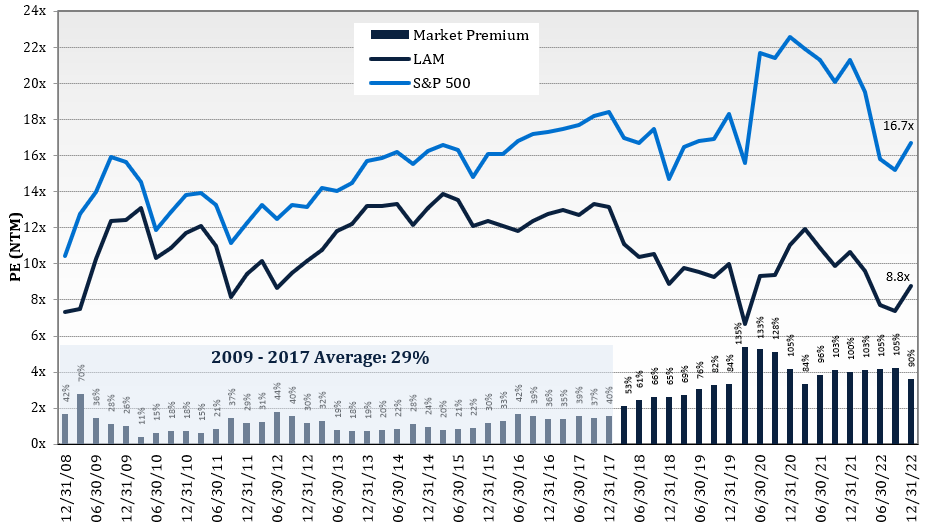
While the price declines in 2022 that got us to this level were painful, history suggests that future returns should be far better than normal. On the table below we present the forward returns of our portfolio from different month-end starting multiples. The results show that the lower the P/E multiple of our portfolio, the better our forward returns have been.
We have highlighted the 8x to 9x P/E range, which is where our EQ composite ended the year. Investing at this P/E range historically has resulted in strong average returns of 30% for the following year. It has been even better when you look at the three- and five-year returns of 91% and 140%, respectively. The relative returns have been just as impressive as the absolute: 5 percentage points in the first year, 22 percentage points over the three years and 36 percentage points over the five years.
It is also worth noting that if our portfolio appreciates into the 9-10x P/E range, the forward returns have nearly been as good as those from the 8-9x range.
Source: FactSet.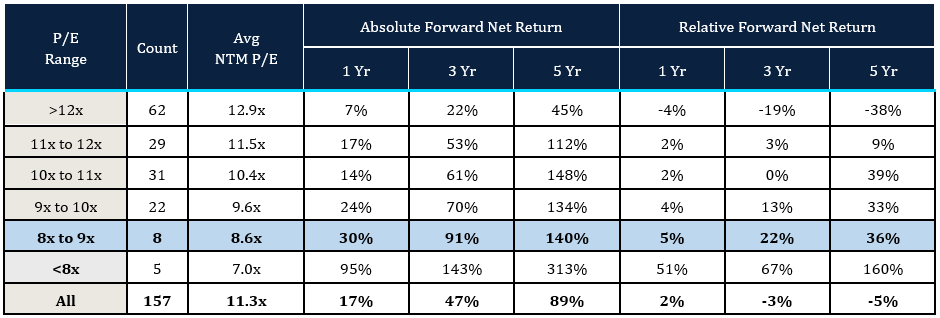
| Uses next twelve months price-to-earnings ratios as of the beginning of each month. |
While we are excited about the attractive valuation of our portfolio we are just as excited about its attractive growth.
Throughout our history our portfolios have had a lower forward P/E than the S&P 500 with comparable growth. Today, we do not just have comparable growth, but superior growth, as you can see on the right side of the graph below. In fact, over the last year our portfolio has had the best growth profile in our firm history. Additionally, the EPS history of our portfolio has exhibited less economic sensitivity than either the S&P 500 or the S&P 500 Value, with less earnings impact during the COVID shutdowns of 2020 and during the Global Financial Crisis of 2008-09.
Uncommon Combination of Deep Value and Growth
Source: FactSet.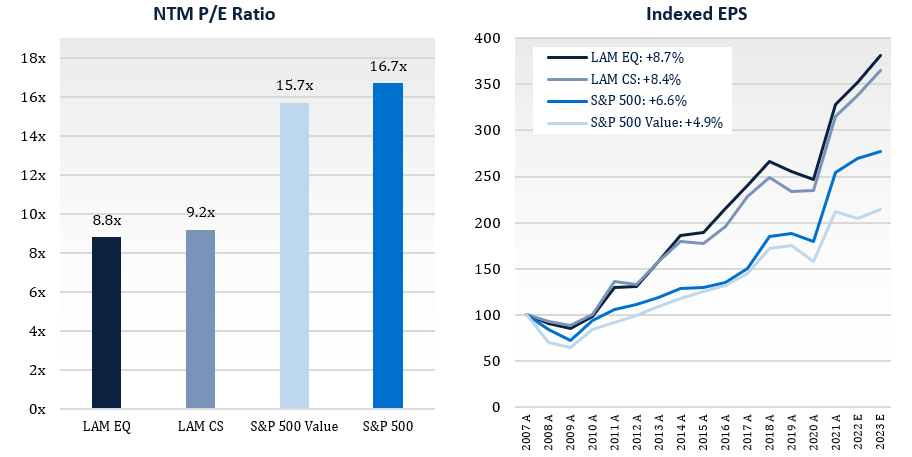
Conclusion
As we wrote in the opening of this letter, 2022 was a mixed year. While it never feels good to have a down year, we did outperform the S&P 500 for the second year in a row.
Our style benchmark, the S&P 500 Value index, outperformed both the S&P 500 and Lyrical’s composite in 2022. While it is nice to see that benchmark finally outperform, our analysis suggests that its success was more about its sector mix than its tilt toward a value style. Sector allocation abated as a factor in 4Q22, and so did our underperformance.
We look toward 2023 with optimism. We see our portfolio as a great collection of resilient, growing companies at deeply discounted valuations. Absolute valuations are at a level that historically have led to well above average results, and relative valuation spreads remain at historically wide levels, too. As we progress through the new year, there will inevitably be surprises, but the companies we own have demonstrated resilience in the past and should be well positioned to handle whatever 2023 gives us. (And so far, we are off to a good start.)
Andrew Wellington, Founder, Chief Investment Officer
|
THIS IS NOT AN OFFERING OR THE SOLICITATION OF AN OFFER TO INVEST IN THE STRATEGY PRESENTED. ANY SUCH OFFERING CAN ONLY BE MADE FOLLOWING A ONE-ON-ONE PRESENTATION, AND ONLY TO QUALIFIED INVESTORS IN THOSE JURISDICTIONS WHERE PERMITTED BY LAW. THERE IS NO GUARANTEE THAT THE INVESTMENT OBJECTIVE OF THE STRATEGY WILL BE ACHIEVED. RISKS OF AN INVESTMENT IN THIS STRATEGY INCLUDE, BUT ARE NOT LIMITED TO, THE RISKS OF INVESTING IN EQUITY SECURITIES GENERALLY, AND IN A VALUE INVESTING APPROACH. PLEASE SEE WWW.LYRICALAM.COM/NOTES FOR A DISCUSSION OF CERTAIN MATERIAL RISKS OF AN INVESTMENT IN LYRICAL’S STRATEGIES. PAST PERFORMANCE IS NOT NECESSARILY INDICATIVE OF FUTURE RESULTS. LAM – EQ RESULTS ARE UNAUDITED AND SUBJECT TO REVISION, ARE FOR A COMPOSITE OF ALL ACCOUNTS, AND SHOW ALL PERIODS BEGINNING WITH THE FIRST FULL MONTH IN WHICH THE ADVISOR MANAGED ITS FIRST FEE-PAYING ACCOUNT. NET RETURNS INCLUDE A 0.75% BASE FEE AND 20% INCENTIVE ALLOCATION ON RETURNS OVER THE S&P 500 VALUE®, SUBJECT TO A HIGH WATER MARK PROVISION. THE S&P 500® IS WIDELY REGARDED AS THE BEST SINGLE GAUGE OF LARGE-CAP U.S. EQUITIES. ACCORDING TO THE ANNUAL SURVEY OF ASSETS BY S&P DOW JONES INDICES (“S&P”), AN ESTIMATED USD 15.6 TRILLION IS INDEXED OR BENCHMARKED TO THE INDEX, WITH INDEXED ASSETS COMPRISING APPROXIMATELY USD 7.1 TRILLION OF THIS TOTAL (AS OF DEC. 31, 2021). THE INDEX INCLUDES 500 LEADING COMPANIES AND COVERS APPROXIMATELY 80% OF AVAILABLE MARKET CAPITALIZATION. THE S&P 500® VALUE DRAWS CONSTITUENTS FROM THE S&P 500®. S&P MEASURES VALUE USING THREE FACTORS: THE RATIO OF BOOK VALUE, EARNINGS, AND SALES TO PRICE. S&P STYLE INDICES DIVIDE THE COMPLETE MARKET CAPITALIZATION OF EACH PARENT INDEX INTO GROWTH AND VALUE SEGMENTS. Notes: All market data is courtesy of FactSet. Indexed EPS growth depicts the historical change in earnings per share of the companies in the LAM U.S. Value Equity strategies using weights in the LAM-EQ composite as of December 31, 2022. Actual holdings, and their weights, varied over time. Earnings per share is computed using consensus earnings data per FactSet, which include certain adjustments from reported, GAAP earnings. Periods marked with an “E” include estimated earnings per share. The Historical Portfolio P/E (NTM) chart compares the weighted average next twelve months P/E ratios as of the beginning of each quarter for the LAM-EQ composite and the S&P 500 Index. Actual beginning of quarter LAM-EQ composite weights are used. |
Editor’s Note: The summary bullets for this article were chosen by Seeking Alpha editors.
Be the first to comment