

tdub303
By Valuentum Analysts
Dividend growth and income investors know that a dividend cut could be disastrous to their portfolios, as future income is not only reduced, but it is also very likely that capital is permanently impaired. A look at the price performance of a company after a dividend cut is quite telling. The Dividend Cushion ratio is designed to provide the income investor with an independent opinion — and one that is rooted in forward looking, free cash flow (“FCF”) analysis — of the strength and future growth potential of a company’s dividend. It not only helps to identify tremendous financial risks that may lead up to a potential dividend cut, but it also estimates the “cushion” to reveal just how much capacity a company has to continue growing its dividend into the future.
The Dividend Cushion ratio is one of the most powerful financial tools an income or dividend growth investor can use in conjunction with qualitative dividend analysis. The ratio is one-of-a-kind in that it is both free-cash-flow based and forward looking. Since its creation in 2012, the Dividend Cushion ratio has forewarned readers of approximately 50 dividend cuts. We estimate its efficacy at ~90%. (Image Source: Valuentum)
Technically speaking, the Dividend Cushion ratio considers the company’s net cash on its balance sheet (total cash less long-term debt) and adds that to its forecasted future free cash flows (cash from operations less capital expenditures) over a five-year period and divides that sum by the company’s future expected cash dividend payments over the next five years. At its core, it tells investors whether the company has enough cash to pay out its dividends in the future, while considering its debt load (capital structure). If a company has a Dividend Cushion ratio above 1, it can cover its dividend, but if it falls below 1, trouble may be on the horizon.
Lumen Is a Quintessential Example of the Differentiation and Effectiveness of the Dividend Cushion Ratio
Lumen Technologies, Inc. (NYSE:LUMN), a provider of cloud storage and IT solutions as well as IP and data applications, announced in its third quarter press release November 2 that it will eliminate its stock dividend and that there would be no dividend paid in the fourth quarter of 2022. Lumen’s Dividend Cushion ratio, a measure we calculate to assess the likelihood of a dividend cut (the lower the ratio, the worse) stood at -3.9 (negative 3.9) at the time of the cut. Here is how the ratio was derived.
Dividend Cushion Deconstruction (Image Source: Valuentum)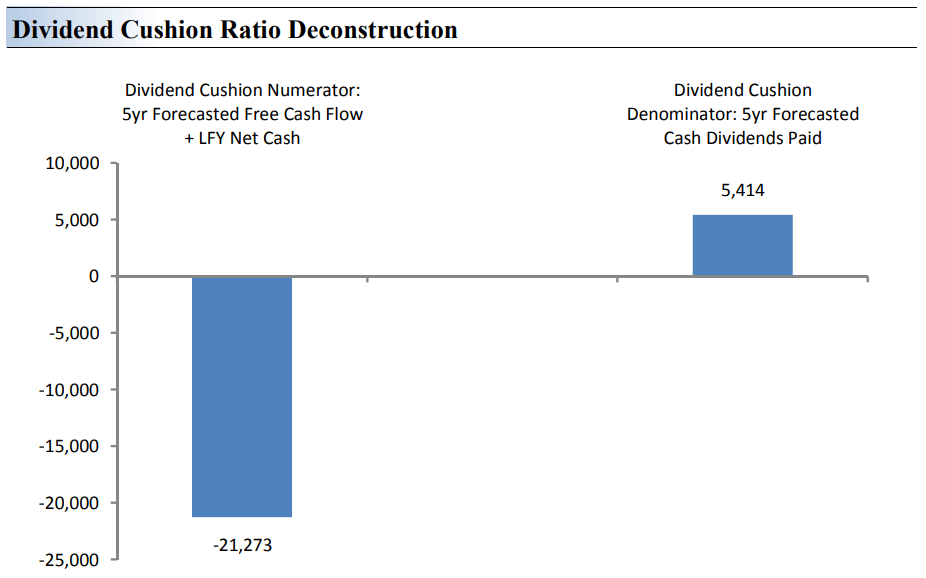
The Dividend Cushion Ratio Deconstruction, shown in the image above, reveals the numerator and denominator of the Dividend Cushion ratio for Lumen before it cut its payout. At the core, the larger the numerator, or the healthier a company’s balance sheet and future free cash flow generation, relative to the denominator, or a company’s cash dividend obligations, the more durable the dividend. In the context of the Dividend Cushion ratio, Lumen Tech’s numerator is smaller than its denominator, suggesting weak dividend coverage in the future.
The Dividend Cushion Ratio Deconstruction image puts sources of free cash in the context of financial obligations next to expected cash dividend payments over the next 5 years on a side-by-side comparison. Because the Dividend Cushion ratio and many of its components are forward-looking, a dividend evaluation may change upon subsequent updates as future forecasts are altered to reflect new information. It was clear that on the basis of the Dividend Cushion ratio, Lumen’s dividend was not on healthy ground.
Lumen’s key statistics before the dividend cut. (Image: Valuentum)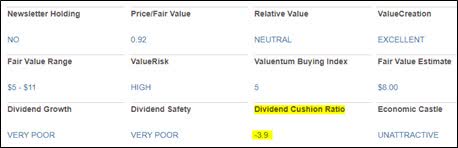
But here is why the Dividend Cushion is so unique. A lot of times, investors only focus on the dividend payout ratio – dividends paid per share divided by earnings per share – or free cash flow coverage of the dividend, but the balance sheet is so very important to the sustainability of the dividend, too – something that the Dividend Cushion ratio embraces but other dividend health metrics do not.
For example, Lumen’s dividend payout ratio was 50% ($0.75 in dividends divided by $1.50 in earnings per share during the first three quarters of the year), and its free cash flow was enough to cover its cash dividends paid during the first nine months of 2022, too. Free cash flow generation was $1.7 billion during the first three quarters of 2022, while cash dividends paid came in at $780 million.
However, Lumen Tech held a massive ~$25 billion net debt position at the end of the quarter, which pushed its Dividend Cushion ratio deep into negative territory, raising a huge red flag with respect to the sustainability of the payout. Ignoring the balance sheet both with respect to intrinsic value and dividend analysis could be a recipe for disaster. Other metrics are lacking when they ignore the important analytical information contained on the balance sheet.
Concluding Thoughts
Shares of Lumen have languished this year, and the firm authorized up to a $1.5 billion, two-year share repurchase program, but even that may be ill-advised, as the firm retains a mountain of net debt which should be pared down, in our view. The company doesn’t need any more leverage.
The writing was on the wall with respect to concerns over the sustainability of Lumen Technologies’ dividend payout, not only with respect to its tremendously weak and deeply negative Dividend Cushion ratio, but also as it relates to the company’s share price action. Lumen Tech is a great example of why it is important to have an effective dividend methodology.
This note is not so much about what investors should think about doing with Lumen from here on out, but rather one that highlights why it is important to have a systematic dividend process that doesn’t chase high-yielders and is grounded not only in future expectations of free cash flow but also on balance sheet health (net cash, in particular).
We’d love to hear about your dividend methodology in the comments section. Thank you for reading and don’t forget to follow us, if you haven’t already!
Be the first to comment