

alvarez
Investment Thesis
The US domestic natural gas market and the global natural gas market have historically been decoupled, due to transportation constraints. US export volumes were too small to significantly impact domestic supply-demand balance.
Dramatic success in the US with fracking and horizontal drilling technology circa 2007 created a surplus of gas in the US, which motivated the development of LNG export capacity to sell this gas into the higher priced global market.
US LNG export capacity recently achieved the ability to export enough gas to reduce the US surplus and partially couple the US market to the global market. The increase in export capacity coming on line over the next three years will further strengthen this coupling.
The likely effect of exporting surplus US gas and putting the US market in completion with the global market will be to raise and support the price of natural gas in the US for at least the next two decades.
US natural gas prices well above the ~$2-4 Henry Hub pricing typical of recent years would have wide implication; positive for upstream gas producers and midstream gas pipelines, negative for industrial users and consumers.
Introduction
To assess this thesis, we will first look at the volume of US natural gas production, and the import and export of gas from Canada and to Mexico via pipeline.
Turning then to LNG, we will look at US LNG facilities and capacity, LNG transport, LNG export volumes, the global market, and price differentials between the US and global market, and then wrap up with some comments on risk and implications for investors.
Some Basic Terms and Numbers
It’s useful to keep some basic terms and numbers in mind.
The American Petroleum Institute describes LNG as “a clear, odorless, noncorrosive, nontoxic liquid that is formed when natural gas is cooled to around -260 F. This shrinks the volume by 600 times, making it easier to store and transport. LNG is not stored under pressure and is not explosive or flammable in its liquid state, but does require special equipment and handling procedures.
Natural gas and LNG liquid volumes and rates are reported in various units – cubic feet, cubic meters, and metric tons. Rates are usually per day, or per annum (i.e. per year). Some example abbreviations: cf, cm, bcfd is billion cubic feet per day, mta is million metric tons per year.
Gas at commercial scale is actually priced by energy content, measured in BTUs, e.g. $/mmbtu, i.e. $/million BTUs. The energy content varies slightly by source, but about 1037 BTU per cubic foot is typical. That makes 1000 cubic feet close enough to 1 mmbtu that they are often used interchangeably (and we will do so in this article).
Conversion factors: one million tons of LNG is 48.7 bcf or 1.4 bcm of gas. One bcf of gas is 45,000 cubic meters of LNG liquid. One cubic meter is 35.3 cubic feet. See here for other conversions.
About 40% of US gas consumption is used to produce electric power. Both overall consumption and use for power generation are setting an all time high in 2022. An estimated 71 million households and 186 million people directly use gas; average consumption is about 65,000 cubic feet per year per household.
US Production and Exports Volumes
The US currently produces about 100 bcfd of natural gas, and exports about 11% of that as LNG. This is a large and fairly recent change.
US natural gas production was fairly stable at about 53 bcfd for a decade before 2007. In 2007, the US was importing about 20% of the gas it used, and plans were being made to build LNG receiving terminals to import gas. As the chart below illustrates, there was in inflection point around 2007. What happened?
“EIA”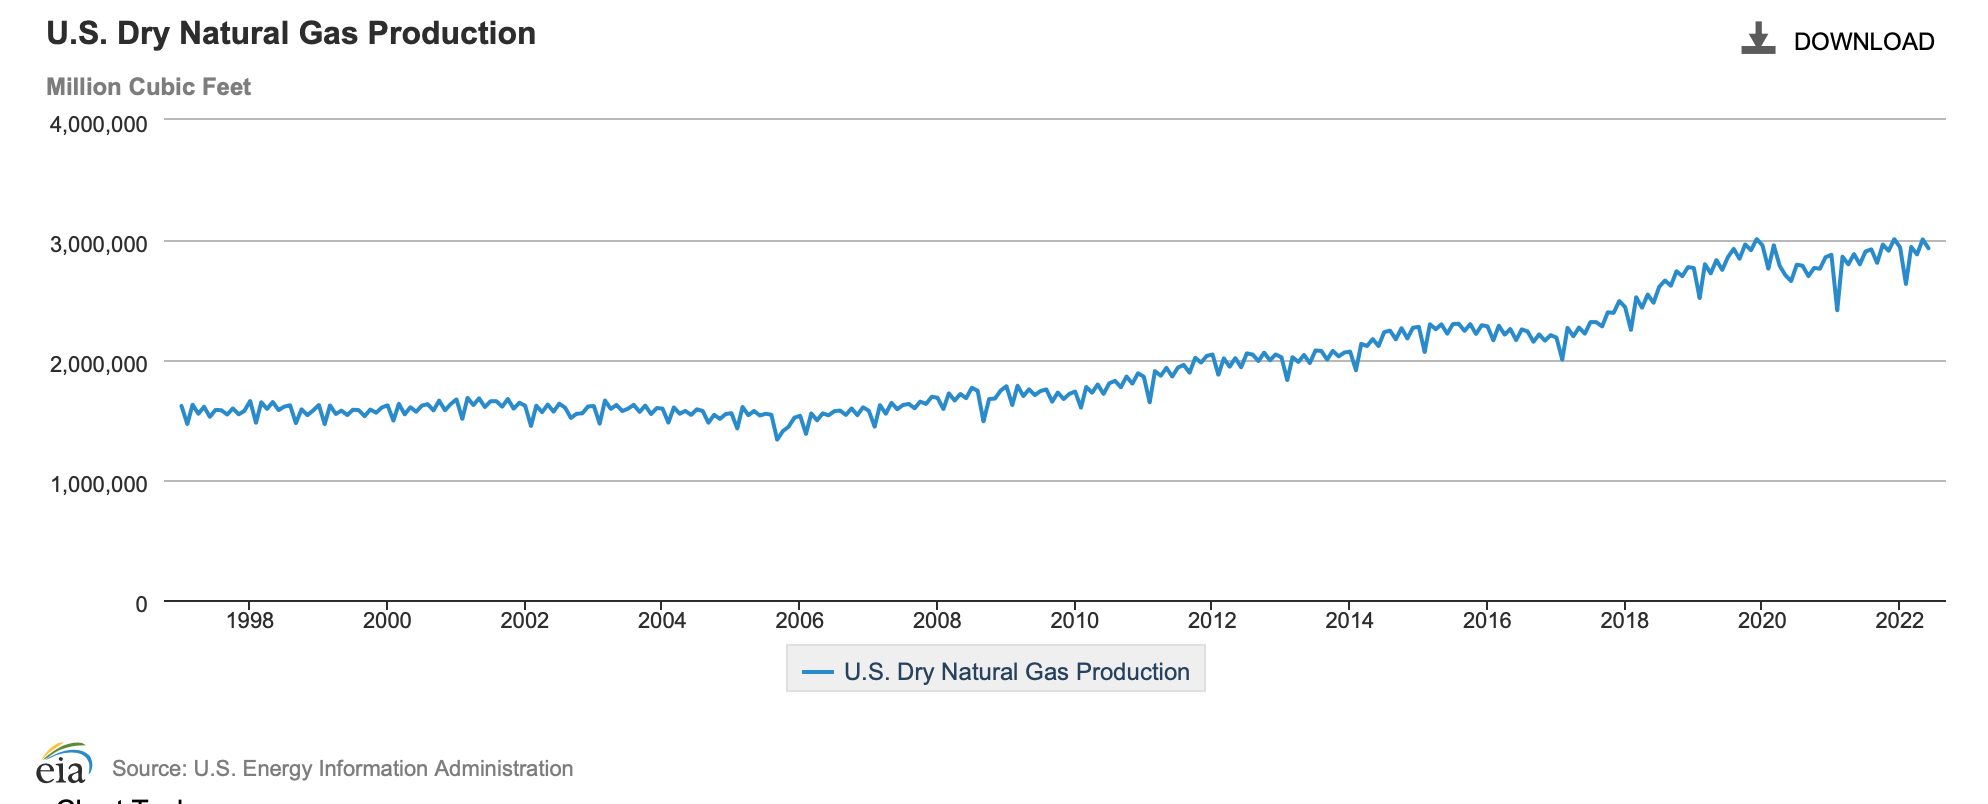
Fracking and horizontal drilling combined to revolutionize production from shale. Shale gas production increased from 5 bcfd to 75 bcfd, driving total production to 100 bcfd by December 2019.
Growth of Shale Gas Production “EIA”
US as Net Exporter
The US became a net exporter of natural gas in 2017.
The majority of these exports were by pipeline, to Mexico and Canada. Canada both exports and imports gas to and from the US, but on net exports to the US.
For 2021, imports and exports via pipeline were 5.1 bcfd (net imports) from Canada and 5.9 bcfd to Mexico respectively, nearly offsetting each other.
The US currently exports about 5.7 bcfd to Mexico, via pipeline, meeting about 70% of natural gas demand in Mexico.
Routine LNG exports from the US began in February 2016. US LNG exports per month are shown in the chart below. The COVID demand drop in 2020 is visible.
US LNG Exports Per Month “EIA”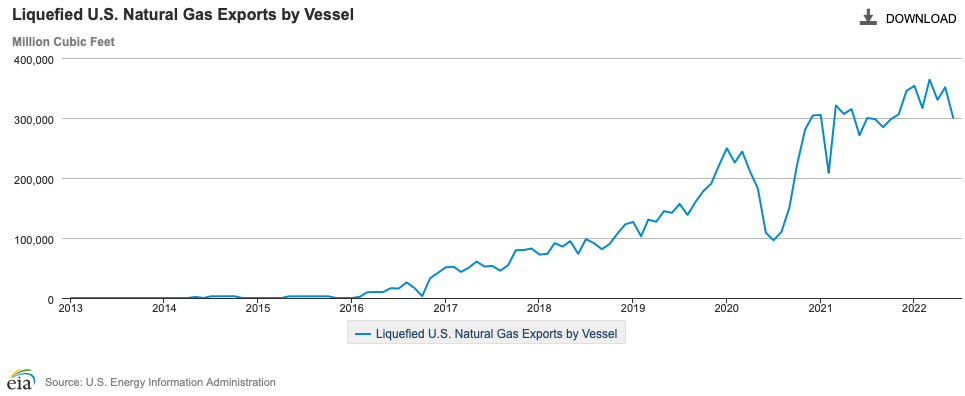
By 2021 the volume of US LNG exports exceeded pipeline exports for the first time, with LNG contributing 54%.
US LNG exports averaged 11.1 bcfd during 1H22, with exports to about 40 countries.
LNG Export Facilities in the US
LNG export facilities are large and expensive industrial facilities. They receive the natural gas via pipeline, remove impurities, cool the gas to liquid form, store it as a liquid, and load it into a ship. The liquefaction process occurs in a multi-step refrigeration process; the equipment to do this is called a train.
Construction and operation of LNG facilities are regulated by the Department of Energy and the Federal Energy Regulatory Commission. Approvals are normally in hand before a Final Investment Decision “FID” is made. After the FID, it takes 3-5 years to actually build the facility. In some cases, additional trains may be added to increase the initial capacity.
New LNG facilities are very large capital investments; e.g. $10 billion at Golden Pass, and $13 billion at Plaquemines.
The August 2022 update to the EIA database on LNG facilities shows 7 production facilities in the US, with 3 more under construction.
US LNG Facilities (Table by author, EIA data)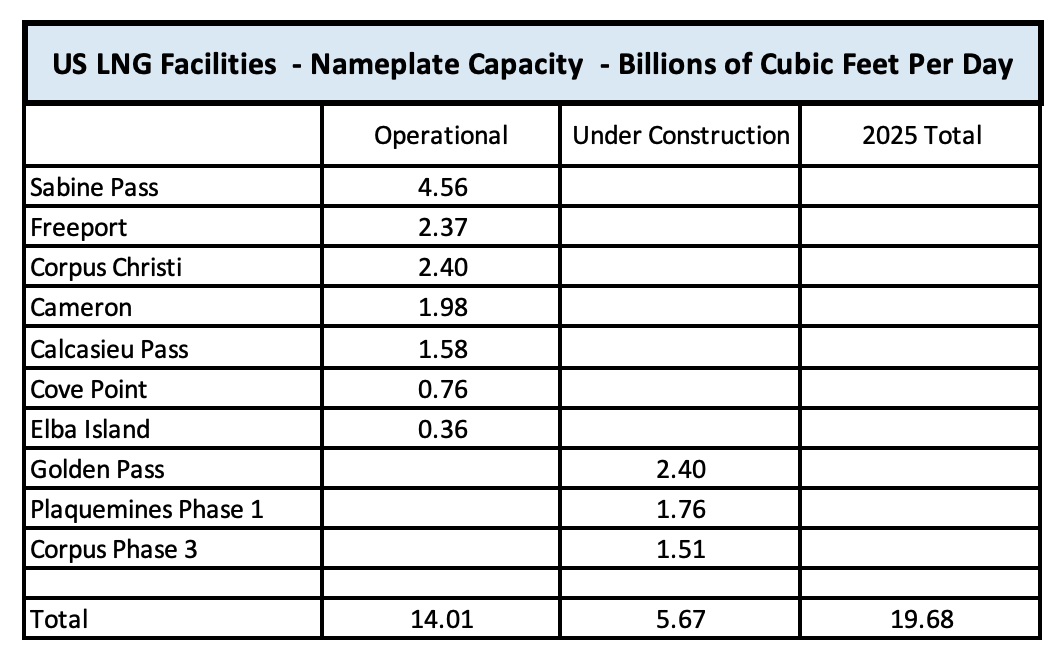
It’s easy to see that an event such as the explosion and fire which shut down the Freeport terminal in June 2022 could be a significant market event. Natural Gas Intelligence reported in late August that partial operation is expected in November, and full operation in March 2023.
The actual production achieved is typically about 87% of nameplate capacity, with US LNG exports currently running ~ 11.2 BCF/day, or about 11% of US production.
The graphic below shows the growth of export capacity over time. The bumps in capacity at a facility reflect additional trains coming on line.
US LNG Export Capacity “EIA”
In addition, about a dozen additional facilities, which would double the planned 2025 capacity, have received regulatory approval and are awaiting a FID.
This includes the development of less traditional capacity, such as this proposed Delfin LNG brownfield deep water facility 40 miles off the coast of Cameron Parish, Louisiana. The facility will employ one or more Floating Liquefied Natural Gas “FLNG” vessels.
The map below illustrates the geographic concentration of facilities on the Texas-Louisiana Gulf Coast – 8 of 10 facilities and 95% of 2025 capacity. LNG Industry Magazine reports on the current expansion.
Location of LNG Export Facilities “EIA”
To better understand the scope of a facility, it’s useful to look in a bit more detail at one example. Sabine Pass is the largest LNG exporting facility in the US, and the world. Originally conceived and built as an LNG import terminal, with initial construction in 2005, it illustrates the shift in the import/export market. Owned by Cheniere Energy (NYSE:LNG), it began operation in 2016, and occupies 1000+ acres. Its six liquefaction trains have a combined capacity of ~ 30 mtpa, processing up to 4.7 billion cubic feet of gas per day. Capacity has grown over time, with the initial two trains completed in 2016, two more in 2017, the fifth in 2019, and the last in February 2022. Loading capacity is also being expanded with a third berth for LNG carriers schedule for Q1 2023.
LNG Carriers
Once the gas has been liquified, its loaded onto special ships called LNG carriers, easily identified by their iconic 4 or 5 domed LNG tanks.
About 600 LNG carriers were in operation in January 2021, with another 140 on the order books. The majority of the ships are constructed in South Korea.
Cargo capacity is measured in cubic meters, with an average of ~ 160,000 cm of liquid, which equates to 3.44 bcf of gas.
This May 2021 report by Offshore Source provides a good overview of the global LNG fleet and market.
This calculator provides an estimate of the cost to move a cargo from port to port, and is a useful way to get a feel for transportation cost in the global market. For example the 11 day trip from Sabine Pass to the UK is currently estimated at $3.30 per mmbtu, and the 24 day trip to South Korea $7.49. In contrast, the 1 day trip from Algeria to France is $0.45. The estimate includes the charter day rate, port fees, and tolls. It also includes heel and boil off cost, and is thus fairly sensitive to LNG price.
LNG – A Global Market
LNG exports in 2021 provide evidence of the extent of US participation in the global market. The top 15 export destinations listed below account for 88% of total US exports for the year.
US 2021 LNG Export Destinations (Table by author, EIA data)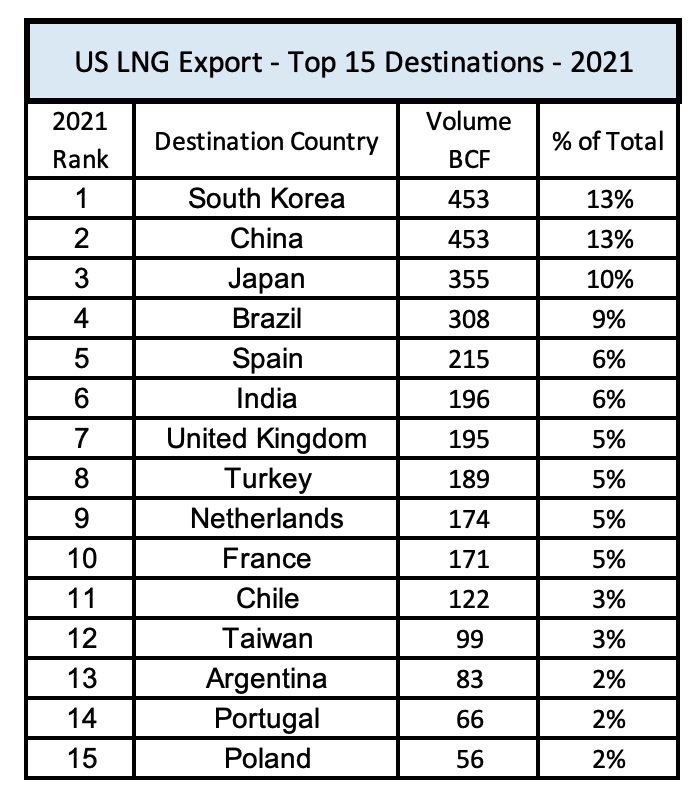
The US was expected to become the top LNG exporter in the world in 2022, meeting ~ 22% of expected world LNG demand of 53.3 bcfd, according to this December 2021 report. The EIA confirms this occurred in early 2022. The change is the last few years is dramatic.
LNG Exports (Reuters)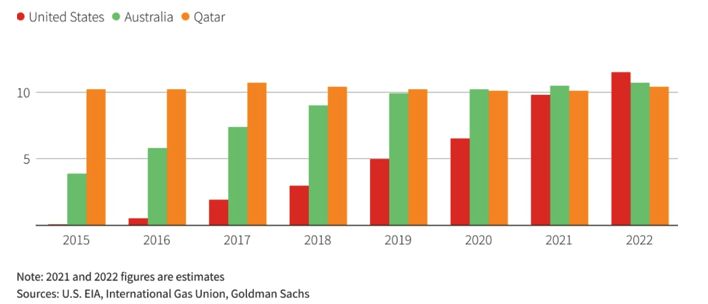
Pricing
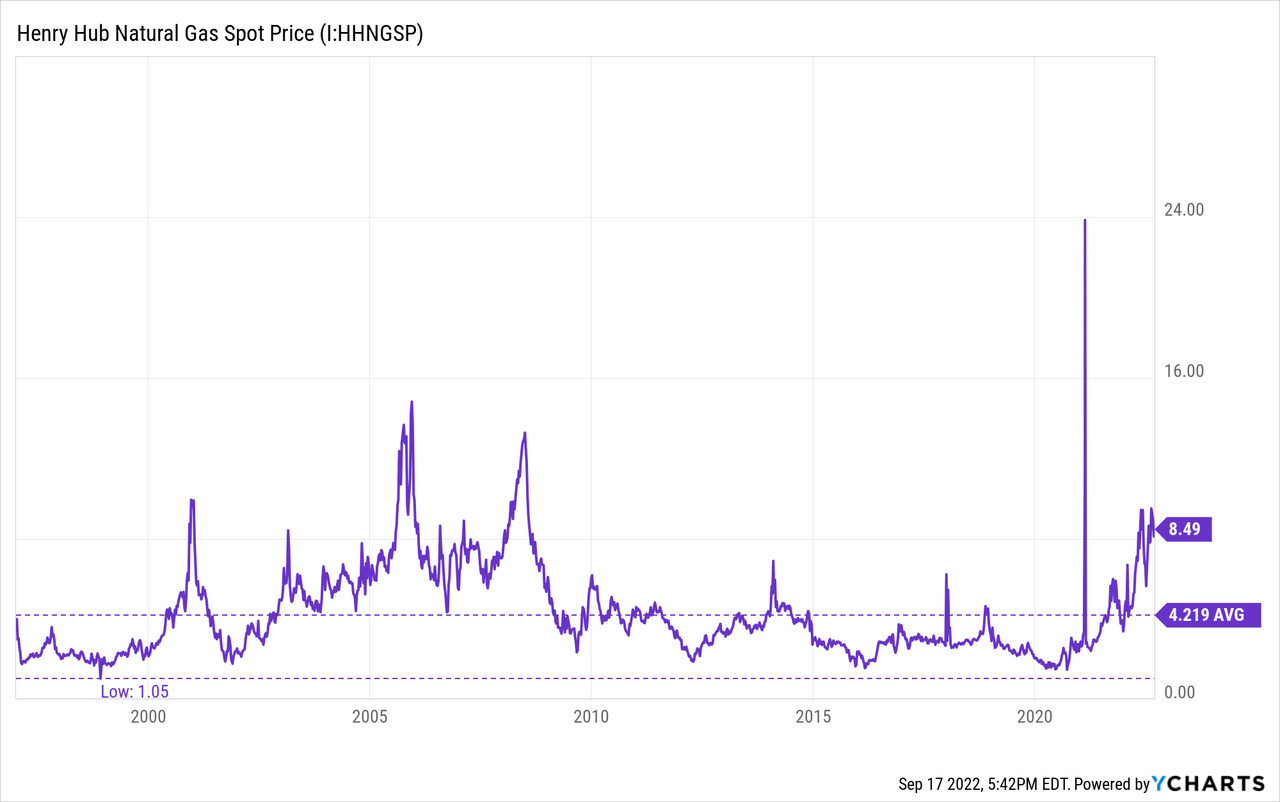
US natural gas prices at often benchmarked by the price at the Henry Hub, a junction point in Louisiana for multiple interstate pipelines .
The first chart below shows the price increasing in the in the years before shale production ramped up, the decline thereafter, and the recent ramp from early 2020. The sharp spike is associated with a February 2021 winter storm.
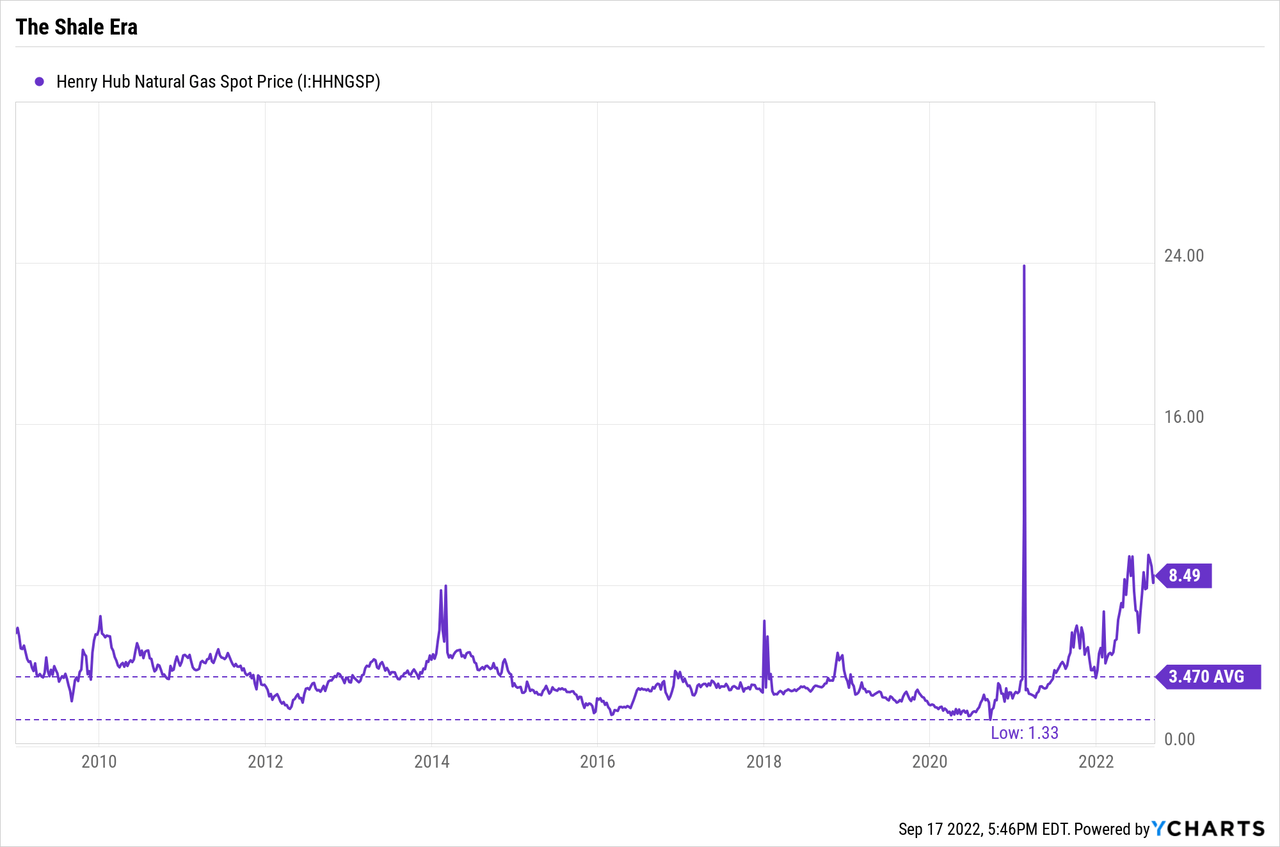
The next chart below focuses on the shale era, with benchmark prices typically ~ $2-4, until about 2021, which is about the time LNG exports became significant.
When gas can’t readily move within a market, geographic sub-markets, with price differentials, result. The Waha to Henry Hub price spread in the US nicely illustrates this effect (see graphic below).
When increased production in the Permian basin, collected at the local Waha hub, exceeded the capacity of existing pipelines to move gas to the national Henry Hub market, Permian gas became a glut on the market, and prices declined, sometimes to below zero. Since much of this gas was a byproduct of desired oil production (associated gas), it continued to be produced.
When additional pipelines went into operation (e.g. the Kinder Morgan (KMI) 2.1 bcfd Permian Highway pipeline on 01 January 2021), the transportation bottleneck was removed, and the price gap closed.
Waha vs. Henry Hub Spread “EIA”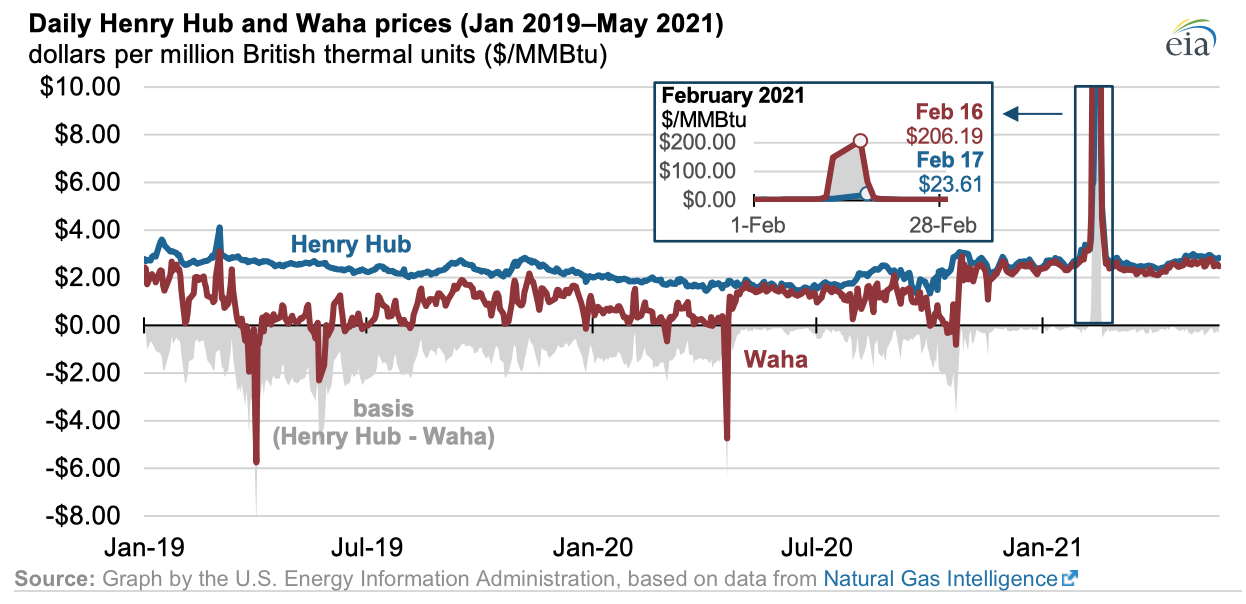
This same transportation bottleneck price gap effect is visible between the US and the global market. Generally, the has been a persistent price gap between US Henry Hub and global benchmarks: TTT (Netherlands), NBP (UK), and JKM (Japan-Korea).
This chart from Global LNG Hub shows the impact of reduced demand during COVID. The similarity in prices among TTT, NBP, and JKM suggests competitive bidding for the same LNG cargoes – in essence a global market.
Hub Price Differentials (Global LNG Hub)
This current chart from Global LNG Hub illustrates the recent price difference between the US Henry Hub, European TTT, Japan-Korea JKM. Note the gradual increase in the Henry Hub price in 2022 as Europe bids for gas to replace 10 bcfd of Russian imports. (The EUA-ETS data on the chart refers to emissions trading, not natural gas).
Hub Price Differentials (Global LNG Hub)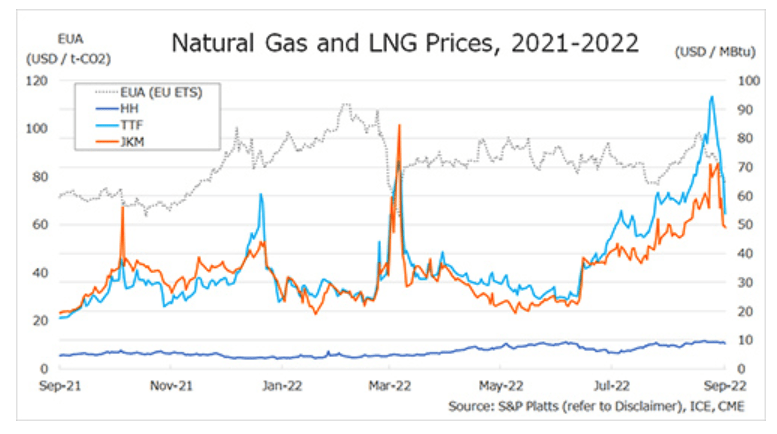
Although there are fluctuations, overall there is a persistent gap between US and global prices, which appears sufficient to continue to draw an increased share of US production. Indeed, in a world where LNG transport capacity was unlimited, HH, TTT, and JKM prices should be almost the same.
Looking Ahead
Investors worldwide are responding to the increased demand for energy. In addition to the US, major projects are underway to increase LNG output in Qatar, Russia, and elsewhere.
McKinsey projected in 2021 that worldwide gas demand will grow 0.9% per year through 2037, then slowly decline about 0.4% per year. LNG growth will be 3.4% through 2035, and then slow to 0.5% growth through 2050.
Riviera News reported in August 2022 on a study done by Rystad Energy (the article is worth reading in full). They estimate that LNG infrastructure investment will peak in 2024, and global LNG production will increase by 85%, peaking at about 700 mta in 2034. Demand for LNG should be strong for at least two more decades.
Global LNG (Riviera News)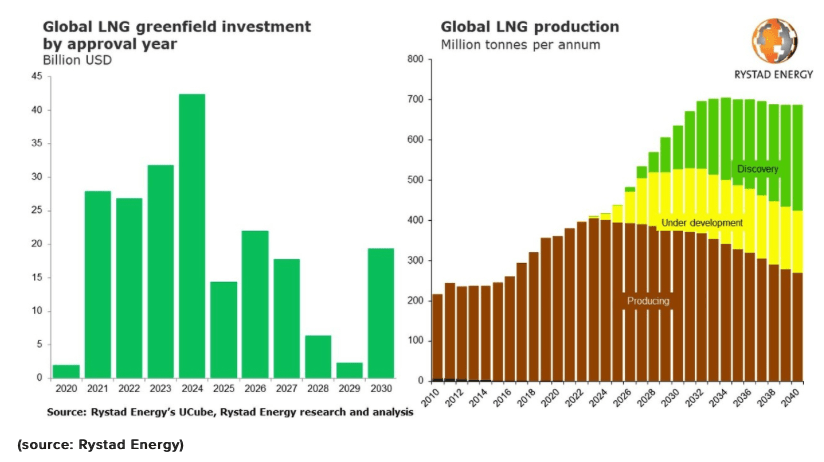
Risks
There are at least four potential risks to this thesis:
- export restrictions or prohibitions
- increased production outside the US sufficient to reduce US exports
- increased US domestic production sufficient to counteract the export effect
- reduced US domestic consumption sufficient to create glut pricing
1. The US government might restrict the export of natural gas to ensure supply and hold down prices in the US. There is precedent for this; the export of US produced crude oil was banned between 1975 and 2015. In February 2022 CNN reported that a dozen US Senators called for a curb on US gas exports; at least one US industrial trade group has made similar calls.
More concretely, in August 2022, U.S. Energy Secretary sent a letter to seven big US refiners encouraging them to voluntarily limit exports and adding that “If that is not the case, the Administration will need to consider additional Federal requirements or other emergency measures.”
Driven more by political preferences than economics, there is also social and political opposition to fossil fuel per se, including LNG exports.
2. Russia and Iran both have much larger proven gas reserves than the US, and are already significant producers. They might develop the capability to export enough gas to depress global LNG prices to the price US exports out of the market. Some of this gas might be delivered to some customers by pipeline.
3. Increased US gas production, particularly of the gas associated with oil production, might be large enough to counteract the supply-demand impact of exports, leaving Henry Hub prices little changed from recent years. See an EIA projection here.
4. Regulatory restrictions or prohibitions on the ~40% of US of natural gas used for electric power generation could reduce Us consumption enough to shift the supply-demand point back to glut, in spite of LNG exports.
My assessment:
I view export restrictions as the most likely of the four risks. But this is a largely a political rather than engineering or economic assessments, so anything could happen.
While Russia may eventually recover most of their lost market share post-Ukraine, I suspect increased global energy demand will absorb anything they can provide.
Given the natural decline in shale production, and the at least current preference for capital returns rather than production growth, $10 Henry Hub prices seem more likely than $4.
Regarding natural gas replacement in the US, I have written about this previously, and view it as technically unrealistic, although there are vocal advocates.
Investor Takeaway
In round numbers, US natural gas imports and exports by pipeline net to zero. US exports as LNG now account for about 11% of US production, with construction underway to increase this to ~ 15%. Further export capacity increases are being actively planned.
LNG export volume now appears to be to be taking enough gas out of the US domestic market to shift the Henry Hub price above the $3-4 range of recent years, and simultaneously to at least partially link the US domestic market to the higher priced global markets. A return to the pre-fracking Henry Hub price of $6 would be $9 in today’s dollars.
The likely outcome is a durable increase in the price of natural gas in the US domestic market, probably for two decades or longer.
Investors will likely see favorable conditions for upstream natural gas producers and midstream pipeline operators, and less favorable conditions for energy intensive industrial users. Consumer energy costs – both gas and electric – will likely be higher compared to recent years.
This analysis makes me more comfortable owning a portfolio of midstream companies. Personally, that includes Kinder Morgan (KMI), Enbridge (ENB), and Williams Companies (WMB). Should the widely predicted recession occur in the next few months, they may become available at quite attractive, rather than fair, prices.
Be the first to comment