

AscentXmedia/E+ via Getty Images
If there’s one thing that we can judge from the history of mankind, it’s that the human race has some innate drive to explore. Unfortunately, the modern era has put something of an end to this since the entire planet has already been explored at the surface and all that remains to be seen is beneath the water. But that doesn’t change the fact that individuals can still benefit tremendously from expeditions. One company that’s dedicated to giving consumers this experience is Lindblad Expeditions Holdings (NASDAQ:LIND). Prior to the COVID-19 pandemic, the company had done well to grow its revenue and to maintain profitability. Because of the pandemic, sales plummeted and profits followed suit. Fast forward to today, and we have seen some meaningful improvement in the company’s top line. But profitability still remains an issue. Long term, it’s highly probable that the company will recover back to its former glory. But given current economic conditions, that could take longer than some investors would like. Because of this and the risks associated with it, I would make the case that while the company could see some nice upside, it probably makes for a better ‘hold’ prospect at this time than it does a ‘buy’.
Exploring Lindblad Expeditions
According to the management team at Lindblad Expeditions, the company provides its customers with expedition cruising and land-based adventure travel that’s aimed at fostering a spirit of exploration and discovery. This specialized travel focuses on exposing its customers to the wildlife, nature, history, and culture of the areas that they travel to. The company also aims to promote guest empowerment, human connectivity, and interactivity. Management’s ultimate objective, besides generating a return for investors, is to provide its customers with life-changing adventures that they can’t get elsewhere at an affordable price.
Lindblad Expeditions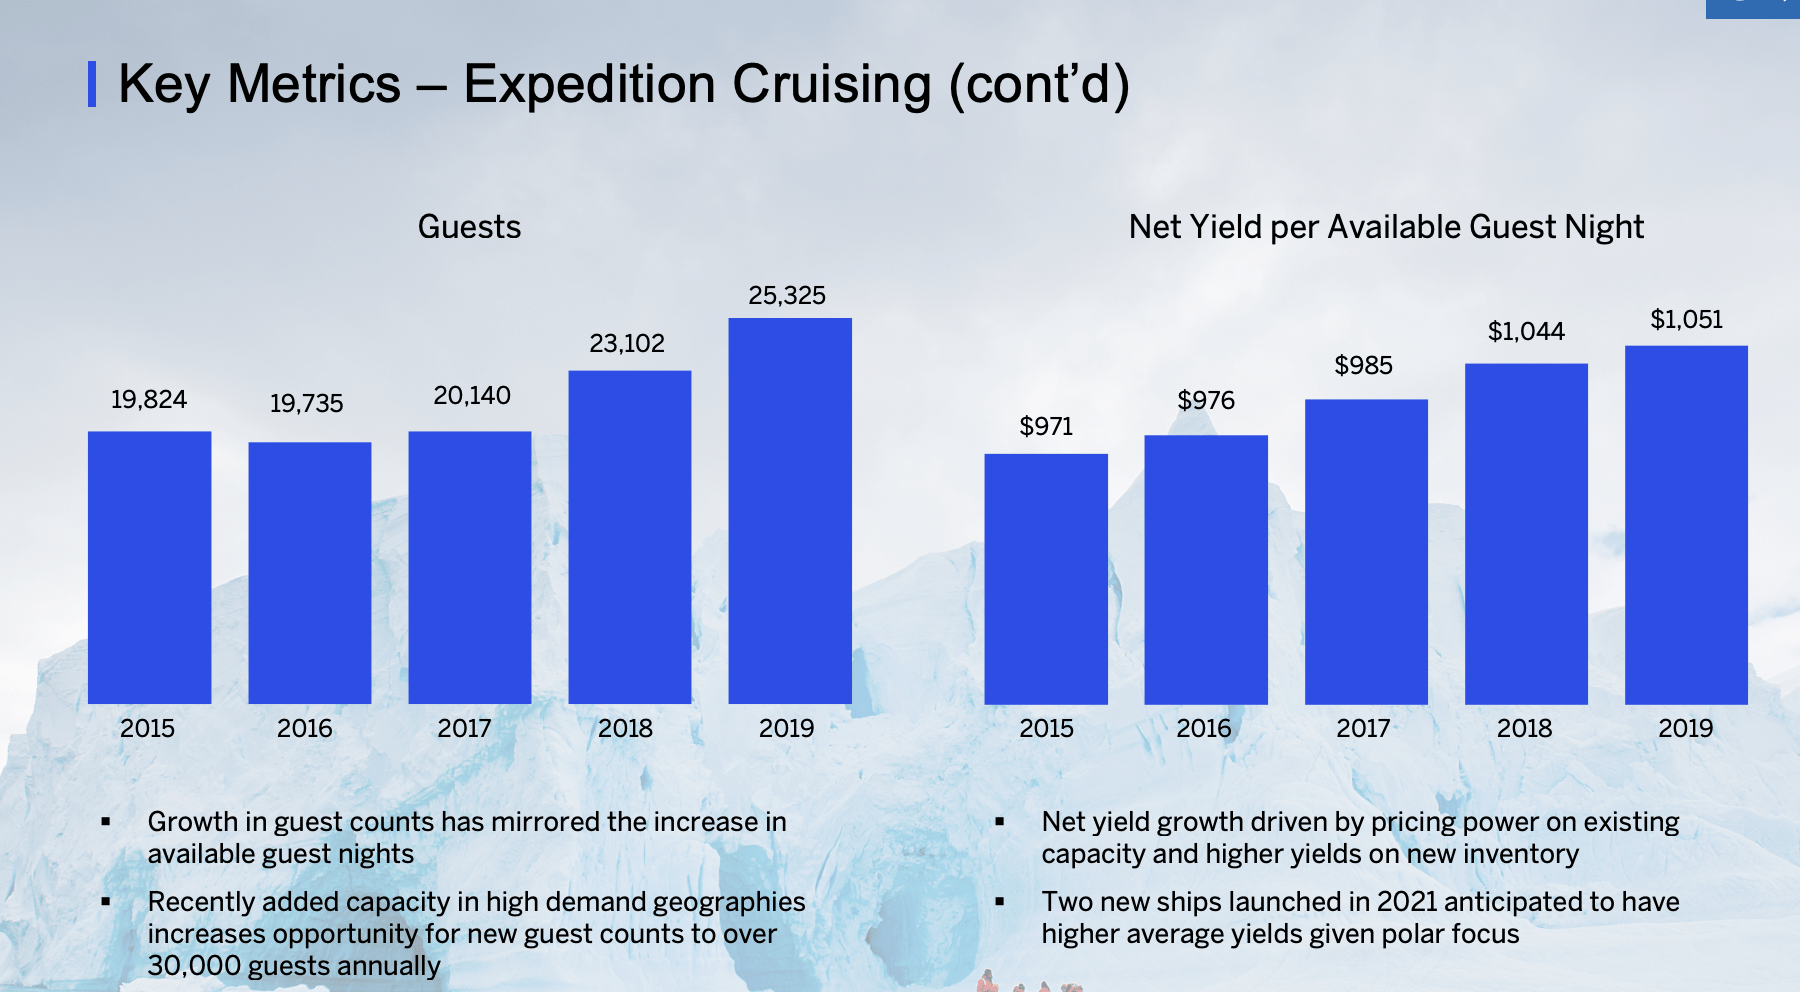
The vast majority of the company’s business focuses on ship-based expeditions aboard vessels that are smaller than your typical cruise ships. To put into perspective how much smaller these ships are, consider that your average cruise ship has a capacity of around 3,000 individuals. The largest of these ships that Lindblad Expeditions has boasts a capacity of just 148 individuals spread across 81 cabins. The smallest, meanwhile, can fit just 28 people. This allows the company added flexibility and where it goes and gives them the potential to offer up-close experiences in the wild and remote parts of the world, as well as major cultural centers that otherwise might be overlooked. Examples include Antarctica and the Arctic, as well as the Galapagos Islands, Alaska, and Baja California’s Sea of Cortez. The company achieves this through the fleet of 10 owned expedition ships and the five seasonal charter vessels that it has at its disposal. All of these operations fall under the Lindblad operating segment to the company. During its 2021 fiscal year, this segment accounted for 56.3% of the company’s revenue. However, prior to the pandemic, during 2019, it was responsible for a far more impressive 79.4% of sales. The company also has an exclusive strategic alliance with National Geographic involving all of its branded oceangoing small ship voyages throughout the Americas. Trip prices can range between $2,940 and $105,990, with an average price of roughly $14,000 and an average duration of 8 days, with a lower end of 4 days at a higher end of 31 days.
Lindblad Expeditions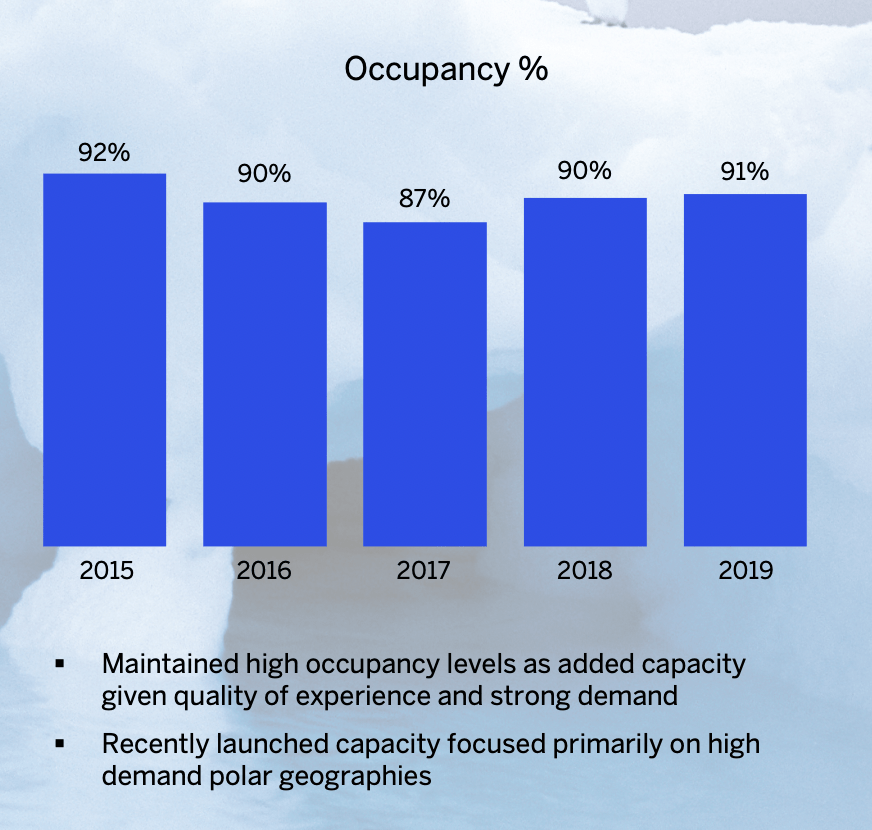
The other segment that the company has is referred to as Land Experiences. As its name suggests, this segment focuses on areas that do not really involve cruise ships. As an example, its Natural Habitat offering specializes in conservation-oriented adventures, including ones that are done in partnership with the World Wildlife Fund. Under the DuVine offering, the company focuses on luxury cycling and adventure tours across the globe, with many of those throughout parts of Europe, the US, and South America. It also includes culinary tours that can include specific winemaking regions, as well as focusing on lakes and volcanoes throughout Patagonia. As part of the experience, customers are also granted access to the high-quality gear and support necessary to make their journeys possible. The Off the Beaten Path offering the company provides involves active small group and private custom journeys across the globe, including experiences through the National Park system in the US. Many of these also involve outdoor activities like wildlife viewing, hiking, rafting, snorkeling, kayaking, and more. And finally, the Classic Journeys offering involves highly curated active small group and private custom journeys centered around cinematic walks led by expert local guides spread across 50 different countries.
Author – SEC EDGAR Data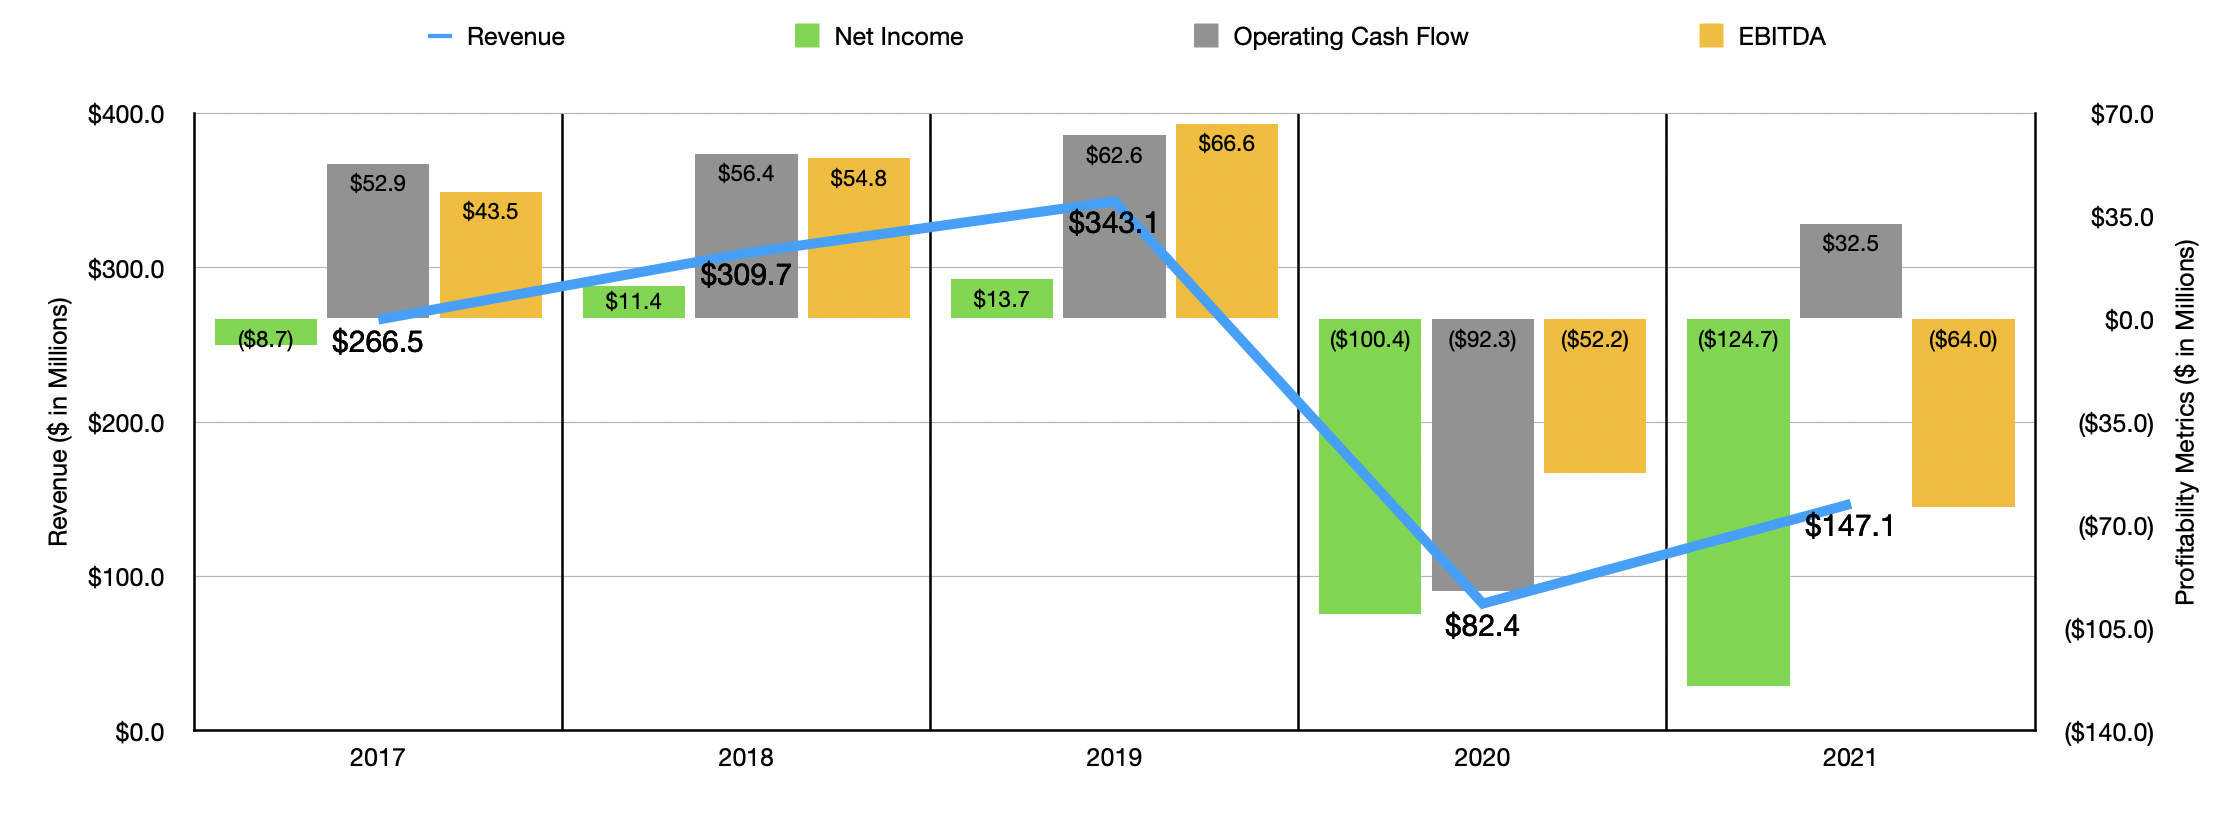
Prior to the pandemic, the management team at Lindblad Expeditions had done a good job growing the company’s top line. Revenue grew from $266.5 million in 2017 to $343.1 million in 2019. This was driven in large part by an explosion in the expedition cruising portion of the business, with its number of guests climbing from 20,140 in 2017 to 25,325 in 2019. Over that same window of time, guest spending per night rose from $985 to $1,051. The company also claimed that the occupancy rate of its cruises remained consistently high during this timeframe, averaging around 90% per year. Unfortunately, the pandemic really hurt the company, sending revenue down to only $82.4 million in 2020. We did see some recovery in 2021, with sales climbing to $147.1 million for that year. Fortunately, the 2022 fiscal year is showing some real improvement. Revenue in the first half of the year came out to $158.8 million. That compares to the $17 million generated the same time one year earlier.
Author – SEC EDGAR Data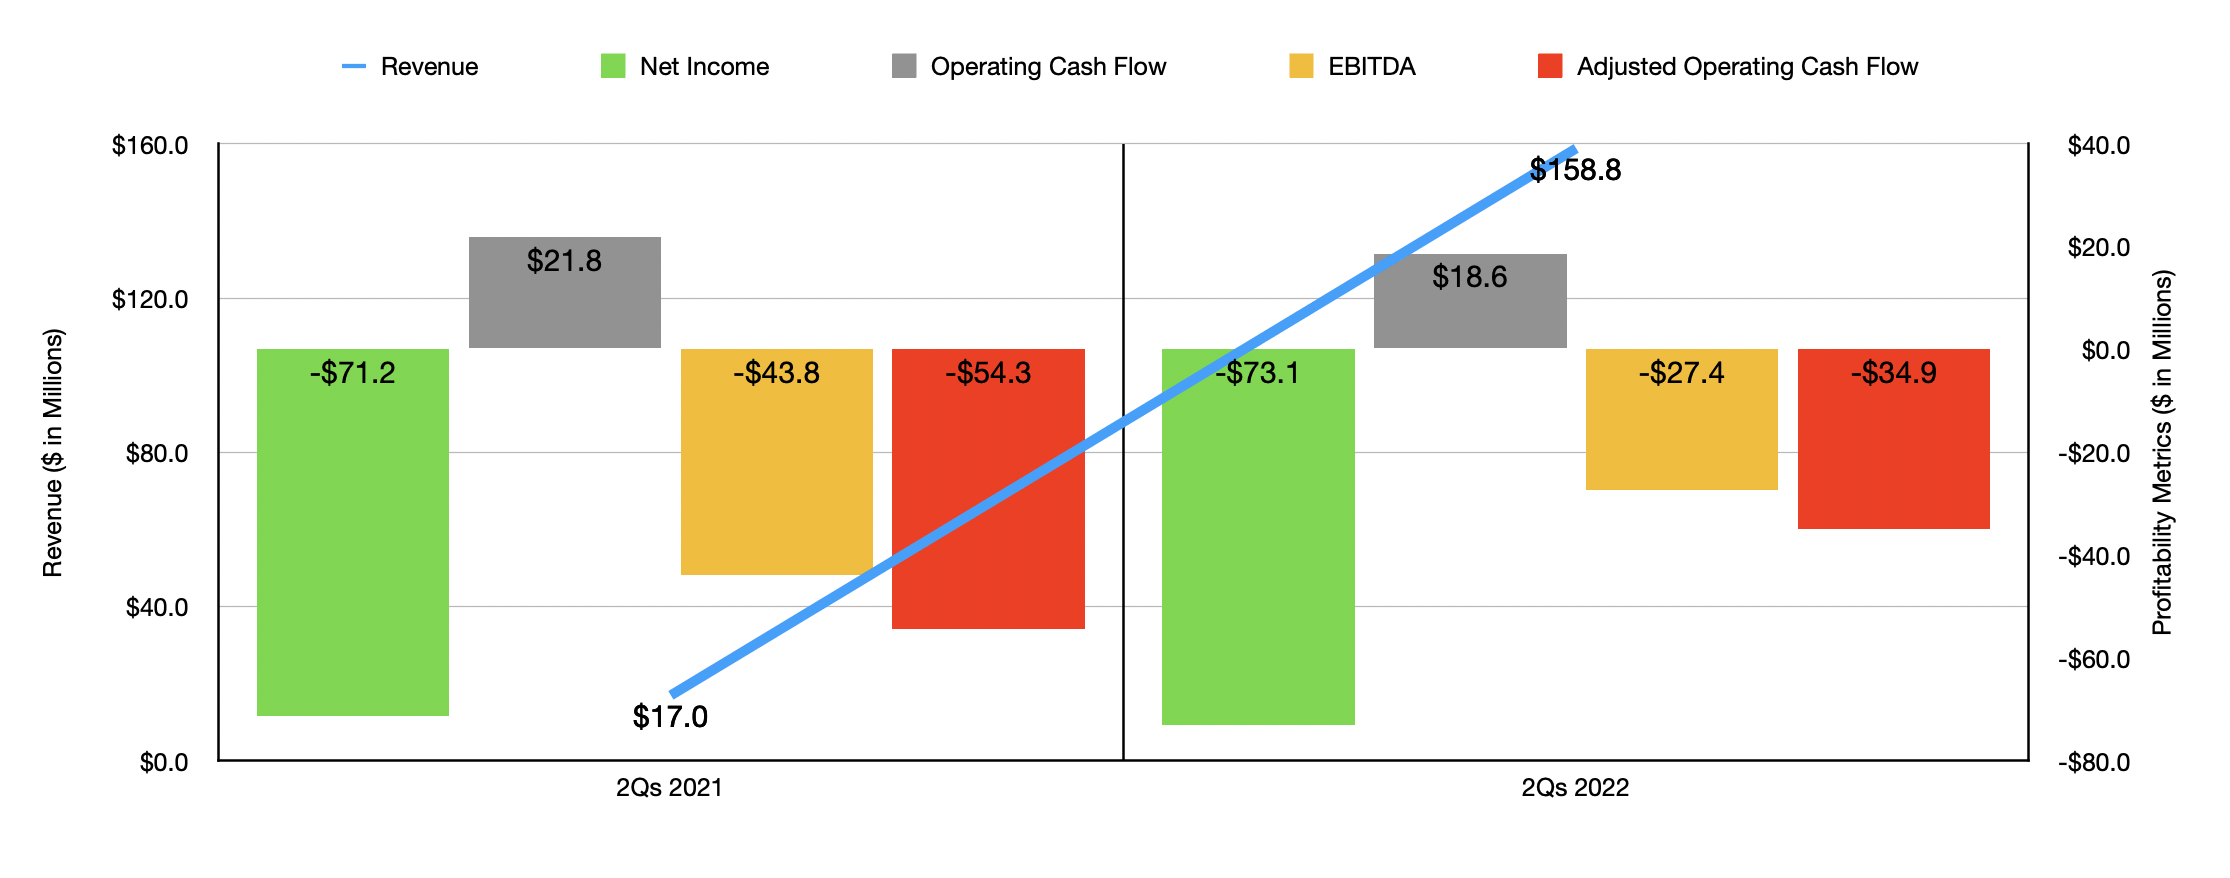
Because of high depreciation expense, as well as other factors, net profits for the company were never really that large. Between 2017 and 2019, the company went from generating a net loss of $8.7 million to a net profit of $13.7 million. In 2020, however, it generated a loss of $100.4 million. This loss widened to $124.7 million in 2021. Other profitability metrics have also been somewhat volatile. Operating cash flow grew from $52.9 million in 2017 to $62.6 million in 2019. Cash flow turned negative in the amount of $92.3 million in 2020 before turning positive again in the amount of $32.5 million last year. Over that same window of time, EBITDA followed a predictable pattern. After rising from $43.5 million in 2017 to $66.6 million in 2019, it then turned negative in the amount of $52.2 million in 2020 and $64 million last year. Although revenue is rising nicely this year, profits are far away from what we need them to be in order for the company to be attractive. The net loss of the company in the first half of 2022 came in at $73.1 million. That’s actually worse than the $71.2 million experienced one year earlier. Operating cash flow declined from $21.8 million to $18.6 million. If we adjust for changes in working capital, it actually would have gone from negative $54.3 million to negative $34.9 million. Meanwhile, EBITDA for the firm went from negative $43.8 million to negative $27.4 million.
Author – SEC EDGAR Data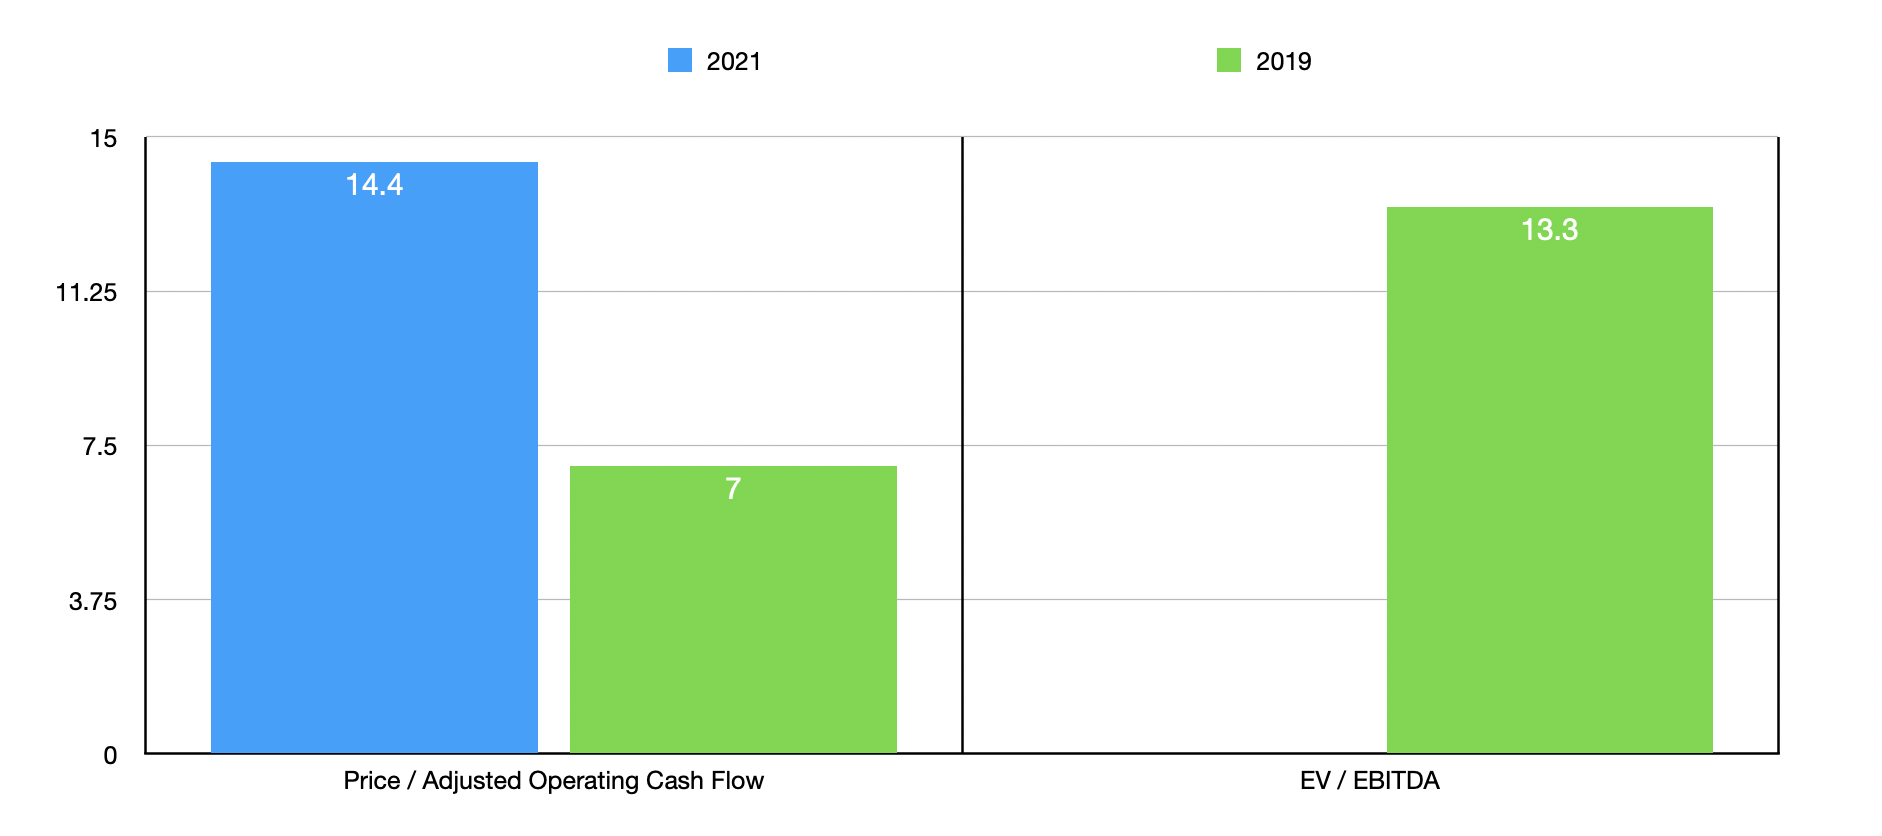
Since we don’t really have any detailed guidance for the current fiscal year, I decided to price the company using results from 2021 and from the pre-pandemic year of 2019. Using the data from 2021, the company is trading at a price to operating cash flow multiple of 14.4. This compares to the 7 reading that we get using data from 2019. Since EBITDA was negative last year, we can’t really assign a multiple on that. But using the data from 2019, the EV to EBITDA multiple would come out then at 13.3. As part of my analysis, I decided to compare the pricing of the company assuming a full recovery to levels seen in 2019 to the pricing of five travel-related businesses. On a price to operating cash flow basis, these companies ranged from a low of 4.4 to a high of 15.1. In this case, three of the five were cheaper than our prospect. Using the EV to EBITDA approach, the range was between 8.3 and 10.9, with Lindblad Expeditions being the most expensive of the group. It should be noted that none of these firms are perfect comparables. Two are specialized accommodations businesses and the others are cruise lines.
| Company | Price / Operating Cash Flow | EV / EBITDA |
| Lindblad Expeditions Holdings | 7.0 | 13.3 |
| GreenTree Hospitality Group (GHG) | 15.1 | 10.5 |
| Bluegreen Vacations Holding Corporation (BVH) | 4.4 | 8.3 |
| Norwegian Cruise Line Holdings (NCLH) | 6.9 | 10.4 |
| Carnival Corporation (CCL) | 6.4 | 8.4 |
| Royal Caribbean Cruises (RCL) | 7.5 | 10.9 |
Takeaway
Truth be told, it’s difficult to know what to expect for the near term. However, I do know that a return to pre-pandemic levels of profitability might make the company fairly attractive. Having said that, there are a couple of things stopping me from rating it a ‘buy’. For starters, current economic conditions are not very conducive to expensive travel. So it is possible the company could see some weakness in its results moving forward. And second, while the company likely will recover, it does have net debt of $388.2 million on its books. A return to the kind of profitability the business experienced in 2019 would push the net leverage ratio of the company to 5.8. But given where things stand today, that is quite a bit of debt to deal with when the company is still negative on an EBITDA basis. So for these two reasons, I have decided to rate the company a ‘hold’ at this time, solely because I think a recovery will occur but that upside potential from here will not be all that impressive.
Be the first to comment