

jetcityimage/iStock Editorial via Getty Images
Investment Thesis
The homebuilding sector is cyclical. Any analysis and valuation of homebuilders should be based on its performance over the cycle. At the same time, in a downtrend part of the cycle, there is potential impairment.
The value of a homebuilder like Lennar Corporation (NYSE:LEN) would then depend on its value over the cycle, adjusted by the impairment. But the size of the impairment would depend on the duration and depth of the downtrend.
On such bases, I estimated that there is no margin of safety at the current market price.
The thrust of my analysis
I am a long-term value investor holding stocks for 8 to 10 years. When I analyze and value stocks, I based them on their long-term performance. The challenge is of course trying to figure the performance of companies over the next decade. That is why I focus on cyclical companies as their histories can provide good clues on their future performances.
The homebuilding sector is a cyclical one. To screen for companies, I looked at how the prices of the top 5 homebuilders have declined since the beginning of the year.
Table 1: Comparative price drop (Author)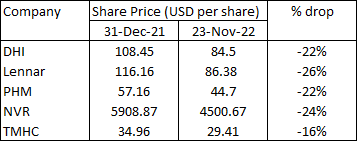
Note to Table 1: These covered the top 5 homebuilders in 2021 as per Builder magazine.
You can see from Table 1 that LEN had the most severe drop since the start of the year.
There is 0.62 correlation between the US Housing Starts and LEN’s revenue from 2006 to 2022. Note that I assumed LEN’s 2022 performance to be based on the Aug 2022 LTM values.
We know that the homebuilding sector is cyclical. We would thus expect LEN performance to follow the Housing Starts cycle as illustrated in Chart 1. I will explain later why LEN’s post-2017 revenue grew faster than the Housing Starts.
Chart 1: LEN Revenue Index vs Housing Starts Index (Author)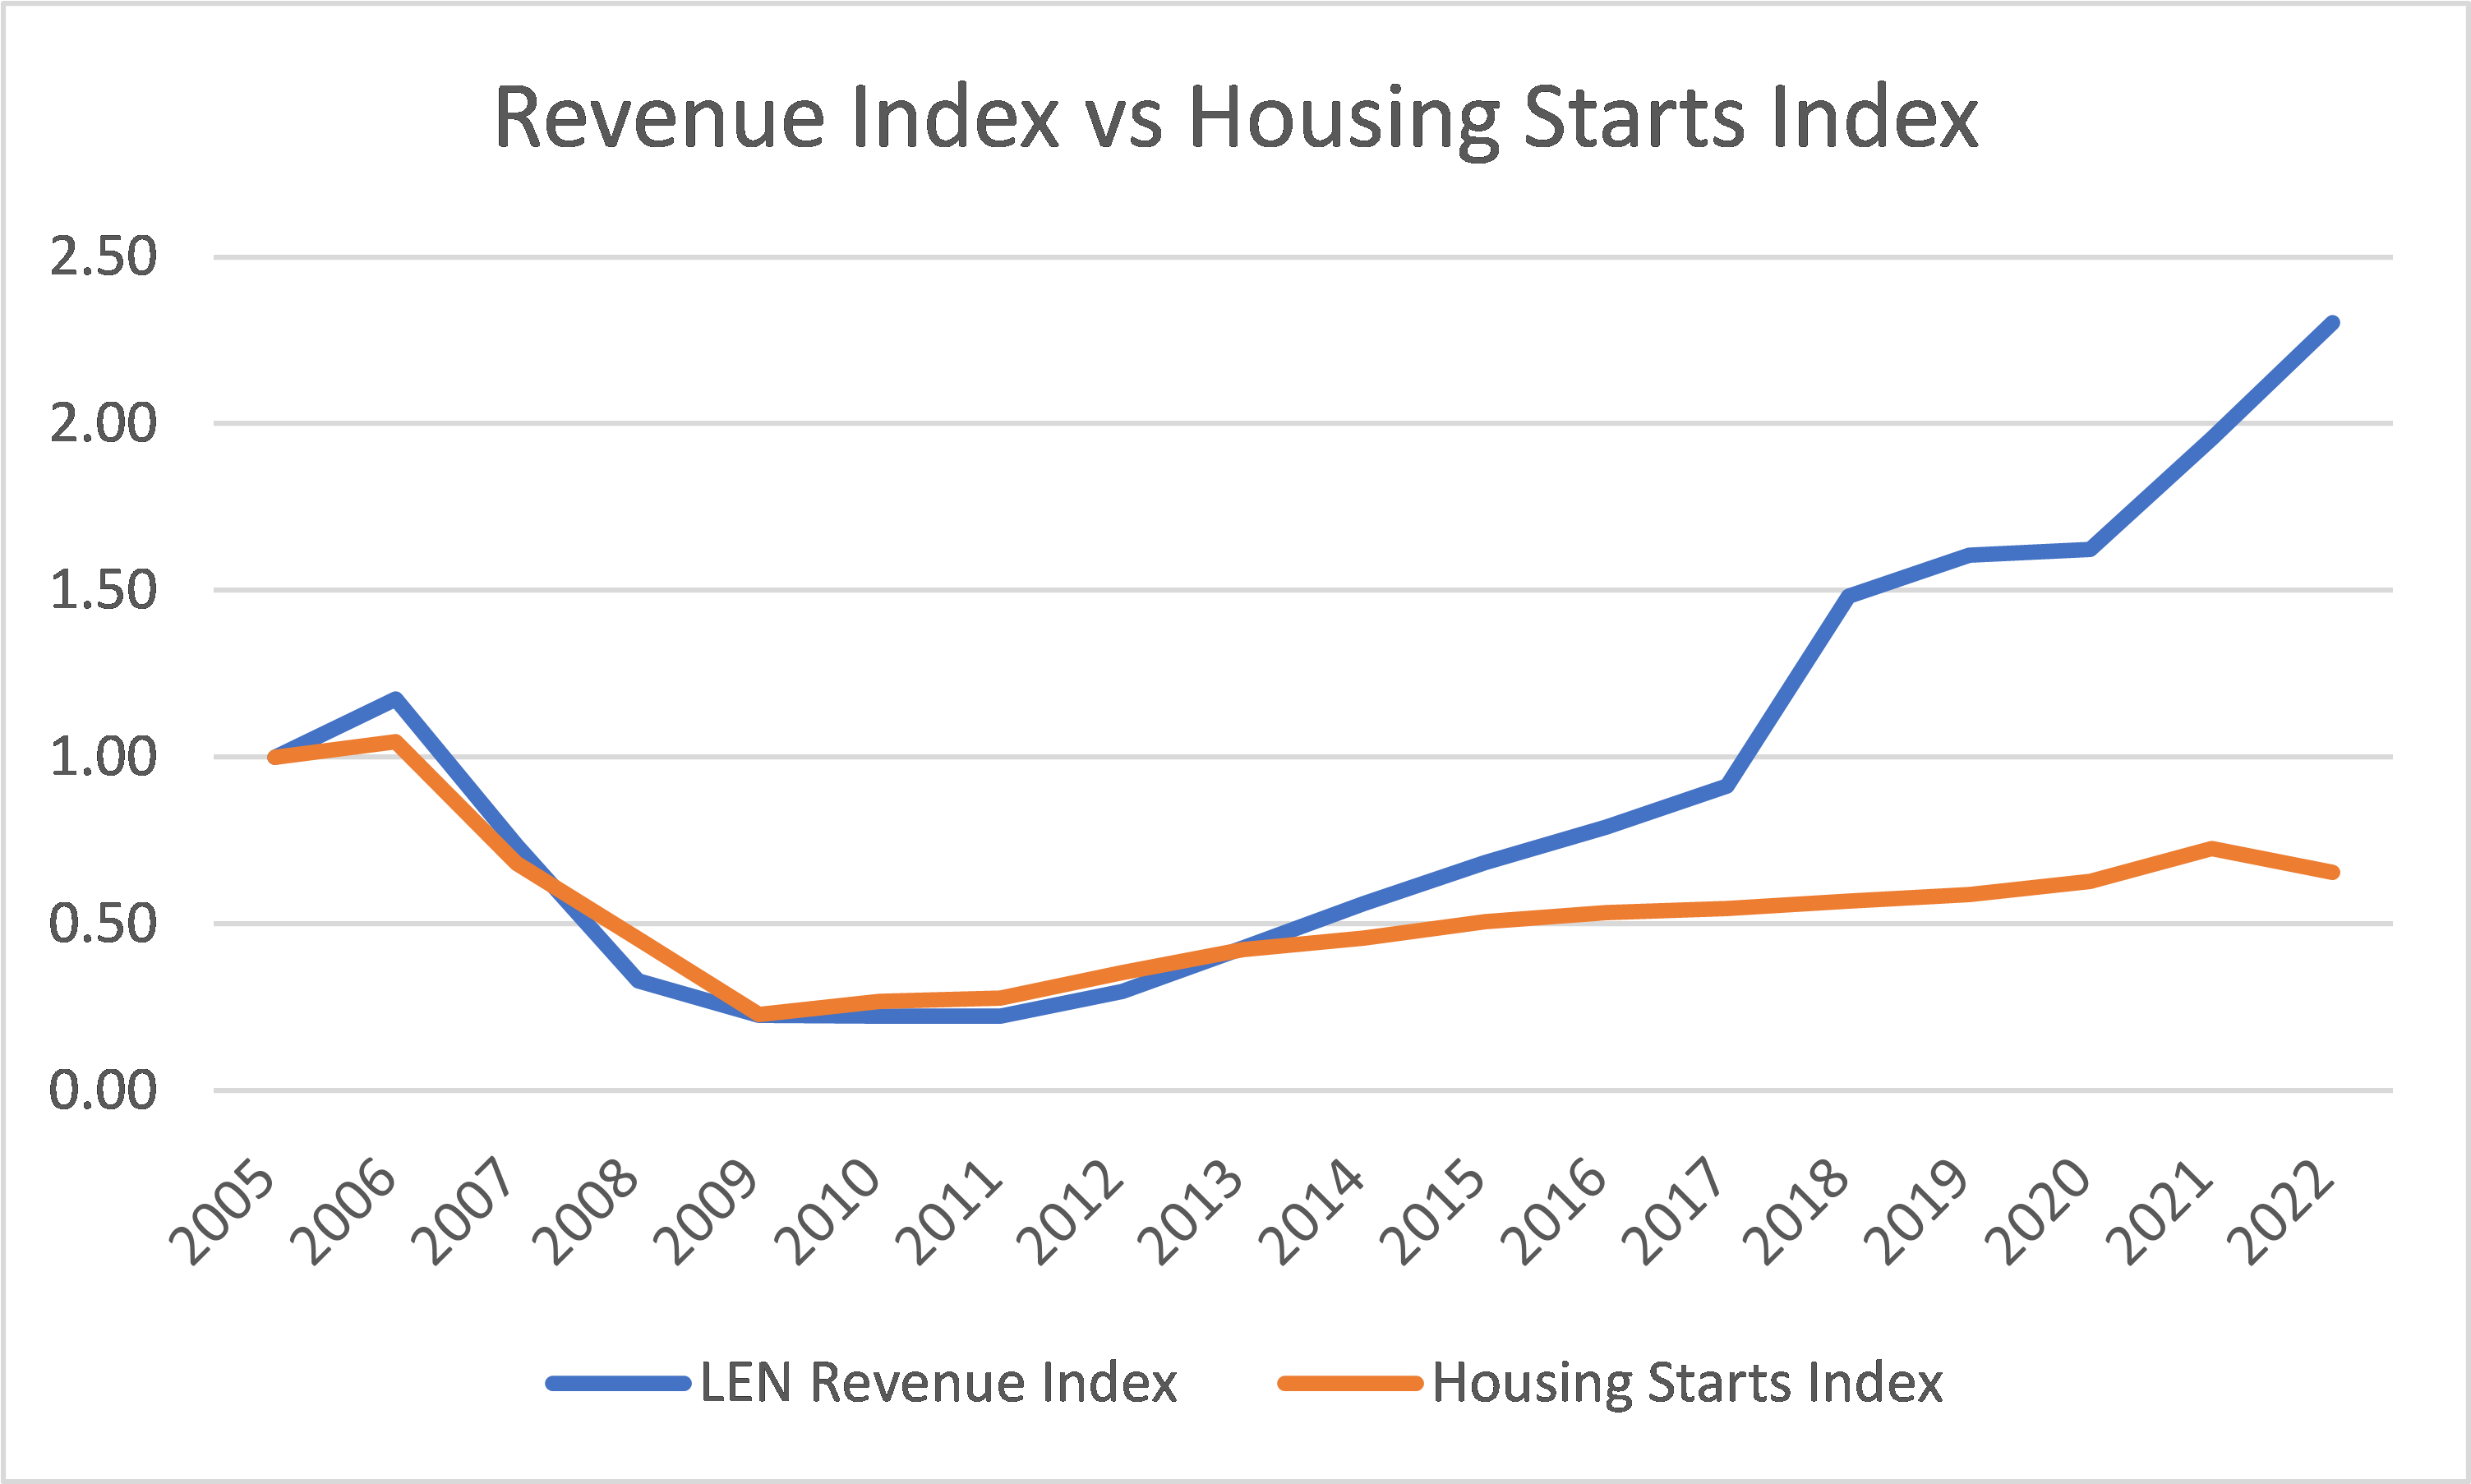
Note to Chart 1: The respective indices were created by dividing the value for the year by the respective base year (2005) values.
There have been many articles on Seeking Alpha about the prospects of the current housing market. I think they miss the point that over the past 70 years, there has not been any growth in the annual average Housing Starts. While there are reasons for growth in the Housing Starts, there are also reasons for headwinds.
In analyzing and valuing LEN we should focus on its performance over the Housing Starts cycle rather than project where it will be over the next few years.
Secondly, I don’t think there is any disagreement about LEN being a fundamentally strong company. Rather the debate is over its valuation. As such, I would focus on valuation.
Company background
In 2021, LEN was the largest homebuilder by net earnings. (Source: LEN Form 10-K)
I believe that one of LEN’s competitive advantages is its investments in technology. This enabled it to provide a good homebuying experience, reduce SGA and stay in front of homebuilding innovation. For example, LEN homes include built-in WiFi and solar power systems. In the digital and green age, these are features that many expect as the norm.
LEN operates as a homebuilder primarily under the Lennar brand in the United States. Its homebuilding operations included the construction and sale of single-family attached and detached homes. LEN primarily serves first-time, move-up, active adult, and luxury homebuyers. It also purchases, develops, and sells residential land.
The Group also offers residential mortgage financing, title insurance, and closing services for home buyers. But this is a small segment as the homebuilding operations accounted for about 94% of the 2021 consolidated revenue.
Among the US homebuilders, LEN occupied the No 2 spot in terms of the 2021 revenue. From 2012 to 2021, LEN revenue grew at a 24 % CAGR. On the other hand, the revenue of the top 225 homebuilders grew at 15 % CAGR. Refer to Chart 2.
Chart 2: Total Housing Residential Revenue of Top 225 Housing Giants (ProBuilder)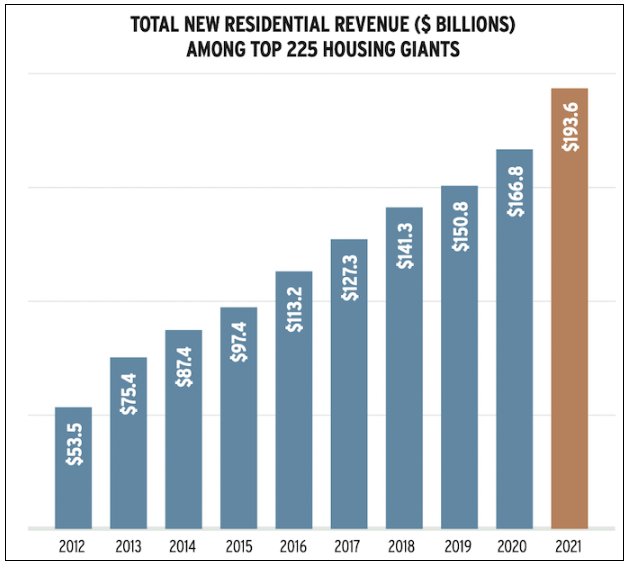
A significant portion of LEN’s growth came via acquisitions. In 2017 and 2018, LEN incurred about USD 1.7 billion in cash acquisitions for WCI Communities, Inc. and CalAtlantic Group, Inc.
To give you a sense of the organic growth, I compared the revenue growth for the period 2018 to 2021 when there were no major acquisitions by LEN. During this period, the top 225 homebuilders’ revenue grew at 11 % CAGR while LEN revenue grew at 10 % CAGR.
To come back to Chart 1, I would argue that LEN’s growth post-2017 was due to acquisitions. If we ignore this, LEN revenue growth cannot be considered exceptional. It is obvious that if we wash-out the inorganic growth post-2017, the correlation between the US Housing Starts and LEN’s revenue would be higher at around 0.8.
No growth cyclical sector
The homebuilding industry is cyclical one where there is no growth in the long-term average annual Housing Starts of about 1.5 million units. Refer to Chart 3.
Chart 3: US Housing Starts (TradingEconomics.com)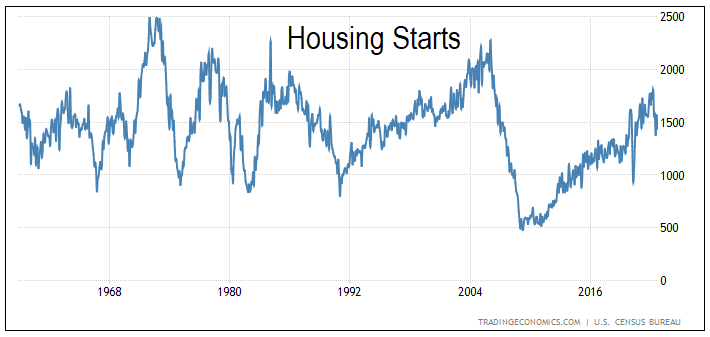
But the Housing Starts were based on physical units. While there is no long-term growth in volume, there was still growth in prices. The House Price Index had increased at a 4.6 % CAGR from 1992 till Aug 2022. But this growth rate is not much different from the US long-term GDP growth rate.
Refer to my article on Meritage Homes for a more detailed discussion on this.
Impairments
The challenge for cyclical companies is that if the downtrend is prolonged, there would be underutilization of assets. At the same time, the value of inventory may fall below the market value. In such situations, there would be an impairment of assets.
During the last Housing Starts downtrend, LEN revenue declined from its 2006 peak of USD 15.6 billion to the 2010 trough of USD 2.8 billion. Within 4 years, LEN revenue reduced by 4/5. This is probably due to the severity and pace of the decline.
During this period, LEN wrote off USD 3.7 billion of assets. This is about 29% of the 2005 total assets. This impairment is not limited to LEN as other homebuilders suffered the same problem as shown in Table 2.
Table 2: Sample of Homebuilders’ Impairments (Author)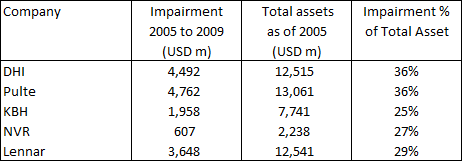
We cannot look at the value of LEN without considering potential impairments. The extent of the impairment would depend on the severity of the downtrend. The challenge then is determining the amount of impairment.
Valuation of cyclical companies
According to Professor Damodaran, the value of a cyclical company is more dependent on a macro variable rather than the firm-specific characteristics. In valuing a cyclical company, we have to “normalize” the performance over the cycle. Damodaran has one suggestion to do this:
In effect, we can average profit margins over time, instead of net profits, and apply the average profit margin to revenues in the most recent period to estimate normalized earnings.
Then challenge for LEN is determining what represents the cycle. There are two challenges here:
- The first is that the current LEN’s operations is post the 2017/18 acquisitions. In other words, there is not enough historical data to determine the cyclical performance.
- The second is the duration of the cycle. As can be seen from Chart 3, the 2006 to 2022 cycle looks different from the earlier cycles.
The 2006 trough is at an annual Housing Starts of 500,000 units whereas the previous troughs were around the 1 million units.
The current 2022 peak of around 1.8 million units was much lower than the historical peaks that went beyond 2 million units. But there were also other historical peaks that were around the 2022 units.
As I do not have a crystal ball, to represent the cyclical performances, I looked at 2 Scenarios. Refer to Table 3. The goal is to take some weighted average of these 2 Scenarios as the most likely one.
Table 3: Valuation Scenarios (Author)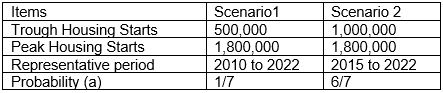
Note to Table 3: (a) I estimated that there were 7 Housing Starts cycle over the past 60 years. Of these, only one cycle had a trough of 500,000 units.
Valuation of LEN
To determine the value of LEN, I first determined the Earnings Value. Thereafter I adjusted the computed values by the potential impairment.
Finally, I derived the expected intrinsic value by multiplying the respective values by the probability.
Based on the above, I estimated the expected intrinsic value of LEN to be USD 74 per share. Compared to the market price of USD 86 per share (28 Nov 2022) there is no margin of safety.
Earnings Value
To estimate the Earnings Value of LEN, I used a single-stage Free Cash Flow to the Firm (FCFF) model of:
Value = FCFF X (1+g) / (WACC – g).
FCFF = EBIT X (1 – tax) X (1 – Reinvestment rate).
EBIT = Revenue X (Gross Profit margin – SGA margin).
To determine the Revenue, I looked at the cyclical Revenue obtained by scaling the 2021 Revenue with (1.595 / 1.5) where 1.595 was the 2021 Housing Starts.
g = growth = Reinvestment rate X Return.
Given g, we can estimate the Reinvestment rate = g / Return.
Return = EBIT X (1 – tax) / Total Capital Employed or TCE.
I estimated the TCE by determining the TCE/Revenue ratio X Projected Revenue.
WACC = weighted average cost of capital obtained from the first page of a Google search of the term “Lennar WACC”. Refer to Table 4.
Table 4: Estimating the WACC (Various )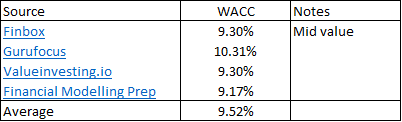
The key variables here are the Gross Profit margin, SGA margin and TCE/revenue. These would vary depending on the Scenarios:
- Scenario 1. Based on the 2010 to 2022 averages.
- Scenario 2. Based on 2015 to 2022 averages.
The values of LEN based on these 2 scenarios are summarized in Table 5 below.
You can see that the value of LEN per share under Scenario 2 is about double that under Scenario 1. The main reasons for this are the reduction in the SGA margin and the TCE/Revenue ratio. In other words, the Group was assumed to be more efficient under Scenario 2.
Table 5: Computing the Earnings Value (Author)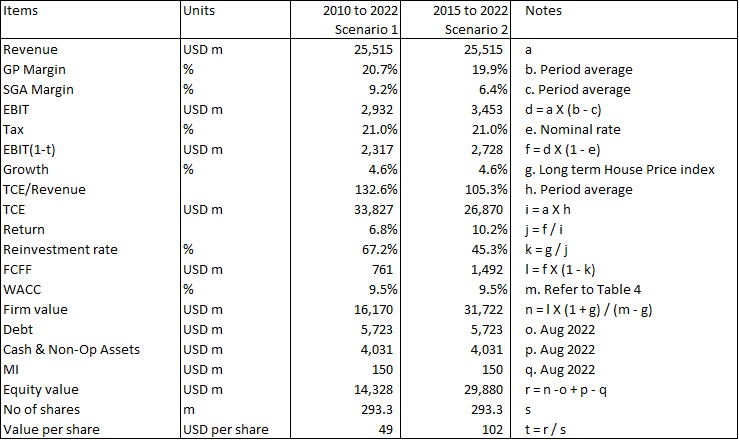
Notes to Table 5:
- Data for the Table was taken from TIKR.com platform.
- Item p – Cash and Non-Op Assets. These included the investments in unconsolidated entities.
Impairments
I assumed the following for the impairments:
- Scenario 1 – assumed the worst case following the 2005 to 2009 actual of 29%.
- Scenario 2 – since the bottom is only half of Scenario 1, I assumed that the impairment rate would be half at 15%.
Table 6, summarizes the impairments and the post-impairment value of LEN under both Scenarios.
Table 6: Estimating the impairments (Author)
Expected intrinsic value.
The expected intrinsic value of LEN
= probability weighted average value.
= (14 X 1/7) + (84 X 6/7).
= USD 74 per share.
The market price of LEN as of 28 Nov 2022 was USD 86 per share. In my opinion, there is no margin of safety.
Sensitivity analysis
In estimating the Earnings Value, I have made assumptions about the cash flows and discount rate.
The cash flows are very conservative as I took the peak Housing Starts as 1.8 million. If the peak was higher, there would be more favourable Gross Profit margin and SGA margin.
As can be seen from Chart 4, there have been improvements in the Gross Profit margins and a reduction in the SGA margins over the past few years. A higher peak Housing Starts would mean that the trends in the Gross Profit margin and SGA margin would continue for a few more years. If I factor in these changes, we would have a higher Earnings Value.
Chart 4: GP margin and SGA margin trends (Author)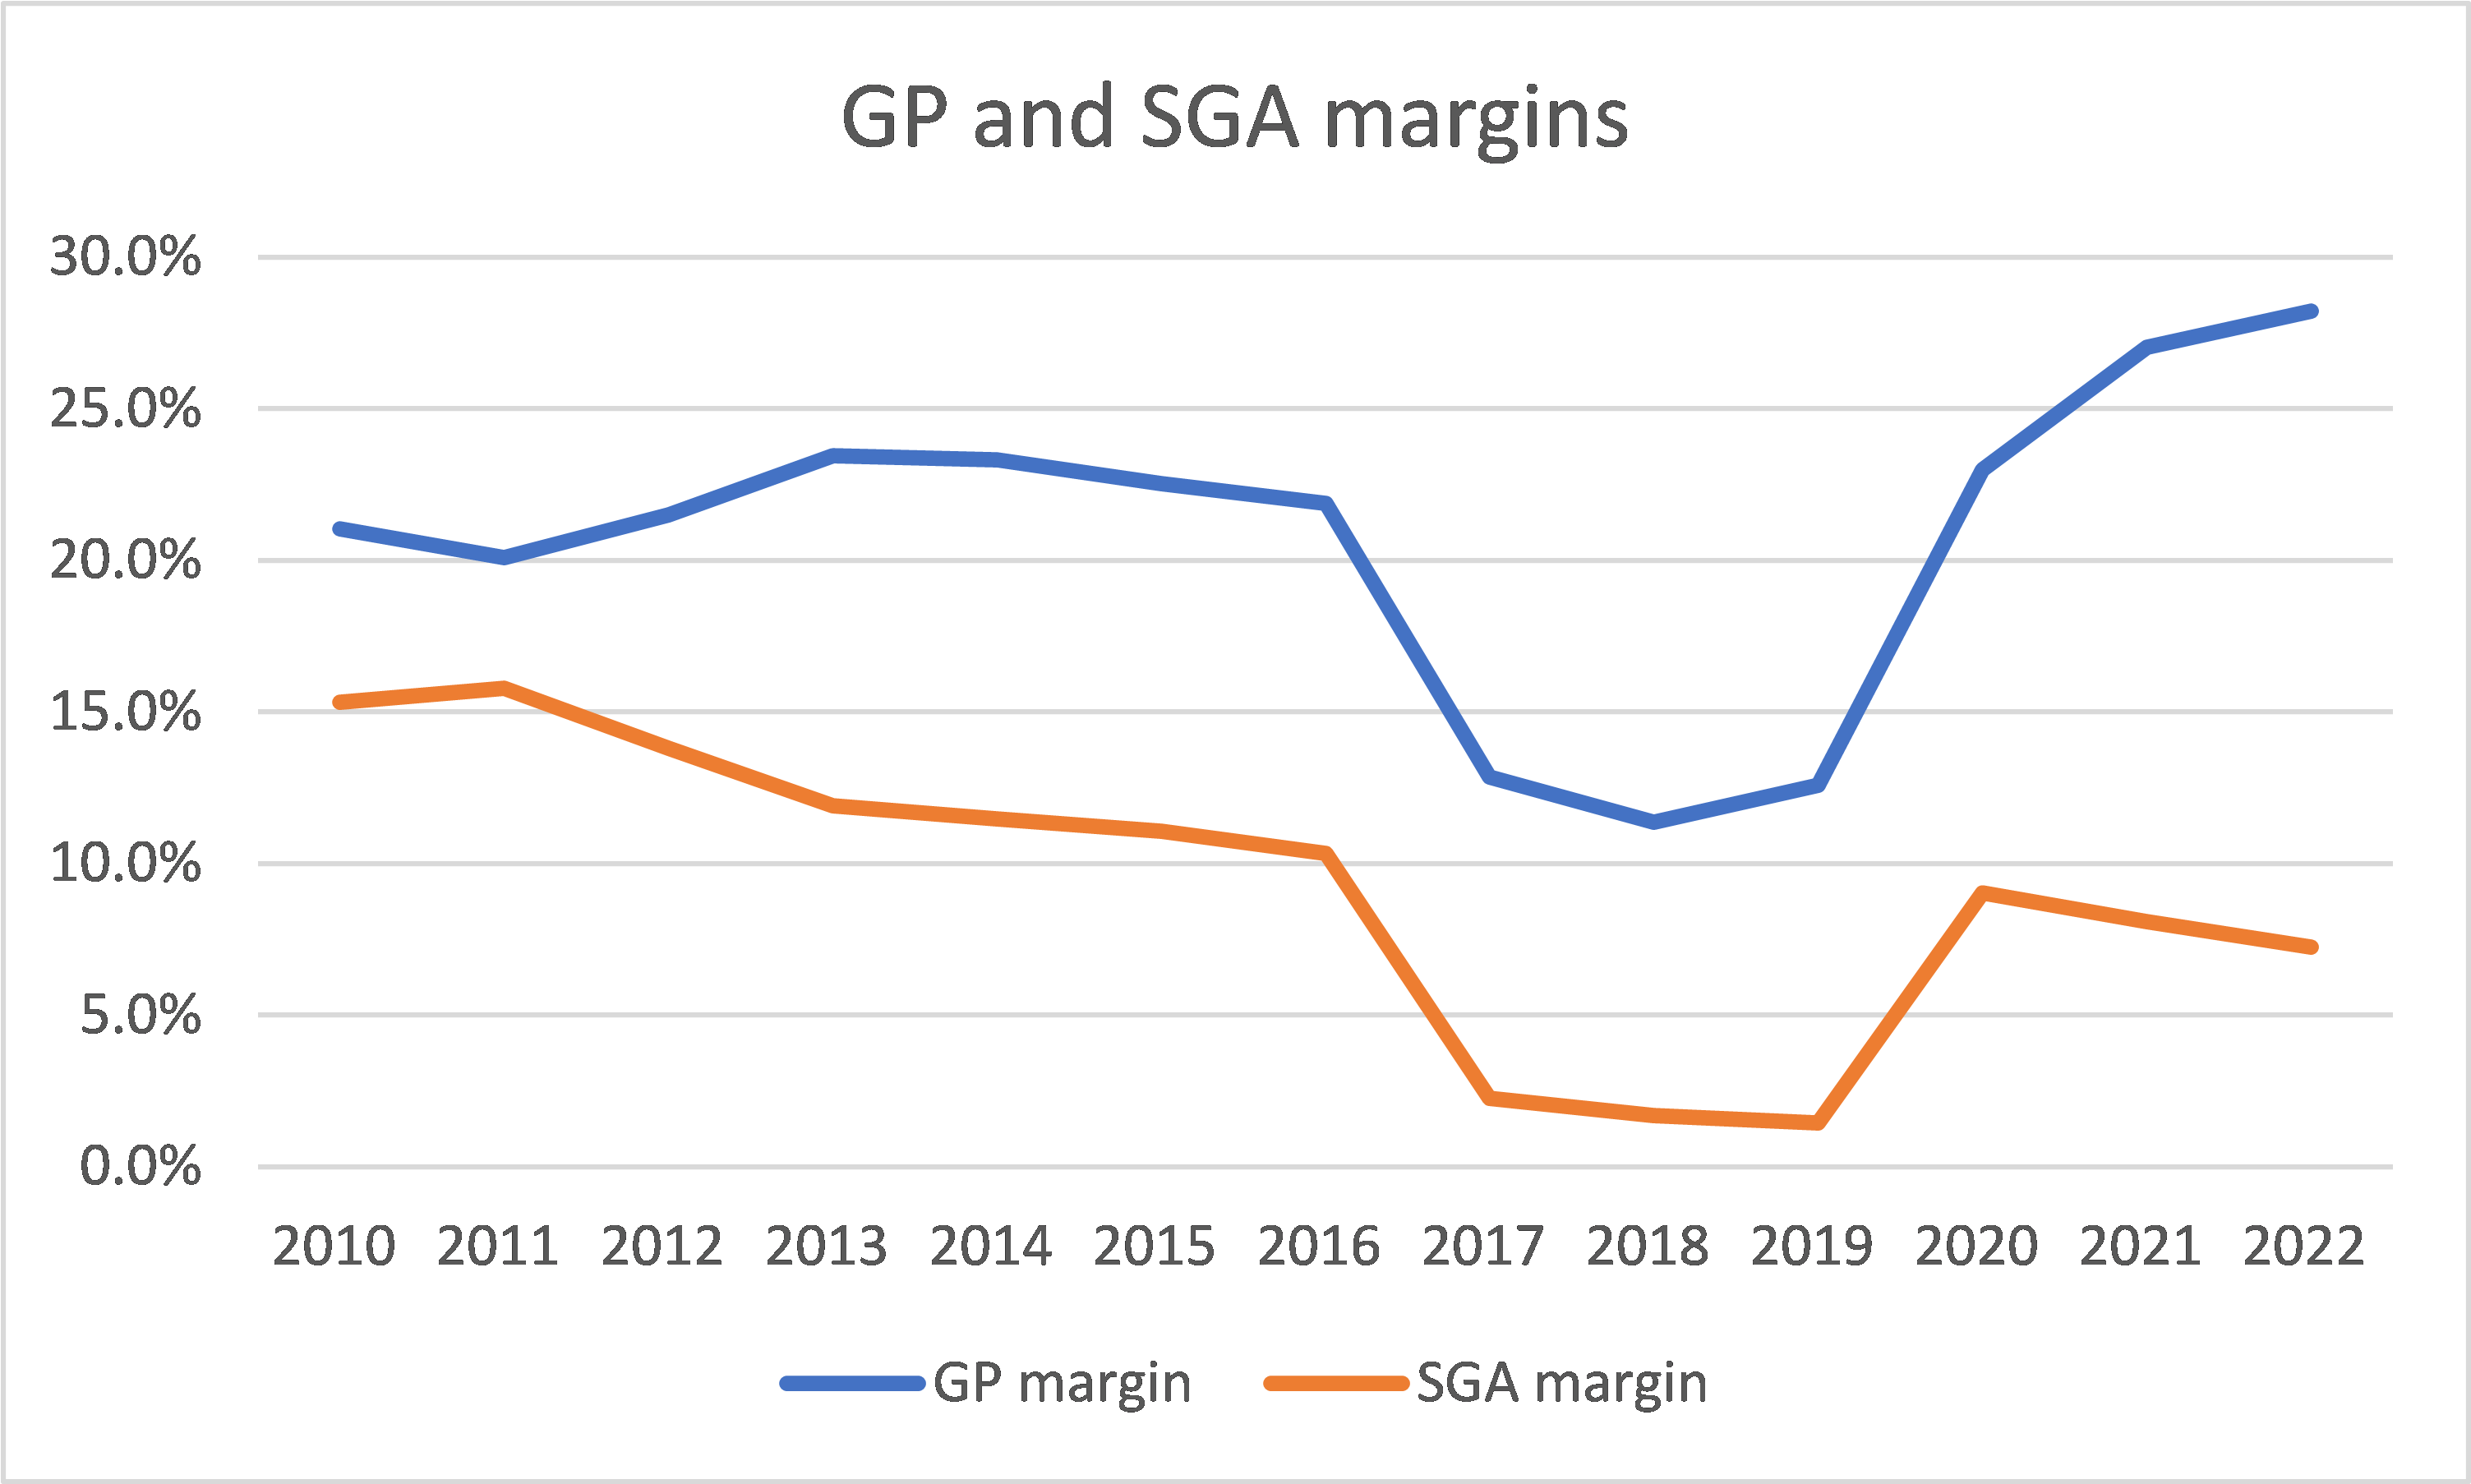
At the same time, the WACC was assumed to be 9.5 %. In deriving these, many of the sources used the current risk-free rate. For consistency, since I am l using different periods for each of the Scenarios, I should also l use the WACC over similar periods.
As can be seen from Chart 5, the average risk-free rate for the Scenario periods would be lower than the current rate. At the same time, instead of using the current risk premium, we should also use the risk premium over the cycle.
My point is that the WACC used is probably on the high side. If I factor this in, the Earnings Value would be higher.
Chart 5: 10 years Treasury Yield (MacroTrends)
Conclusion
I had selected LEN from the top 5 homebuilders as its share price had declined the most since the beginning of the year. I thought that this would provide a good margin of safety. But an intrinsic value comparison showed that this was not the case.
The thrust of my valuation model is that the value of LEN should be based on its performance over the cycle. The challenge then is determining the amount to represent the cyclical values.
This is because LEN is a different entity today compared to the pre-2017 periods due to the acquisitions. At the same time, there is uncertainty on the duration and the peak-to-trough values of the cycle.
What are used will impact the values we use in the valuation metrics. At the same time, I would argue that we cannot rule out impairments if the downtrend is severe.
To overcome these issues, I considered 2 Scenarios to derive the cyclical values as well as the potential impairments. I then estimated the expected intrinsic value by factoring the probability of the Scenarios.
My fair value model implies that there is no margin of safety at the current market price.
All valuation is based on peering into the future. I hope I have provided one perspective for taking all the above uncertainty into account when valuing LEN.
While we can debate about the values to use as inputs for the valuation model, I don’t think that there should be any debate about looking at the value over the cycle.
Be the first to comment