

Tryaging/iStock via Getty Images
A Quick Take On LeeWay Services
LeeWay Services (LWS) has filed to raise $18.3 million in an IPO of its common stock, according to an S-1 registration statement.
The firm provides freight brokerage and related financing services in the United States.
The freight transportation business has been robust but faces potential contraction ahead as the U.S. remains at risk of a recession.
I’ll provide a final opinion when we learn more information about the IPO.
LeeWay Overview
Salt Lake City, Utah-based LeeWay was founded to offer a variety of freight brokerage services in the U.S. and has expanded into e-commerce capabilities.
Management is headed by CEO and President S. Whitfield Lee, who has been with the firm since inception of WLP in 1984. and has started a number of companies in various industry segments.
The company’s primary offerings include:
-
Freight brokerage
-
Dedicated contract carriage
-
Transportation management
-
Financing platform
LeeWay has booked fair market value investment of $3.3 million in debt as of March 31, 2022, from investors including W.L.P. Corporation.
LeeWay – Customer Acquisition
The company seeks customers among all sizes of business wanting the best pricing and execution for their freight needs.
LeeWay also began its specialty financing business in 2019 aimed at small and medium-sized businesses.
This business, when combined with its freight brokerage capabilities, enables the company to provide a one-stop source for ecommerce sellers.
Sales and Marketing expenses as a percentage of total revenue have dropped as revenues have increased, as the figures below indicate:
|
Sales and Marketing |
Expenses vs. Revenue |
|
Period |
Percentage |
|
Three Mos. Ended March 31, 2022 |
0.7% |
|
2021 |
1.7% |
|
2020 |
1.9% |
(Source)
The Sales and Marketing efficiency multiple, defined as how many dollars of additional new revenue are generated by each dollar of Sales and Marketing spend, rose to 88.9x in the most recent reporting period, as shown in the table below:
|
Sales and Marketing |
Efficiency Rate |
|
Period |
Multiple |
|
Three Mos. Ended March 31, 2022 |
88.9 |
|
2021 |
29.5 |
(Source – SEC)
LeeWay’s Market & Competition
According to a 2019 market research report by Grand View Research, the global market for road haulage was an estimated $2.8 trillion in 2019 and is expected to exceed $4 trillion by 2025.
This represents a forecast CAGR of 5.5% from 2019 to 2025.
The main drivers for this expected growth are growing need for good transportation due to the growth of the e-commerce industry and improved technologies resulting in more reliable vehicles, better fleet management and lower operating costs.
Also, the U.S. road haulage market breakdown by type is pictured below:
U.S. Road Haulage Market (Grand View Research)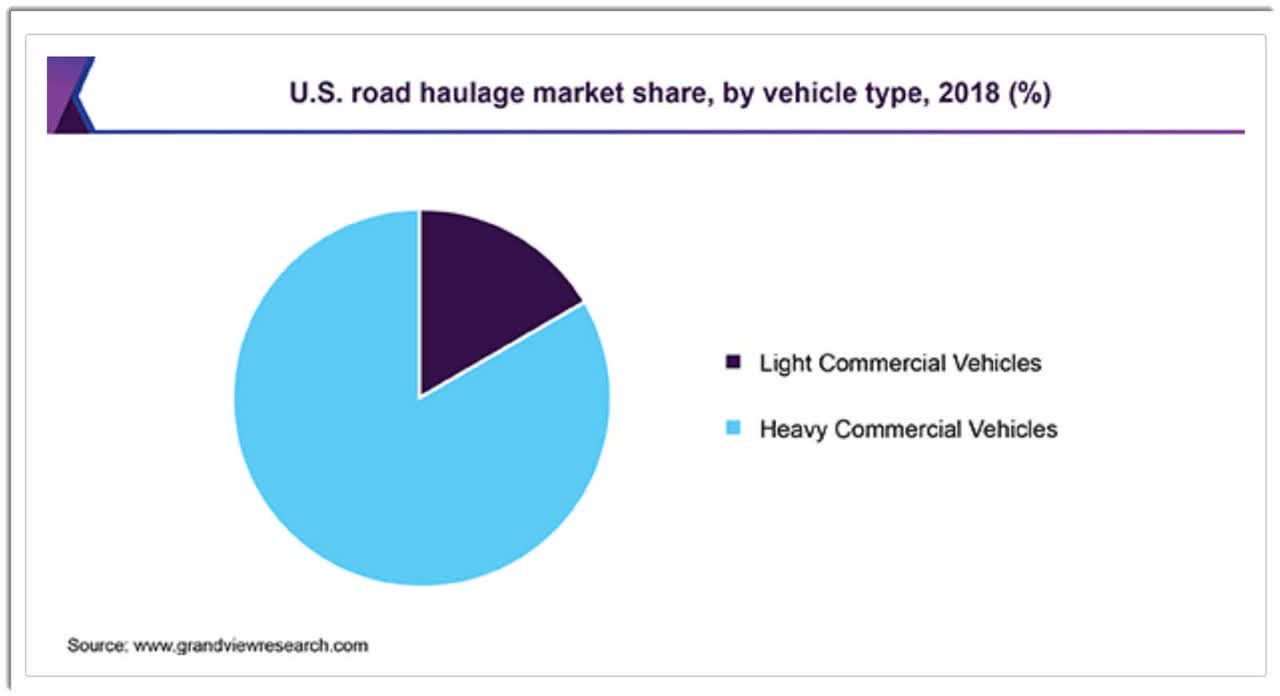
Major competitive or other industry participants include:
-
XPO Logistics
-
C.H. Robinson
-
Uber Freight
-
Transfix
-
Other freight brokerages and financial services companies
LeeWay Services Financial Performance
The company’s recent financial results can be summarized as follows:
-
Sharply growing topline revenue
-
Increasing gross profit and gross margin
-
Higher operating profit
-
Growing cash flow from operations
Below are relevant financial results derived from the firm’s registration statement:
|
Total Revenue |
||
|
Period |
Total Revenue |
% Variance vs. Prior |
|
Three Mos. Ended March 31, 2022 |
$ 12,233,724 |
166.6% |
|
2021 |
$ 27,897,504 |
100.5% |
|
2020 |
$ 13,911,540 |
|
|
Gross Profit (Loss) |
||
|
Period |
Gross Profit (Loss) |
% Variance vs. Prior |
|
Three Mos. Ended March 31, 2022 |
$ 2,528,247 |
284.4% |
|
2021 |
$ 4,372,235 |
115.1% |
|
2020 |
$ 2,032,591 |
|
|
Gross Margin |
||
|
Period |
Gross Margin |
|
|
Three Mos. Ended March 31, 2022 |
20.67% |
|
|
2021 |
15.67% |
|
|
2020 |
14.61% |
|
|
Operating Profit (Loss) |
||
|
Period |
Operating Profit (Loss) |
Operating Margin |
|
Three Mos. Ended March 31, 2022 |
$ 900,385 |
7.4% |
|
2021 |
$ 1,141,432 |
4.1% |
|
2020 |
$ 139,804 |
1.0% |
|
Net Income (Loss) |
||
|
Period |
Net Income (Loss) |
Net Margin |
|
Three Mos. Ended March 31, 2022 |
$ 900,385 |
7.4% |
|
2021 |
$ 957,421 |
7.8% |
|
2020 |
$ 58,578 |
0.5% |
|
Cash Flow From Operations |
||
|
Period |
Cash Flow From Operations |
|
|
Three Mos. Ended March 31, 2022 |
$ 167,494 |
|
|
2021 |
$ 190,880 |
|
|
2020 |
$ (907,844) |
|
(Source – SEC)
As of March 31, 2022, LeeWay had $36,322 in cash and $8.8 million in total liabilities.
Free cash flow during the twelve months ended March 31, 2022, was negative ($7,370).
LeeWay Services IPO Details
LeeWay intends to raise $18.3 million in gross proceeds from an IPO of its common stock, although the final figure may differ.
No existing shareholders have indicated an interest to purchase shares at the IPO price.
Management says it will use the net proceeds from the IPO as follows:
for proprietary technology development, acquisitions, general corporate and working capital purposes.
(Source – SEC)
Management’s presentation of the company roadshow is not available.
Regarding outstanding legal proceedings, management says the firm is not a party to any legal proceedings that would have a material adverse effect on its financial condition or operations.
The sole listed bookrunner of the IPO is ThinkEquity.
Commentary About LeeWay’s IPO
LWS is seeking to go public to fund its general unspecified corporate growth plans.
The firm’s financials have shown strong growth in topline revenue, higher gross profit and gross margin, increasing operating profit and growing cash flow from operations.
Free cash flow for the twelve months ended March 31, 2022, was negative ($7,370).
Sales and Marketing expenses as a percentage of total revenue have dropped as revenue has increased sharply and its Sales and Marketing efficiency multiple rose to 88.9x in the most recent reporting period.
The firm currently plans to pay no dividends on its shares and anticipates that it will use any earnings in the foreseeable future to reinvest back into its business expansion efforts.
LWS’s CapEx Ratio is a low 0.99x, which indicates it is spending heavily on capital expenditures as a percentage of its operating cash flow.
The market opportunity for providing freight brokerage and related services in the U.S. is large but expected to grow moderately in the coming years and features significant, fragmented competition.
ThinkEquity is the sole underwriter, and IPOs led by the firm over the last 12-month period have generated an average return of negative (64.1%) since their IPO. This is a bottom-tier performance for all major underwriters during the period.
The primary risk to the company’s outlook is high inflation putting a damper on freight volume growth as the U.S. is at risk of entering a recession in the quarters ahead.
When we learn more about the firm’s IPO valuation assumptions, I’ll provide a final opinion.
Expected IPO Pricing Date: To be announced.
Be the first to comment