

Jeff Swensen/Getty Images Entertainment
La-Z-Boy Incorporated (NYSE:LZB) is a global leader in the furniture industry. Their recliners are coveted for their quality and comfort by millions across the U.S. Over the past two years, the company has experienced record demand for their furniture as consumers have prioritized their discretionary purchases on housing-related acquisitions. Rapidly increasing interest rates, however, has instilled fear into investors regarding the sustainability of future economic growth. These concerns have hit housing and their subsidiary sectors quite hard.
Despite the concerns, the housing market will retain its underlying strength. The lack of supply in housing will continue to support prices even if demand recedes, and this will preserve household net worth at record levels. The perceived wealth-effect will in-turn support continued discretionary spending, which has yet to be materially curtailed despite the current inflationary environment.
LZB is down nearly 10% over the past month and is currently trading near their lows. Based on the company’s fundamentals and the favorable long-term housing trends, the share price decline appears overdone. The company’s strong balance sheet that includes a significant balance of cash and limited liabilities is armor against any downturn should one occur. At current pricing, investors shouldn’t fall asleep on this recliner stock that is nearly 70% undervalued.
Business
LZB is a leading global producer of reclining chairs and the second largest residential furniture company in the United States. Tradenames included within the company’s umbrella include La-Z-Boy, England, Kincaid, and Joybird.
At the end of the full 2021 fiscal year, which ended April 24, 2021, the company operated in two segments: Wholesale and Retail. The Wholesale Segment involves the manufacturing and imports of upholstered furniture, which is then sold directly to La-Z-Boy Furniture Galleries and a wide variety of independent retailers. The Retail Segment, on the other hand, is primarily involved in the sale of upholstered furniture directly to the end consumer through the company’s La-Z-Boy Furniture Galleries stores.
In the 2021 fiscal year, LZB reported +$1.7B in total consolidated sales, with 75% of total sales attributable to the wholesale segment.
Segment Revenue Disaggregation – Form 10-K
From a geographical perspective, over 90% of total sales are attributable to the United States and 5% is attributable to Canada.
Geographical Breakout – Form 10-K
Regarding raw materials, the primary components used for manufacturing are purchased fabrics and leather, polyester batting, and polyurethane foam, among other materials. The company purchases about 40% of their polyurethane foam from one supplier, which has several facilities across the United States that deliver to their plants. LZB purchases their fabrics and leather from a variety of sources, but they rely on a limited number of major suppliers. Of the products that the company imports, three suppliers that operate in China and one in Vietnam manufacture over 95% of the leather cut-and-sewn sets, and three suppliers that also operate in China manufacture approximately 90% of the fabric products.
Demand for the company’s furniture is reflective of overall economic conditions and consumer sentiment, among other factors. In addition, demand behavior is typically seasonal, with volumes in the wholesale business strongest in the fourth quarter and their retail and e-commerce segments strongest in the third quarter. Additionally, during the summer months, the furniture industry typically experiences the weakest demand during the fiscal year. LZB takes advantage of this downtime to shut their plant facilities for one week to conduct routine maintenance on their equipment.
Sales volume and production did not follow typical trends in fiscal 2021 due to the impacts of COVID. Due to the shutdowns, the company experienced significant decline in sales which continued through the first quarter of fiscal 2021. After their retail locations and manufacturing facilities reopened by the end of the first quarter, they have continued to see an increase in demand as consumers continue to prioritize their discretionary spending on their homes.
Competition
Though LZB is the second largest residential furniture company in the U.S., alternative distribution channels have increasingly affected their retail markets. The rise of the direct-to-consumer and E-commerce models, for example, has made it easier for consumers to purchase furniture. This has expanded the competitive landscape to include companies such as Amazon and Wayfair. While LZB’s Joybird business sells almost exclusively online, their size and scale are a disadvantage when compared against their two larger peers.
In the wholesale segment, LZB’s largest competitors are Ashley, Bernhardt, and Best Chair, among others. In the retail segment, competitors include Ethan Allen, Bob’s Discount Furniture, and Bassett Furniture, among others. In addition to these well-known companies, LZB also competes against a substantial number of small and medium-sized companies that operate under private label brands.
Below are the market caps of several publicly traded competitors, available from the Seeking Alpha Peer Comparison Tool. Of the competitors listed, LZB is the largest overall and the only company with a market cap of over +$1B and over 5,000 employees.
Seeking Alpha Peer Comparison Tool – Market Cap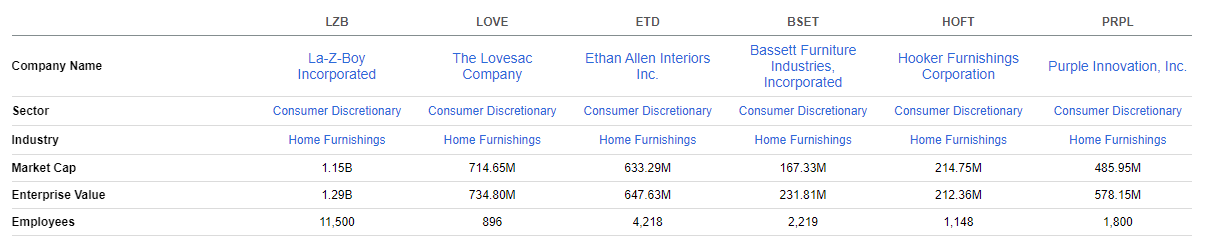
LZB has lagged their peers over the past three months. While most are down by double digits, LZB is down nearly 26%, which is unreasonably worse than Hooker Furnishings (HOFT). Though their performance has been better than Purple Innovation (PRPL), it is significantly worse than both Bassett (BSET), who is up 11%, and Ethan Allen (ETD), who is down only 4%.
YCharts – 3-Mth Total Returns of LZB And Their Competitors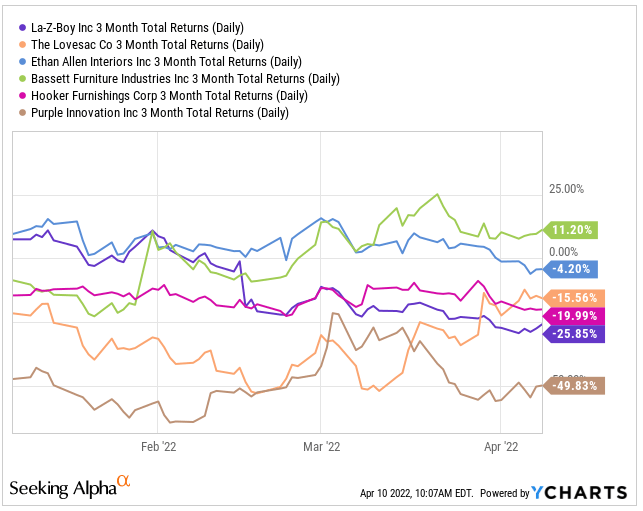
Over the past ten years, LZB has historically underperformed when compared against BSET, but the performance gap has been much narrower. Additionally, the company has also consistently outperformed HOFT. The current underperformance, therefore, seems overdone.
YCharts – 10-Yr Total Returns of LZB And Their Competitors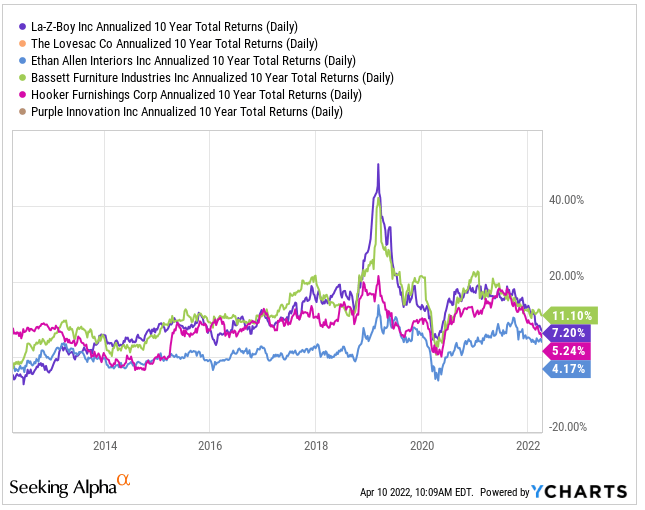
On valuation, LZB appears to be trading at a discount to HOFT and on-par with BSET. The forward pricing multiple, for example, is about 9x, which is lower than the 12.75x for HOFT and just above the 8.15x for BSET.
When compared against their own historical averages, however, shares do appear undervalued. The current price-to-book ratio for LZB, for example, is 1.49x versus a historical five-year average of 2.18x
Seeking Alpha Peer Comparison Tool – Valuation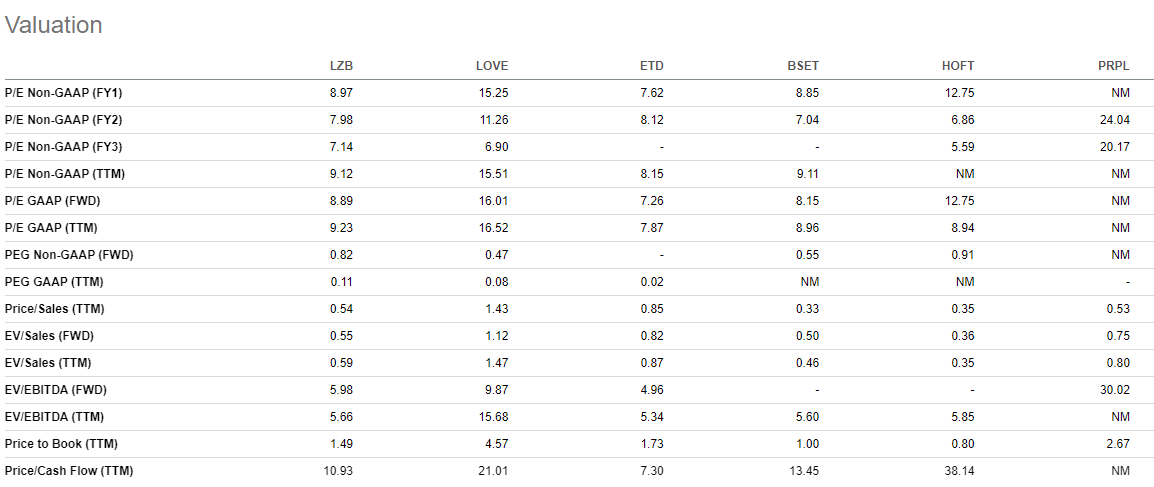
On revenue growth, LZB appears to be outperforming most of their peers, except for LOVE, who is reporting very strong growth over every time frame listed. LZB’s performance against PRPL is mixed, with growth stronger in the current year and on a forward basis but lower on a 3-5-year timeframe. Importantly, LZB is strongly outperforming both BSET and HOFT.
Seeking Alpha Peer Comparison Tool – Revenue Growth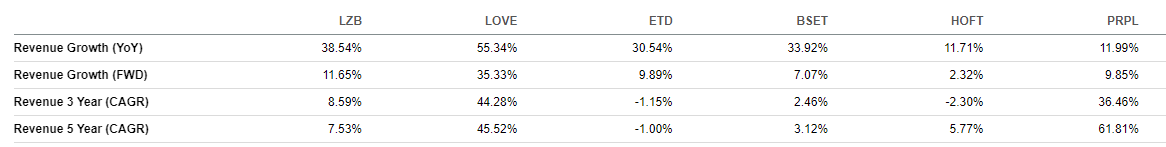
The furniture industry is intensely competitive with low barriers to entry. IKEA, who is the largest furniture company in the world, is privately held, yet the most significant competitor to LZB. In addition, Amazon and Wayfair also pose significant competitive threats to the company.
On a smaller scale, LZB does appear to perform strongly against their peers on revenue growth, but their share price performance is currently lagging, and they appear undervalued based on historical averages. For more definitive insight, a deeper dive into the company’s fundamentals is necessary.
Earnings & Outlook
LZB operates on a fiscal year that ends at the end of April. The quarter of their most recent earnings release, therefore, is quarter three, fiscal year 2022. For the quarter, LZB reported total sales that were up 22% from the prior year. Gross profit and operating margins, however, were both down. The decrease in margins were due to factory shutdowns in Vietnam that led to higher raw material and freight costs.
For the nine months ending in the third quarter, sales were up nearly 40% and operating margins were up 60 basis points as well. At the current rate of sales, the company is expected to end the year with over +$2.0B in sales, which would be about 30% higher than the prior fiscal year. While availability of materials and input cost inflation continues to disrupt operations, the company has been able to partially offset these negative externalities with price increases. Thus far, consumers have not scaled back demand despite the increases.
Q3FY22 Quarterly Results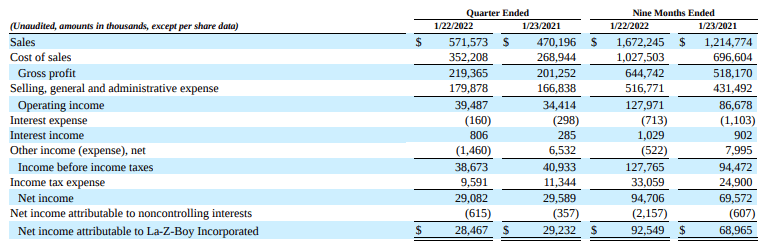
So far this fiscal year, the company has repurchased +$76M in shares, which would be a record. In addition, the dividend is now higher than pre-2020 levels. In the early months of the pandemic, the company took steps to preserve liquidity, one of which was the elimination of the dividend. Given the financial position of the company, which will be discussed below, the decision to eliminate the dividend was likely overdone.
The Fundamentals
Author’s Assessment of Strength of Fundamentals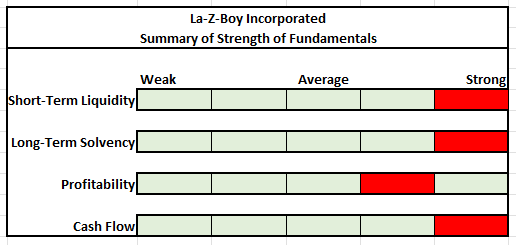
At the end of Q3FY22, LZB had +$962M in total current assets and +$713M in total current liabilities. Inventory and A/R, together, accounted for about 50% of total current assets, while cash on hand accounted for 25% of the total. Inventories are up significantly on increased purchases and higher raw material costs. Since A/R and inventory account for such a large portion of the total, it’s critical for the company to be able quickly convert these line items to cash via sales and collection.
Partial Balance Sheet – Form 10-K Partial Balance Sheet – Form 10-K

The results of seven short-term liquidity ratios for the full fiscal years prior to the current year provides confirmation of the company’s ability to effectively manage their working capital. The current ratio is comfortably above 1x, and the quick ratio is also adequate. While there was a decrease in FY21, this is not a concern since turnover times generally remained on par with historical averages.
Author’s Calculations of Various Short-Term Liquidity Ratios
On average, it takes between 65-75 days for LZB to sell inventory. They are then able to collect on that sale within 30 days. During the 100 days that cash conversion is pending, the company holds off payment to their suppliers for 26 days. Thus, in 2021, there were 74 days in which the company had to either tap into existing cash on hand, which is about 70 days of sales, or other longer-term arrangements to fund their current working capital needs. This suggests effective working capital management by the company.
Author’s Calculations of Other Days of Required Financing
Most of LZB’s liabilities are short-term in nature. As can be seen in the solvency ratios below, the company doesn’t utilize long-term debt. As such, there are no concerns regarding their future viability as a business.
Prior to fiscal 2020, operating leases were not considered liabilities for GAAP financial reporting purposes. Instead, they were treated as reoccurring operating expenses. A subsequent rule change, however, required all companies to reclassify their operating leases as liabilities. LZB adopted this rule in the first quarter of fiscal 2020, which resulted in nearly +$300M in liabilities added to the balance sheet. The impact of this change could be seen in the long-term liability ratios. Despite the increases, LZB’s leverage is still low, and their ability to satisfy their obligations is still strong, given their sizeable balance of cash and their consistent ability to maintain profitability and generate positive cash flows.
Author’s Calculations of Various Long-Term Solvency Ratios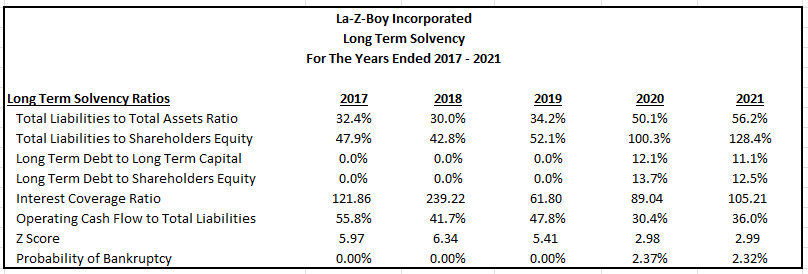
While total revenue growth in fiscal 2020 and 2021 were both below historical averages, results are skewed due to the impacts of COVID and the timing of their fiscal periods. Remember that the company operates on an April fiscal year. In fiscal 2021, therefore, results would have reflected many months of severely curtailed operations. On the flip side, the recovery is evidenced in the current fiscal year, where sales are already up significantly and are expected to be 30% greater than in 2021.
Despite rising input costs and supply-related constraints, the company has been able to offset the increases with higher selling prices that have not yet met resistance from consumers. Margins have remained up and were at historically high levels in fiscal 2021. They have since declined in the current year but are expected to return to more normalized levels in fiscal 2023.
Author’s Calculations of Historical Profitability Margins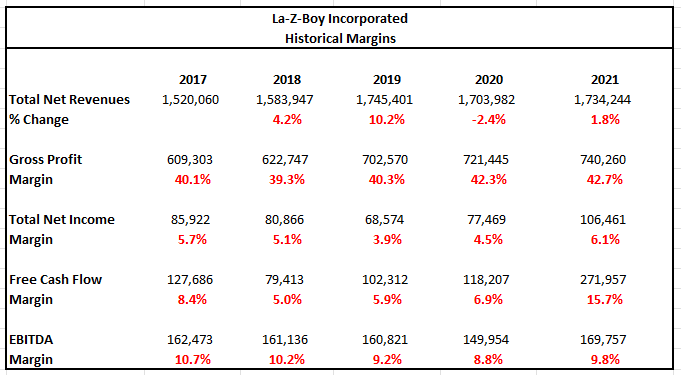
Compared to competitors, LZB’s performance is mixed in the current fiscal year. Gross profit is higher or on par with some peers, but significantly lower than the margins reported by LOVE and ETD. On the other hand, their EBITDA margins are stronger than all peers except ETD.
Seeking Alpha Peer Comparison Tool – Profitability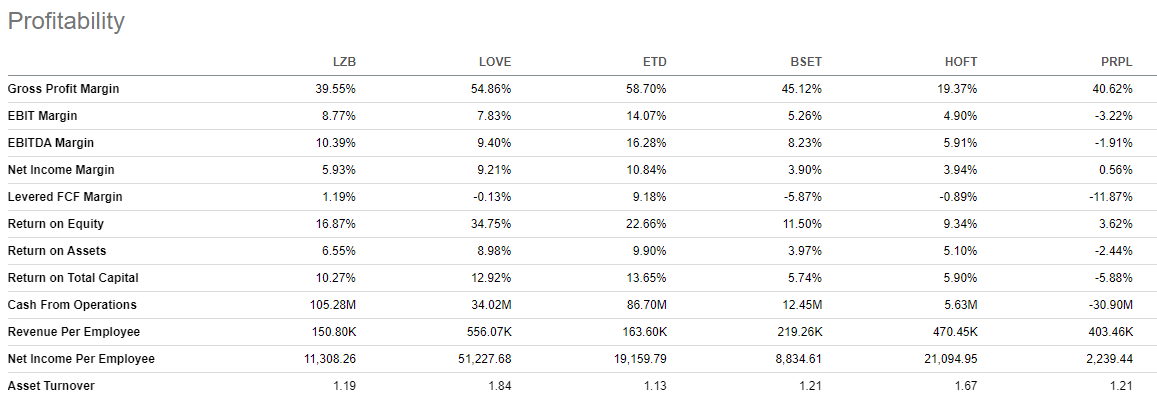
The summary below was obtained from the data within the cash flow statement. As can be seen, the company is generating very strong FCFs, despite the challenging operating environment.
In the 2021 fiscal year, LZB returned +$61.0M to shareholders in the form of dividends and buybacks, which were both fully covered by free cash flows and operating cash flows. In addition, the payouts were fully covered by net income, which indicates a high degree of safety.
The dividend was eliminated in fiscal 2020, but it has since been restored. In addition, in the current fiscal year, share repurchases have reached a record high level. Given the high degree of coverage and the company’s significant holding of cash, the cuts in the early days of the pandemic appear to have been overdone and were a highly conservative response to the uncertainty at the time. Moving forward, the payouts are likely to increase in subsequent periods.
Author’s Summary of Cash Flow Statement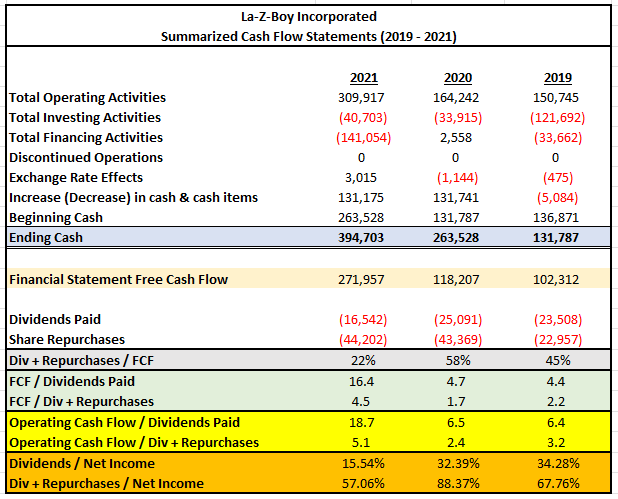
Overall, LZB’s fundamentals are strong. They are in a superior liquidity position that includes ample cash on hand and a strong ability to turn over their inventory and collect on A/R. The company continues to build up inventory to respond to unprecedented demand, and this is negatively impacting operating cash flows in the current fiscal year. As long as the inventory is sold on a timely basis, which is expected to be the case, operating cash flows in subsequent periods will catch up and surpass historical levels.
In addition to a strong liquidity position, the company’s long-term viability is solidified, as evidenced by their lack of long-term debt holdings. The lack of debt allows the company to use their excess capital that would have ordinarily been spent on debt servicing to other areas, such as CAPEX growth and shareholder payouts, which continue to be fully covered by the company’s earnings. For all these reasons, it’s therefore appropriate to apply a strong rating to the company’s fundamentals.
Target Share Price
Various methodologies were utilized to obtain an indication of the intrinsic share price of LZB. The results are provided in the chart below. The quickest methods involved simply applying the historical multiples to current pricing. Doing so yielded target prices with a low of $40 to a high of $64.
When applying models involving future cash flows, results came in at a low of $27 and a high of $61. With these models, the rate on 10-YR U.S. Treasuries is a critical variable in the computations. Since rates are projected to increase, the model incorporated the current rate, which was 2.75% at the time of analysis, as reported in The Wall Street Journal. And for hypothetical purposes, the analysis also utilized a rate of 5%.
When considering the results of all methods, the average target price worked out to be $45.
Author’s Summary of Various Valuation Methodologies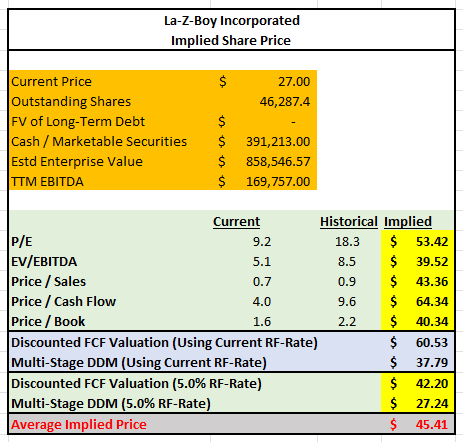
For illustration purposes, a further explanation is provided below of the methodology used for the DDM.
The first step in the model was to determine the discount rate to utilize in the model. For this, use of the capital asset pricing model (CAPM) was preferable. The model is a function of the stock beta and the risk premium, which is the difference between the expected return on the market and the risk-free rate. The beta of the stock is 1.03, as reported in Morningstar. The risk-free rate was the rate on 10-YR U.S Treasuries, which was 2.75%, as reported in The Wall Street Journal. The historical risk premium is 5.5%. Thus, the expected return on market is 8.25%. After inputting these variables into the CAPM, a discount rate of 8.42% was obtained.
Author’s Calculation of Discount Rate Using The CAPM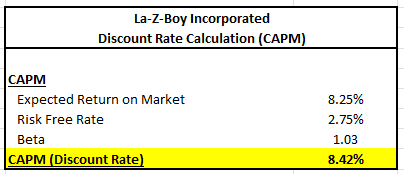
The next step was to input revenue and balance sheet-related data from the past five years. The results are provided below. Upon analyzing the results, a few observations were made.
- Net income margins were assumed to be on the lower side, 5%, moving forward
- Total liabilities are 56.21% of total assets
- Total shareholders’ equity is 43.79% of total assets
- The asset turnover ratio is 1.08
Author’s Summary of Historical Revenue and Balance Sheet-Related Figures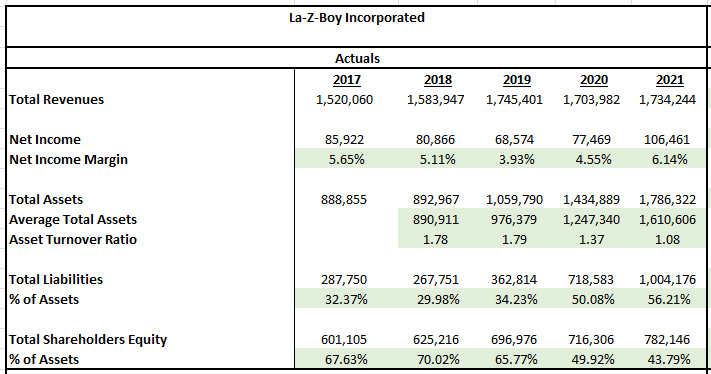
The observations noted above were then used to generate a forecast for the next five years. By projecting out total revenues and total assets, net income and total liabilities and shareholders’ equity were derived using the applicable percentages noted earlier.
Forecasted revenues are shown below. Currently, the company is in the third quarter of fiscal year 2022, which is represented as period 1 in this valuation model. At the current rate of sales, the company is expected to end the year with +$2.2B in sales, which would be 29% greater than in the prior fiscal year. For more conservative figures, this model assumed that sales would drop precipitously in the following years to a constant rate of 5% and settle in at a long-term growth rate of 3%. The 5% growth rate in sales is historically what the company has done in the pre-COVID years. Due to the unusual economic effects of COVID, however, the company has experienced a significant uptick in revenues during the past year. This rate of growth was not expected to last in this model.
Author’s Projections of Total Revenues
To explicitly link asset growth with sales growth, the asset turnover rate of 1.08 was used to project total future assets. The results are shown below.
Author’s Projections of Future Total Assets
One will notice that the implied % change in total assets fluctuates from year to year, whereas for purposes of this model, sales were expected to grow smoothly each year. To smooth out these asset fluctuations, the CAGR of total assets was calculated. In the model above, total assets were expected to grow to +$2.8B from +$1.8B. This represents a CAGR of 9.5%. The final projected totals using this growth rate are summarized below.
Author’s Smoothing of Projected Total Assets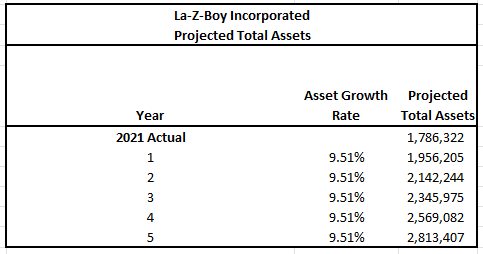
The totals above were inputted into the five-year model below. The total equity and net income in year five were the critical inputs required for the continuing value calculation.
Author’s Full DDM Projections
One of the final steps in the model was to input the historical shareholder payouts and share issuance data of the past five years and prepare a projection using the historical averages. The summary below provides the results of this analysis. LZB is repurchasing a record number of shares in the current fiscal year. In the past, repurchases as a % of sales has trended at about 2.5%. In the current year, however, it is amounting to approximately 4.5% of sales. Moving forward, this model assumes that the rate of repurchases will settle back to their historical averages. Additionally, LZB has been issuing stock at about 0.1% of sales, and the dividend payments have been about 1.5% of sales. Both are projected to account for generally the same share moving forward, except for the dividend payment, which is expected to be about 1.2% in the current fiscal year before accounting for 1.5% in the following years. Using these averages, the projections were prepared, and they were then discounted using a rate of 8.42%.
Author’s Calculations of Future Shareholder Payouts
Upon summing the present value of the net shareholder payouts above, the total was added to the continuing value that was calculated using a projected growth rate of 3%.
Author’s Calculated Intrinsic Share Price Using The DDM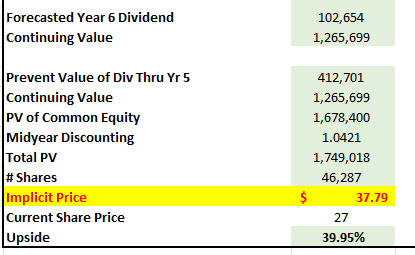
As seen above, the results of the model yielded a result of about $38. Taken together with the multiples approach, an average price target of $45 is appropriate.
Primary Risks
The furniture industry is particularly sensitive to declines in general economic conditions. In times of economic turmoil with periods of significant stress to household budgets, LZB’S products will be among the first to be cut as consumers reorient a larger share of their budget to more essential items. In addition, the rising cost of food and energy is a further strain on household incomes. As these costs continue to rise, consumers will increasingly cut back on discretionary spending. In addition, changes in interest rates, consumer confidence, and housing related metrics, such as new starts and existing home sales, also impact the company’s business. Rising rates and declining sentiment paired with a downturn in the housing market could negatively impact the company’s results of operations.
At present, LZB is more affected by supply-side factors as opposed to the demand-related factors mentioned above. Recently consumers have continued to allocate more discretionary spending to home furnishings, and the demand at times has affected the ability of the company maintain adequate supply. As such, the company’s product backlog is higher, and they may continue encountering delays in fulfilling customer orders. Continued failure in delivering products to retailers and end consumers in a timely and effective manner could damage LZB’s reputation and result in the loss of customers or reduced orders in the future.
The ability of LZB to continue fulfilling customer orders is partly dependent on the price and availability of the raw materials that are being used in their products. In their manufacturing processes, they use various types of wood, fabrics, leathers, and other materials and components. Significant increases in the cost of these inputs could negatively impact the company if they are unable to pass through the costs to their consumers. In addition, about 40% of their polyurethane foam comes from one supplier. While the supplier’s facilities are diversified across the U.S., should the supply suffer a significant setback, LZB’s manufacturing processes would be materially affected.
The company has operations in countries outside the United States, some of which are located in emerging markets. Exposure risk to international markets subjects the company to potential economic/political instability in the host country. Additionally, the company may be negatively impacted by geopolitical conflicts that may arise between the U.S or their allies and any of the countries that the company operates in. Tariffs and counter-tariffs, increased regulation, boycotts, and long-winded lawsuits are potential complexities that could raise the cost of doing business for the company.
Conclusion
LZB’s confidence in their company is evidenced by the record number of shares being repurchased in the current fiscal year. The market, however, is discounting the company’s outlook. As interest rates continue to increase, there is an understandable fear that economic conditions will deteriorate, especially in the housing market. The expected decline in the residential housing market is seen as a bearish indicator for the demand for furniture. While the concern is valid, it’s potentially misguided.
Household net worth is currently at record levels and the demand for housing still exceeds the available supply. The undersupply of homes will continue to support prices even if demand recedes. This will provide existing homeowners a continued source of funding to finance their larger discretionary purchases. In addition, despite rising rates and significant cost inflation, consumers have yet to materially curtail their discretionary purchases, due in part to their record level of savings. The underlying strength of the consumer and favorable long-term housing trends will continue to support the furniture market through 2022 and beyond.
LZB’s fundamentals are strong in every measurable category. They have significant cash on hand, and they are effective in managing their working capital. Furthermore, their lack of long-term debt provides the flexibility to comfortably invest in growth and return excess cash to shareholders via fully covered dividend payouts and buybacks. At current pricing, shares appear to be nearly 70% undervalued. For new and existing shareholders, this recliner stock is a sleeper add to their long-term diversified portfolios.
Be the first to comment