

SimonSkafar
Note: Since Keyera Corp. is reporting in Canadian Dollars, all numbers refer to Canadian Dollars (unless stated otherwise).
Thesis Overview
Keyera Corp. underperformed the market over the last ten years with a 103% total return versus a 241% total return for the S&P 500. The main reason for this underperformance is not fundamental performance, but a compression of the multiple by close to 50%. The dividend yield of close to 7% with cash flows only partially linked to commodity prices makes Keyera a viable investment for income investors. Keyera could be able to generate around 11% long-term returns. However, I am giving a Hold rating due to concerns of rising refinancing costs and because I think there will be chances to buy at lower prices in the future.
Company Introduction
Keyera Corp. (OTCPK:KEYUF/TSX:KEY:CA) is an integrated Canadian-based energy infrastructure company. Keyera operates assets in the oil and gas industry between the upstream sector, which includes oil and gas exploration and production, and the downstream sector, which includes the refining and marketing of finished products.
Keyera provides energy infrastructure solutions on a Fee-for-Service and Take-or-Pay basis and engages in the purchase and sale of natural gas liquids (NGLs), crude oil and iso-octane.
Business Overview (Segments)
Keyera operates through three operating segments: Gathering and Processing, Liquids Infrastructure and Marketing.
Gathering and Processing
Keyera operates 9 gas plants in Alberta, Canada, and has interests in 3 more gas plants that are operated externally. The snippet of the investor presentation below gives an overview of the assets. The orange marks show the locations of the mentioned gas plants.
Keyera Investor Presentation 2022 – Slide 21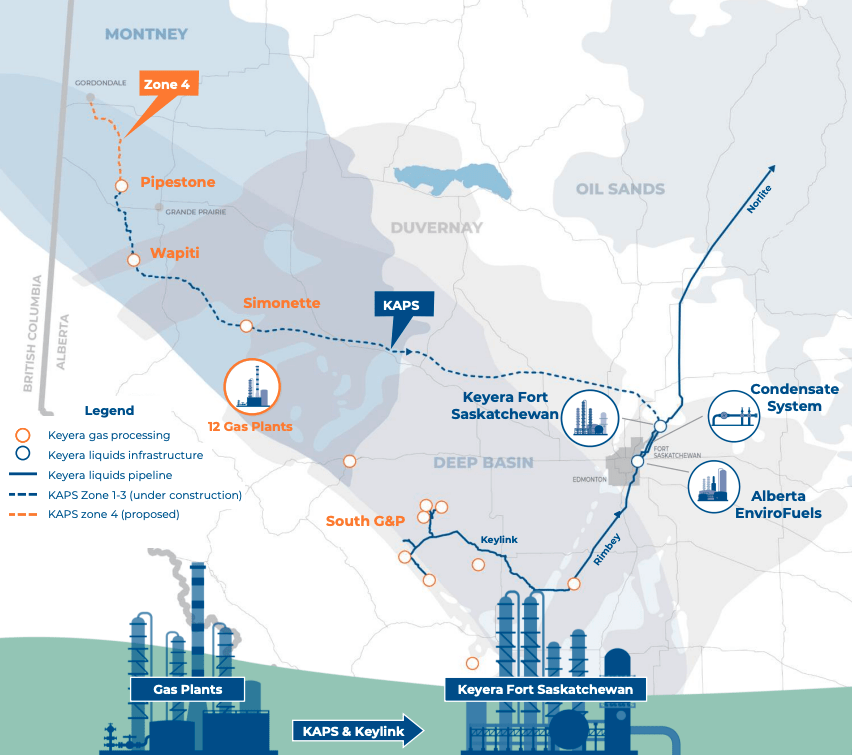
Keyera’s offering also includes raw gas gathering systems. Basically, the customer engages in the exploration of the gas and uses Keyera’s services to gather it (gathering systems) and direct it to the nearest/best suited gas plant. Keyera processes the gas and transports it through their pipelines to the Fort Saskatchewan area (more on that in the Liquids Infrastructure part). These services are provided on a Fee-for-Service basis.
Keyera doesn’t directly benefit from higher commodity prices, but from higher producer activity, ultimately resulting in higher processing throughput at the gas plants and higher Fee-for-Service. On the other hand, lower producer activity due to lower prices affects Keyera negatively.
Liquids Infrastructure
The liquids infrastructure segment provides fractionation, transportation and storage services for NGLs and crude oil. Basically, the gathered and processed raw gas gets delivered into the Edmonton/Fort Saskatchewan area for fractionation and the end product gets stored or delivered to the customer. The snippet below shows the various infrastructure assets in the Fort Saskatchewan area.
Keyera Investor Presentation 2022 – Slide 63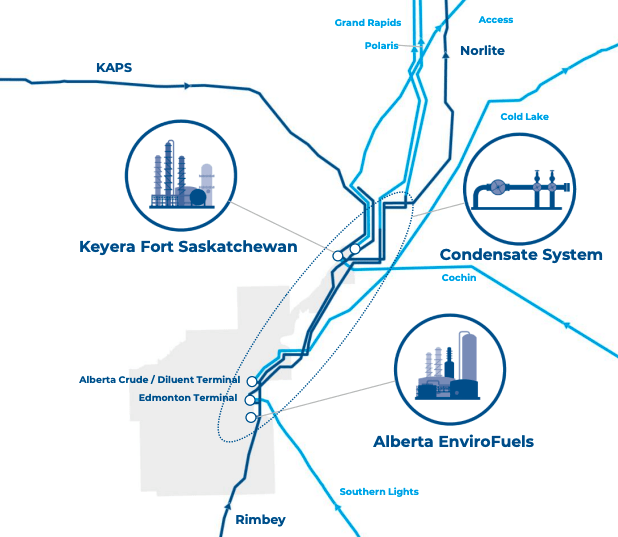
The light blue lines are 3rd party liquids pipelines, while the dark blue ones are Keyera liquids pipelines. The KAPS pipeline is still in construction and warrants an extra section.
KAPS Pipeline
Keyera describes the KAPS pipeline project as a game changer for the company. KAPS will connect the three northern gas plants (Pipestone, Wapiti and Simonette) to the Fort Saskatchewan area (as can be seen in the above illustrations) and allow Keyera to serve the whole value chain from the gathering systems to the delivery to end markets. More importantly, it will operate on a Take-or-Pay basis, which will make Keyera’s cash flows more stable.
One negative here is the fact that they had to revise total costs upwards again and again in the past few quarters. In the 2nd quarter 2022 report, they upped the expected cost net to Keyera (Keyera will hold an interest of 50%) from $800-$880 million to $900 million. In the 3rd quarter 2022 report, they upped the cost estimate again from $900 million to $1,000 million. The fact that management doesn’t seem to be able to calculate costs in a conservative manner is a negative sign for me. However, KAPS is now 90% complete and should start operations in early 2023. Keyera’s total capital employed stands at around $7.5 billion at the end of the third quarter 2022. The addition of a $1.0 billion asset with Take-or-Pay cash flows going into service should be able to add quite some to EBITDA and Distributable Cash Flow (DCF) in fiscal year 2023.
Marketing
Keyera also purchases and sells products associated with their own facilities. They buy products from their customers through supply arrangements and deliver these to end markets (propane, condensate) or use them on their own in the production of iso-octane at their Alberta EnviroFuels facility (butane). The earnings from the marketing segment depend on commodity prices between the purchase price from the arrangements and the selling prices. Therefore, the marketing segment is much more volatile than the other two segments.
Financials
Balance Sheet
At the end of the 3rd quarter 2022 Keyera had $2.79 billion equity and $5.84 billion liabilities, resulting in an equity ratio of around 32%. According to TIKR (S&P capital IQ) the net debt stood at $3.89 billion. According to management, net debt to EBITDA stood at 2.4 times. Net debt according to management stood at $3.6 billion, a bit below the number from S&P capital IQ. Even taking the higher net debt number, net debt to EBITDA is around 2.6 times, a good number for a capital-intensive business like this. Keyera’s target range is 2.5 to 3.0 times. The balance sheet doesn’t seem extraordinarily strong, but decent.
One may argue that Keyera has room to expand leverage to boost earnings, since other companies such as Enbrige (ENB/ENB:CA) are running much higher net debt to EBITDA ratios of 4.5-5 times. While this is basically true, keep in mind that Keyera’s cash flows are not sourced from take-or-pay contracts to the same extent as for other popular midstream companies. In their current investor presentation (slide 11) Keyera states that 69% of cash flows are Fee-for-Service (including Take-or-Pay) and 40% are Take-or-Pay. Keyera’s cash flows are simply not stable enough to allow for a much higher leverage ratio.
Earnings
Keyera’s main reporting measures are Adjusted EBITDA and DCF. At the end of the 3rd quarter 2022 the TTM Adjusted EBITDA stood at $1.11 billion. The TTM Adjusted DCF stood at $756 million. Keep in mind that the KAPS pipeline project going into service next year should add quite some EBITDA/DCF. For long-term numbers sake, the following chart shows the DCF/share and dividend/share from 2008 to 2021.
November 2022 Investor Presentation – slide 6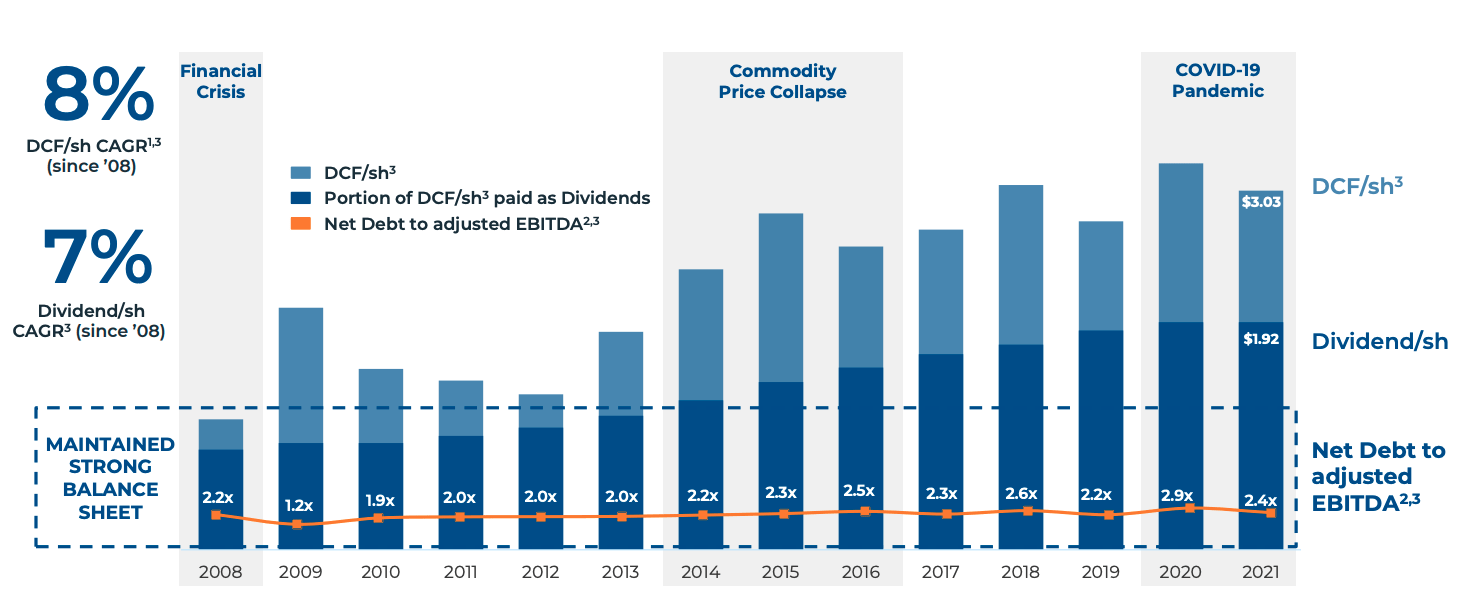
DCF/Share growth is stated at 8% CAGR from 2008. Since 2008 was a starting year that was favorable for the purpose of this chart, I doubt that this is really representative. I assume that overall DCF/share growth should be around 4% CAGR in the future (I will outline this assumption later on). What we can take away from this chart is that Keyera is a nice investment for dividend investors which are living off dividend income, since Keyera is paying their dividend monthly, has been able to grow it at a decent rate of 7% CAGR and is unlikely to cut it since the cash flows are only partially linked to commodity price fluctuations.
The more important question though is at what rates is Keyera able to deploy future capital, being retained earnings or further debt. I will use the reported Adjusted EBITDA numbers, deduct the depreciation to account for the decrease in employed capital over time (pretty conservative approach in my view) and divide this number by the capital employed (long-term debt plus shareholder’s equity). The resulting ROCE for the past few years are shown in table 1:
| Year | 2016 | 2017 | 2018 | 2019 | 2020 | 2021 | TTM |
| ROCE | 9.80% | 8.74% | 10.32% | 9.94% | 8.26% | 9.67% | 11.74% |
Table 1: ROCE from 2016 (Source: Author calculation off company reports)
I will assume an average ROCE of 9% for further reinvestment, which will be important for the following valuation section.
Valuation
Long-term expectations
At the end of the 3rd quarter 2022 there were 221,023,000 shares outstanding at a current price of $29.38 (US$21.99) for a total valuation of $6.49 billion (US$4.86 billion). The DCF for the trailing twelve months stands at $756,003, resulting in a DCF-Yield of 11.6%. Keyera aims for a payout ratio of around 60% (range of 50-70%). This would result in a dividend yield of around 7% (the current dividend yield sits at 6.55% at a 56% payout-ratio).
Assuming reinvestment of the remaining 40% as retained earnings at a 9% ROCE, leaves me to assume that Keyera might be able to grow around 3.6% per year without taking on further debt. Taking into account that they will grow debt in line with equity to keep the debt-to-equity ratio stable, my guess is that they may be able to grow at 4% per year for the future (the rate of return on additional debt is lower due to interest costs partly offsetting the 9% return rate).
So the expected return under the assumption that there will be no multiple expansion/compression should be around 11% (7% dividend + 4% earnings growth).
You might argue that this calculation doesn’t make sense, since Keyera didn’t deliver returns in this range in the past, as can be seen in the following two charts.
Seeking Alpha KEY:CA Seeking Alpha S&P500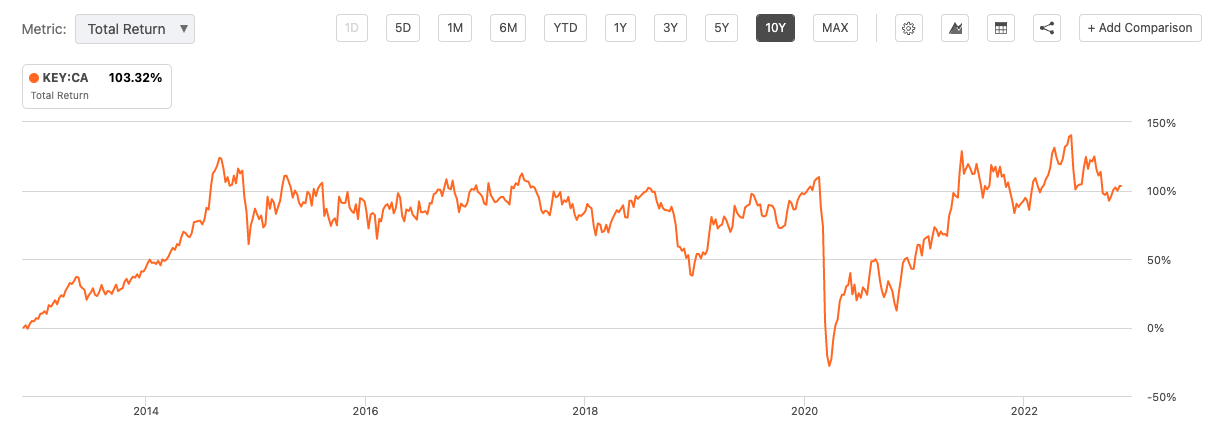
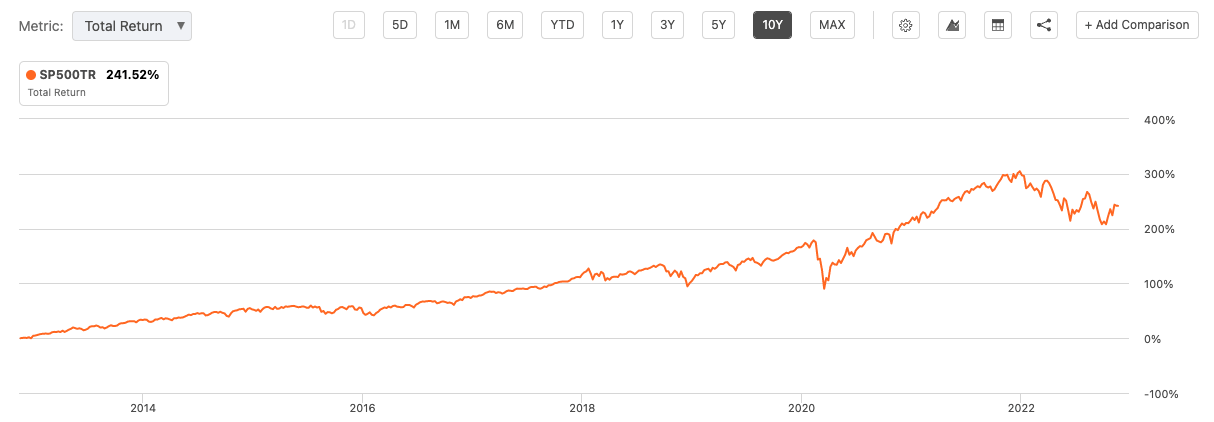
While the S&P500 made a 241% total return over the last ten years, Keyera only made a 103% total return (in local currency). The reason for this is shown in the following chart.
Seeking Alpha – KEY:CA Price to Book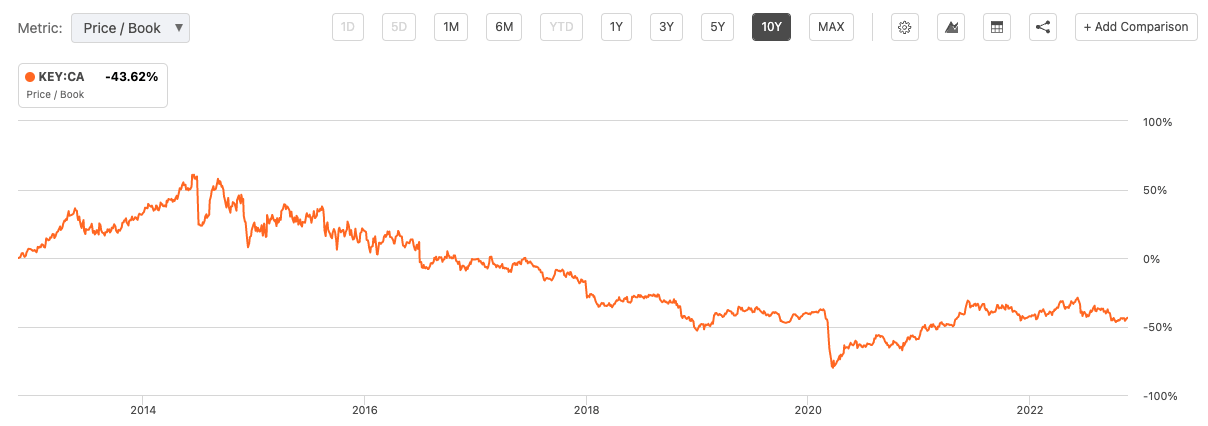
While the fundamental returns were there, the multiple compressed by close to 45%. Price to book may not be the best valuation metric for many companies, but it is usable for asset heavy infrastructure businesses. Despite this massive multiple compression, Keyera still managed to generate 103% total shareholder return for a CAGR of around 7%.
I will further prove my point by reverse engineering the past returns with my assumptions made above. Let’s assume 10 years ago Keyera traded at nearly double the multiples it trades now (corresponding to the 45% drop in price/book), at around a 6% DCF-Yield. With a 60% payout-ratio, the dividend yield would be 3.6%. The remaining 40% retained earnings reinvested at the above-mentioned ROCE of 9% gets another 3.6% earnings growth for a total return of around 7.2% (3.6% + 3.6%). So by buying Keyera at the assumed multiple 10 years ago, you set yourself up for around 7.2% CAGR long-term returns, which is what you got in the past 10 years.
DCF-valuation
For the DCF-valuation, there is one thing I need to mention beforehand. The DCF number is not comparable to the traditional Free cash flow (FCF) for other businesses. While FCF is the excess cash flow after maintenance and growth capex, DCF only takes into account maintenance capex. So to be precise, we would need to deduct the growth capex from the DCF to get the starting point for a DCF-valuation. I will keep it really simple and just use the target payout-ratio of 60%, since I already assumed that the other 40% will be reinvested as retained earnings.
So the actual cash flows for shareholders should be the current price multiplied by 11.6% (DCF-yield) multiplied by 60% (payout-ratio):
$29.38 (US$21.99) x 11.6% x 60% = $2.04 (US$1.53)
I will assume a 4% growth rate, as I outlined above, for the next 10 years, a 2% terminal growth rate and a 10% discount rate. The results can be seen in the chart below.
DCF-Valuation (moneychimp.com)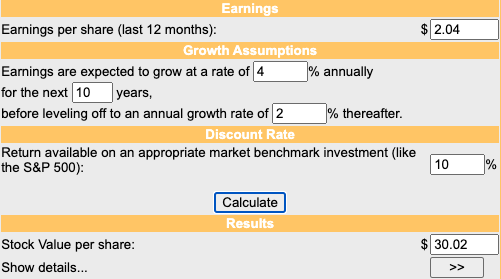
My assumptions leave me to assume that there is only around $0.60 upside potential from the current price of $29.38. Basically, Keyera seems to be fairly valued right now.
Risks
In my opinion, the one main risk is the effect that refinancing at higher rates may have on earnings in the future. Two other smaller risks are the indirect exposure to commodity prices and the possibility of further multiple compression.
To start with the smaller risks, I don’t think further multiple compression is very likely, but still possible. The dividend yield is at 7% and those cash flows are backed by 69% of cash flows being contributed by Fee-for-Service operations. I think a dividend cut is very unlikely as the target payout-ratio of 60% is backed by these 69% Fee-for-Service cash flows. The yield should give some downside protection regarding multiple compression, at least to an extent that Price/Book won’t drop another 45% in the future. As for the indirect exposure to commodity prices, Keyera is already striving for Fee-for-Service and Take-or-Pay contributing to cash flows to a greater extent, one example being the KAPS pipeline project going into service next year, adding more Take-or-Pay cash flows to the mix. In the current November 2022 Investor (slide 7) Presentation, Keyera states that they have the goal of growing Fee-for-Service contribution to cash flows to 75%. Lower commodity prices, followed by lower producer activity, could still affect earnings negatively, since the Fee-for-Service cash flows from the gathering and processing segment would also be hurt by reduced producer activity.
Turning to higher refinancing costs, this might simply hit the bottom-line and lower overall return of future project which are financed by debt. The latest public note offering (March 28, 2022) of 10-year senior unsecured notes bear an interest rate of 5.022%. Interest and Treasury rates (shown on the chart below) have skyrocketed since this offering, and I am not sure at what kind of rates Keyera would be able to refinance in the current environment.

One positive thing is that there are only $30 million long-term debt maturities next year. On the negative side, there are quite some maturities in the following three years after this, as can be seen in the chart below.
November 2022 Investor Presentation – slide 10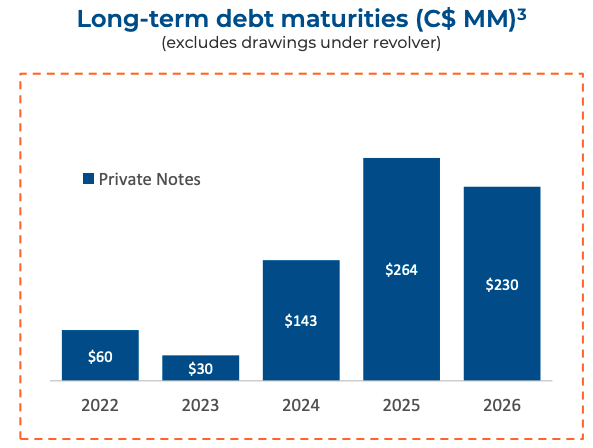
Conclusion
The monthly paid 7% dividend yield with cash flows being only partially exposed to commodity price fluctuations make Keyera a viable investment for income investors. Keyera should be able to deliver around 11% total returns going forward, assuming no changes in valuation. My DCF-valuation shows that Keyera is fairly valued at the moment.
However, I give a Hold rating due to concerns of higher refinancing costs and the fact that I think there will be lower prices to buy. The time to buy was two years ago at prices of around $20-23 (US$ 16-19) where the stock took quite some time to recover from the pandemic lows in March 2020. For me personally, I bought a small position at the end of 2020 at around $22 (US$18.50) and would probably sell the whole position at around $35 (US$26). I might change my stance to a buy rating at around $25 (US$18.60).
Be the first to comment