

zimmytws
This article was coproduced with Dividend Sensei.
The 2022 stagflationary bear market has been shocking in many ways.
The highest inflation in 41 years shocked economists who thought inflation would peak and decline early and rapidly.
The Fed hiking 4.25% this year, the bond market’s latest forecast, the fastest rate in 41 years, has shocked the stock market.
Stocks tumbling up to 4.3% in a day, and 13% in a month, have shocked even veteran investors.
And the worst bond bear market in history has shocked anyone with a balanced portfolio, like a 60/40, which is having its worst year since 1931.
In troubled times like these, with recession fears roaring, and volatility soaring, and markets melting down, there is one tried and true method I like to use to stay sane, safe, and calm.
Focus on your generous, safe, and growing dividends, which represent the fundamental truth of the blue-chips you own.
And do you know what really helps to remind us what matters? Monthly dividends that roll in like clockwork. They not just help us pay the bills if we’re retired, but can help us maximize the power of dividend reinvestment if we’re still saving for retirement.
DRIPing monthly dividends stocks in a bear market is a great way to stay calm, focused, and on track to retire in safety and splendor.
And that’s why today we want to recommend buying some Keyera Corp. (OTCPK:KEYUF), one of the best high-yield monthly blue chips you’ve never heard of.
Let me show you the four reasons why Keyera is a great choice for these turbulent times, so you cannot just survive but thrive through this bear market and get to the glorious bull market that’s coming when it’s over.
Reason One: Keyera Is The Complete Monthly Dividend Package
Here is the bottom line upfront on Keyera.
-
Canadian Company: foreign diversification
-
15% tax withholding (not in retirement accounts) – tax credit available to recoup withheld dividend
-
1099 tax form, qualified dividends
-
NO K1 tax form
Reasons To Potentially Buy Keyera Today
|
Metric |
Keyera |
|
Quality |
84% 13/13 Ultra SWAN (Sleep Well At Night) Midstream |
|
Risk Rating |
Low Risk |
|
DK Master List Quality Ranking (Out Of 500 Companies) |
178 |
|
Quality Percentile |
65% |
|
Dividend Growth Streak (Years) |
0 (No Cuts Since at least 2004) |
|
Dividend Yield |
6.2% paid monthly |
|
Dividend Safety Score |
85% Very Safe |
|
Average Recession Dividend Cut Risk |
0.5% |
|
Severe Recession Dividend Cut Risk |
1.85% |
|
S&P Credit Rating |
BBB- Stable |
|
30-Year Bankruptcy Risk |
11.00% |
|
Consensus LT Risk-Management Industry Percentile |
66% Above-Average |
|
Fair Value |
$29.67 |
|
Current Price |
$23.46 |
|
Discount To Fair Value |
21% |
|
DK Rating |
Potentially Strong Buy |
|
P/Operating Cash Flow |
7.9 (Anti-Bubble Blue-Chip) |
|
Historical P/OCF Range |
11 to 12.5 |
|
LT Growth Consensus/Management Guidance |
10.6% |
|
5-year consensus total return potential |
14% to 20% CAGR |
|
Base Case 5-year consensus return potential |
19% CAGR (3X better than the S&P 500) |
|
Consensus 12-month total return forecast |
26% |
|
Fundamentally Justified 12-Month Return Potential |
33% |
|
LT Consensus Total Return Potential |
16.8% |
|
Inflation-Adjusted Consensus LT Return Potential |
14.6% |
|
Consensus 10-Year Inflation-Adjusted Total Return Potential (Ignoring Valuation) |
3.90 |
|
LT Risk-Adjusted Expected Return |
10.47% |
|
LT Risk-And Inflation-Adjusted Return Potential |
8.25% |
|
Conservative Years To Double |
8.73 Vs. 14.0 S&P |
(Source: DK Zen Research Terminal)
KEYUF is trading at 7.9X cash flow, an anti-bubble valuation that prices in -1.2% CAGR growth compared to 10.6% CAGR analysts expect long-term.
Conservative, KEYUF should be able to double your money every 9 years compared to every 14 years for the S&P 500.
Analysts expect a 26% total return within a year, while 33% 12-month total returns would be justified by its fundamentals.
Keyera 2024 Consensus Total Return Potential
FAST Graphs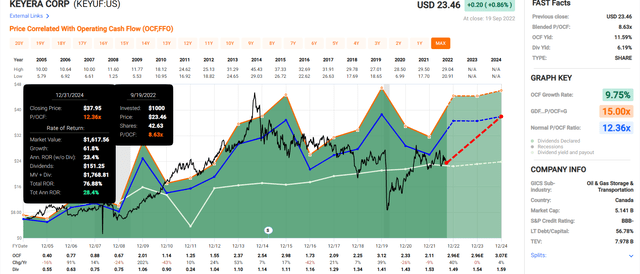
KEYUF offers a very solid 28% annual return potential through 2024, a 77% total return potential.
Keyera 2027 Consensus Total Return Potential
FAST Graphs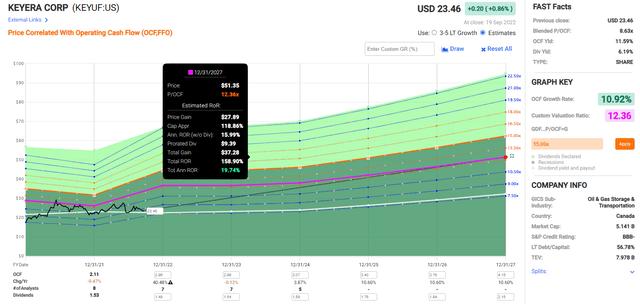
Through 2027 it offers 159% total return potential, or a Buffett-like 20% CAGR.
Now compare that to the S&P 500.
S&P 500 2024 Consensus Total Return Potential
-
over the next 2.5 years, analysts think the S&P will deliver about 11% annual returns
-
KEYUF could deliver 3X higher annual returns
S&P 500 2027 Consensus Total Return Potential
|
Year |
Upside Potential By End of That Year |
Consensus CAGR Return Potential By End of That Year |
Probability-Weighted Return (Annualized) |
Inflation And Risk-Adjusted Expected Returns |
|
2027 |
54.90% |
9.15% |
6.86% |
4.53% |
(Source: DK S&P 500 Valuation & Total Return Tool)
Over the next five years, analysts expect 9% annual returns from the S&P 500.
-
KEYUF offers more than 3X the return potential of the S&P 500
Keyera Investment Decision Score
Dividend Kings
Dividend Kings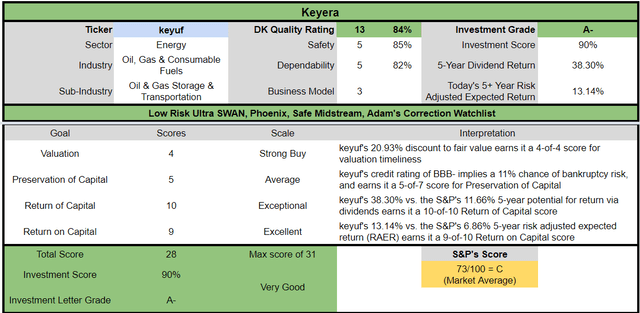
KEYUF is a potentially very good Ultra-SWAN high-yield monthly dividend option for anyone looking for supreme quality and comfortable with its risk profile.
-
21% discount vs. 2% market discount = 19% better valuation
-
6.2% very safe yield = 3.6X higher and safer yield
-
65% better long-term annual return potential
-
2X better risk-adjusted expected return over the next five years
-
almost 4X higher 5-year consensus income potential.
Reason Two: One Of The World’s Best Dividend Blue Chips
There are many ways to measure safety and quality, and I factor in pretty much all of them.
The Dividend Kings’ overall quality scores are based on a 269-point model that includes:
-
Dividend safety
-
Balance sheet strength
-
Credit ratings
-
Credit default swap medium-term bankruptcy risk data
-
Short and long-term bankruptcy risk
-
Accounting and corporate fraud risk
-
Profitability and business model
-
Growth consensus estimates
-
Management growth guidance
-
Historical earnings growth rates
-
Historical cash flow growth rates
-
Historical dividend growth rates
-
Historical sales growth rates
-
Cost of capital
-
GF Scores
-
Morningstar business model uncertainty score
-
Long-term risk-management scores from Moody’s, MSCI, Morningstar, FactSet, S&P, Reuters’/Refinitiv, and Just Capital
-
Management quality
-
Dividend-friendly corporate culture/income dependability
-
Long-term total returns (a Ben Graham sign of quality)
-
Analyst consensus long-term return potential
It includes over 1,000 fundamental metrics, including the 12 rating agencies we use to assess fundamental risk.
-
credit and risk management ratings make up 41% of the DK safety, and quality model
-
dividend/balance sheet/risk ratings make up 82% of the DK safety and quality model
How do we know that our safety and quality model works well?
During the two worst recessions in 75 years, our safety model 87% of blue-chip dividend cuts, the ultimate baptism by fire for any dividend safety model.
How does KEYUF score on our comprehensive safety and quality models?
Keyera Dividend Safety
|
Rating |
Dividend Kings Safety Score (202 Point Safety Model) |
Approximate Dividend Cut Risk (Average Recession) |
Approximate Dividend Cut Risk In Pandemic Level Recession |
|
1 – unsafe |
0% to 20% |
over 4% |
16+% |
|
2- below average |
21% to 40% |
over 2% |
8% to 16% |
|
3 – average |
41% to 60% |
2% |
4% to 8% |
|
4 – safe |
61% to 80% |
1% |
2% to 4% |
|
5- very safe |
81% to 100% |
0.5% |
1% to 2% |
|
KEYUF |
85% |
0.5% |
1.8% |
|
Risk Rating |
Low-Risk (66th industry percentile risk-management consensus) |
BBB- Stable Outlook rating = 11% 30-year bankruptcy risk |
20% OR LESS Max Risk Cap Recommendation |
Long-Term Dependability
|
Company |
DK Long-Term Dependability Score |
Interpretation |
Points |
|
Non-Dependable Companies |
20% or below |
Poor Dependability |
1 |
|
Low Dependability Companies |
21% to 59% |
Below-Average Dependability |
2 |
|
S&P 500/Industry Average |
60% (60% to 69% range) |
Average Dependability |
3 |
|
Above-Average |
70% to 79% |
Very Dependable |
4 |
|
Very Good |
80% or higher |
Exceptional Dependability |
5 |
|
KEYUF |
82% |
Exceptional Dependability |
5 |
Overall Quality
|
KEYUF |
Final Score |
Rating |
|
Safety |
85% |
5/5 Very Safe |
|
Business Model |
80% |
3/3 Excellent |
|
Dependability |
82% |
5/5 Exceptional |
|
Total |
84% |
13/13 Ultra SWAN |
|
Risk Rating |
4/5 Low-Risk |
|
|
20% OR LESS Max Risk Cap Rec |
5% Margin of Safety For A Potentially Good Buy |
KEYUF is the 179th highest quality company on the DK 500 Master list.
How significant is this? The DK 500 Master List is one of the world’s best watchlists, including
-
every dividend aristocrat (S&P companies with 25+ year dividend growth streaks)
-
every dividend champion (every company, including foreign, with 25+ year dividend growth streaks)
-
every dividend king (every company with 50+ year dividend growth streaks)
-
every foreign aristocrat (every company with 20+ year dividend growth streaks)
-
every Ultra SWAN (wide moat aristocrats, as close to perfect quality companies as exist)
-
40 of the world’s best growth stocks
In other words, even among the world’s best companies, KEYUF is of higher quality than 65% of them, similar in quality to such aristocrats and Ultra SWANs as:
-
Federal Realty Investment Trust (FRT): Ultra SWAN Dividend King REIT
-
Sherwin-Williams (SHW): Ultra SWAN dividend king
-
Realty Income (O): Ultra SWAN dividend aristocrats REIT
-
Public Storage (PSA): Ultra SWAN REIT
-
Honeywell (HON): Ultra SWAN
How does it rank on the DK Safe Midstream list?
KEYUF is the 4th highest quality on the Safe Midstream list between Pembina and Magellan Midstream.
Keyera Credit Ratings
|
Rating Agency |
Credit Rating |
30-Year Default/Bankruptcy Risk |
Chance of Losing 100% Of Your Investment 1 In |
|
S&P |
BBB- Stable Outlook |
11.00% |
9.1 |
|
DBRS |
BBB Stable |
7.50% |
13.3 |
|
Consensus |
BBB- Stable Outlook |
9.25% |
10.8 |
(Source: S&P, DBRS)
Rating agencies estimate a 9.3% fundamental risk of KEYUF going bankrupt in the next 30 years.
-
1 in 11 chance of losing all your money
S&P looks at over 1,000 total factors in its credit ratings, grouped into 16 major categories such as
-
Business risk
-
country risk
-
industry risk
-
cash flow/leverage
-
diversification
-
financial policy
-
liquidity
-
management and governance
-
and how they compare against other midstreams
Here is S&P’s summary of KEYUF’s BBB- credit rating, last updated on September 2nd, 2022 though this summary is from March 9th, 2021.
“The stable outlook reflects our view that Keyera will maintain a high proportion of stable fee-based or take-or-pay type contracts and any new projects will be contracted similarly. In our base-case scenario, we expect debt to EBITDA will be about 4x during our forecast period.
We could lower the rating if debt to EBITDA were to increase to above 4.5x consistently. This could result from a material reduction in throughput at the company’s gathering systems or declining oil sands production, which results in reduced condensate demand or low spreads and opportunities in the marketing business, or projects not proceeding on time and on budget.
We could also consider a negative rating action if cash flows decline, in particular with a decrease in take-or-pay cash flows.
We could consider a positive rating action if debt to EBITDA remains below 3.5x consistently. This could result from EBITDA being higher than we forecast due to higher volumes on Keyera’s gathering systems or increased oil sands production that results in more condensate demand and high utilization of Keyera liquids infrastructure.” – S&P (emphasis added)
Unlike most midstreams, due to the higher volatility in cash flow (up to 30% commodity exposure Vs. 15% or less for most midstreams), S&P is using a 4.5X leverage ratio as its safety guideline for maintaining an investment grade balance sheet.
-
KEYUF was downgraded from BBB during the Pandemic oil crash
Keyera Leverage Consensus Forecast
|
Year |
Debt/EBITDA |
Net Debt/EBITDA (4.5 Or Less Safe According To Credit Rating Agencies) |
Interest Coverage (2+ Safe) |
|
2021 |
3.69 |
3.75 |
4.14 |
|
2022 |
3.76 |
3.55 |
4.37 |
|
2023 |
3.70 |
3.37 |
3.76 |
|
2024 |
3.58 |
2.89 |
3.83 |
|
2025 |
3.33 |
3.10 |
NA |
|
2026 |
3.29 |
2.83 |
NA |
|
2027 |
3.03 |
NA |
NA |
|
Annualized Change |
-3.22% |
-5.48% |
-2.55% |
(Source: FactSet Research Terminal)
KEYUF’s leverage is at safe levels and is expected to decrease over time.
S&P considers a leverage ratio of 4X to 4.5X consistent with its current BBB- credit rating. By 2025 it might get an upgrade back to BBB per S&P’s report.
Keyera Balance Sheet Consensus Forecast
|
Year |
Total Debt (Millions) |
Net Debt (Millions) |
Interest Cost (Millions) |
EBITDA (Millions) |
Operating Income (Millions) |
Average Interest Rate |
|
2021 |
$2,777 |
$2,827 |
$133 |
$753 |
$550 |
4.79% |
|
2022 |
$3,027 |
$2,856 |
$132 |
$805 |
$577 |
4.36% |
|
2023 |
$2,998 |
$2,730 |
$143 |
$810 |
$538 |
4.77% |
|
2024 |
$3,057 |
$2,475 |
$156 |
$855 |
$597 |
5.10% |
|
2025 |
$2,933 |
$2,736 |
NA |
$882 |
NA |
NA |
|
2026 |
$2,992 |
$2,578 |
NA |
$910 |
NA |
NA |
|
2027 |
$3,055 |
NA |
NA |
$1,008 |
NA |
NA |
|
Annualized Growth |
1.60% |
-1.83% |
2.94% |
4.98% |
3.53% |
2.28% |
(Source: FactSet Research Terminal)
KEYUF’s cash flows are expected to grow at a modest rate in the coming years while its net debt drifts lower.
Bond Profile
-
$1.4 billion in liquidity
-
well-staggered bond maturities, so minimal refinancing risk
-
74% unsecured bonds (good financial flexibility)
-
longest maturing bond March 2081 at a 6% interest rate (now 7.9%)
-
100% fixed rate debt
The bond market is confident enough in Keyera’s long-term energy transition plan that it’s willing to lend to it for 60 years.
Why We Trust Keyera And So Can You
Keyera was founded in Calgary, Canada, in 1998. It offers a very attractive long-term high-yield monthly value proposition.
It has a large continent-spanning network of pipelines, storage facilities, and gas processing plants (12 of them) that are mission critical to North American energy security.
KEYUF owns assets that command:
-
20% of Alberta’s natural gas liquid fractionation capacity
-
35% of oil storage
-
15% of butane distribution
-
70% of oil sands condensate transport capacity
Why should you consider buying Keyera today?
-
one of the safest monthly dividends in the world
-
8% CAGR cash flow growth and 7% CAGR dividend growth since 2008
-
50% to 70% DCF payout ratio policy (83% is safe according to rating agencies)
-
strong returns on invested capital (15% five-year average, 5X its cost of capital)
-
wide moat asset base (mission critical to Alberta tar-sands)
-
good energy transition plan (66th percentile risk management consensus and bond market willing to lend to them for 60 years)
KEYUF has maintained one of the lowest leverage ratios in the industry since 2008, never rising above 2.9X net debt/adjusted EBITDA.
-
in 2016, some midstreams were at 8X
-
including KMI at 7X
Keyera has never cut its dividend since it began paying one in 2004.
Why am I confident that KEYUF won’t cut even in a severe recession?
-
it avoided a cut (frozen) in the Pandemic when crude fell to -$38
-
the worst oil crash in human history
-
it avoided a cut (frozen) in the Great Recession
-
management calls the dividend “non-discretionary”
-
the dividend is covered 100% by fee-based revenue
-
65% long-term payout ratio target
-
65% payout ratio consensus for 2022
New projects are focused on fee-based revenue, not linked to commodity prices.
-
70% in 2022
-
rising to 77% by 2025
In 2021, 69% of cash flow was fee for service, and 40% was take-or-pay contracts with an average duration of 7 years.
-
producers reserve capacity and KEYUF gets paid regardless of volumes
Meanwhile, KEYUG’s energy transition plan is focused on natural gas, which the U.S. Energy Information Administration or EIA expects to see strong and steady demand growth through at least 2050.
-
oil demand is expected to peak around 2035
-
and remain relatively steady (slow decline rate) through 2050
KEYUF owns critical gas transmission infrastructure connecting Canada’s massive and low-cost shale deposits to the global market.
-
the EU is now signing long-term contracts for decades to replace its Russian natural gas
How large are Canada’s energy reserves?
-
almost 300 billion barrels of oil sands in Alberta
-
760 trillion cubic feet of natural gas vs. 473 trillion cubic feet in the US
How low cost is Canada’s natural gas to produce? Per million BTUs (1,000 cubic feet) $0.87 to $1.30, 0% to 50% less than Texas’s Eagle Ford shale formation.
-
Natural gas is almost $8 today
For the foreseeable future, North American gas producers will be minting money.
How much money? CA gas producers are expected to generate $12 billion in cumulative free cash flow from 2022 through 2023, and that’s after spending $7.5 billion in growth spending.
CA gas producers (KEYUF’s customers) have almost no debt remaining after de-leveraging to near zero on a net basis in this recent energy boom.
Management is guiding for 6% to 7% cash flow growth through 2025.
KEYUF’s energy transition plan, which the bond market, rating agencies, and analysts have strong confidence will succeed, is focused on:
-
LNG
-
carbon sequestration
-
hydrogen
-
net-zero petrochemicals
-
biofuels
Rating agencies like MSCI and Morningstar/Sustainalytics have been upgrading KEYUF since it launched its energy transition plan in 2018.
-
more on this in the risk section
KEYUF is very disciplined with new growth spending, with every project expected to deliver 10% to 15% returns on capital (3X to 4X its cost of capital).
-
every project aligned with its long-term energy transition plan
KEYUF expects to spend about $225 million per year on growth.
-
the equivalent of ENB spending $3.8 billion per year on growth (adjusted for enterprise value)
The company’s capital allocation priorities are very reasonable and prudent:
-
maintenance spending
-
maintain an investment grade credit rating
-
pay the current dividend
-
discretionary spending (debt reduction, dividend growth, growth spending, buybacks).
Management expects to start growing the dividend again in 2023.
Reason Three: A Fantastic Growth Runway For Decades To Come
KEYUF is priced for -1.2% growth at its anti-bubble valuation of 7.9X cash flow. Here is what analysts actually expect.
Keyera Medium-Term Growth Consensus (By Year)
|
Metric |
2021 Growth |
2022 Growth Consensus |
2023 Growth Consensus |
2024 Growth Consensus |
2025 Growth Consensus |
2026 Growth Consensus |
2027 Growth Consensus |
|
Sales |
74% |
30% |
-23% |
3% |
NA |
NA |
NA |
|
Dividend |
0% |
0% |
3% |
3% |
3% |
2% |
16% |
|
Operating Cash Flow |
-15% |
44% |
0% |
5% |
NA |
NA |
NA |
|
Distributable Cash Flow |
-7% |
-4% |
10% |
4% |
2% |
4% |
3% |
|
EBITDA |
42% |
-9% |
0% |
5% |
NA |
NA |
NA |
|
EBIT (operating income) |
75% |
-8% |
-6% |
9% |
NA |
NA |
NA |
(Source: FAST Graphs, FactSet Research)
In 2023, potentially due to the recession, analysts expect lower commodity prices to result in a 23% decline in revenue.
-
but cash flows are expected to remain stable, and the dividend is expected to start growing steadily at 3% in 2023
-
and then potentially much faster starting in 2027
Keyera Medium-Term Growth Consensus
|
Year |
Sales |
Distributable Cash Flow |
EBITDA |
EBIT (Operating Income) |
Net Income |
|
2021 |
$3,982 |
$526 |
$753 |
$550 |
$255 |
|
2022 |
$5,202 |
$513 |
$805 |
$577 |
$364 |
|
2023 |
$4,362 |
$538 |
$810 |
$538 |
$338 |
|
2024 |
$4,199 |
$558 |
$855 |
$597 |
$354 |
|
2025 |
NA |
$587 |
$882 |
NA |
NA |
|
2026 |
NA |
$607 |
$910 |
NA |
NA |
|
2027 |
NA |
$619 |
$1,008 |
NA |
NA |
|
Annualized Growth 2021-2024 |
1.78% |
2.76% |
4.98% |
3.53% |
1.55% |
|
Cumulative 2022-2024 |
$13,763 |
$1,609 |
$2,470 |
$1,712 |
$1,056 |
(Source: FactSet Research Terminal)
In the medium term, growth is expected to be modest due to the coming global recession.
Keyera Margin Consensus Forecast
|
Year |
DCF Margin |
EBITDA Margin |
EBIT (Operating) Margin |
Net Margin |
|
2021 |
13.2% |
18.9% |
13.8% |
6.4% |
|
2022 |
9.9% |
15.5% |
11.1% |
7.0% |
|
2023 |
12.3% |
18.6% |
12.3% |
7.7% |
|
2024 |
13.3% |
20.4% |
14.2% |
8.4% |
|
Annualized Growth 2022-2027 |
0.23% |
2.50% |
0.97% |
9.60% |
(Source: FactSet Research Terminal)
But margins are expected to remain stable or improve. How impressive are these margins?
KEYUF’s historical profitability is in the top 20% of peers.
KEYUF’s industry-leading profitability has been relatively stable for the last 17 years, confirming a wide and stable moat.
Keyera Dividend Growth Consensus
|
Year |
Dividend Consensus |
DCF/Share Consensus |
DCF Payout Ratio |
Retained (Post-Dividend) Free Cash Flow |
Buyback Potential |
Debt Repayment Potential |
|
2022 |
$1.49 |
$2.29 |
65.1% |
$177 |
2.57% |
6.4% |
|
2023 |
$1.54 |
$2.53 |
60.9% |
$219 |
3.18% |
7.2% |
|
2024 |
$1.59 |
$2.63 |
60.5% |
$230 |
3.34% |
7.6% |
|
2025 |
$1.61 |
$2.68 |
60.1% |
$236 |
3.44% |
7.9% |
|
2026 |
$1.72 |
$2.79 |
61.6% |
$236 |
3.44% |
7.7% |
|
2027 |
$1.78 |
$2.86 |
62.2% |
$239 |
3.47% |
8.1% |
|
Total 2022 Through 2027 |
$9.73 |
$10.13 |
61.7% |
$1,337.05 |
19.43% |
44.17% |
|
Annualized Rate |
3.6% |
4.5% |
-0.9% |
6.2% |
6.2% |
5.0% |
(Source: FactSet Research Terminal)
Rating agencies consider 83% a safe payout ratio (1.2X coverage).
KEYUF is expected to maintain a low 60% payout ratio and retain $1.3 billion in post-dividend cash flow through 2027.
That’s enough to pay off 44% of existing debt or buy back up to 19% of shares at current valuations.
Keyera Buyback Consensus
|
Year |
Consensus Buybacks ($ Millions) |
% Of Shares (At Current Valuations) |
Market Cap |
|
2022 |
$0 |
0.0% |
$6,882 |
|
2023 |
$0 |
0.0% |
$6,882 |
|
2024 |
$39 |
0.6% |
$6,882 |
|
2025 |
$39 |
0.6% |
$6,882 |
|
2026 |
$39 |
0.6% |
$6,882 |
|
2027 |
$39 |
0.6% |
$6,882 |
|
Total 2023 through 2027 |
$156 |
2.3% |
$6,882 |
(Source: FactSet Research Terminal)
Analysts expect management to buy back about $40 million worth of stock, 0.6% of shares at current valuations, starting in 2024, after its de-leveraging efforts are completed.
Keyera Long-Term Growth Outlook
-
10.6% CAGR median consensus from all 14 analysts
-
3rd highest in the safe midstream list
-
management guidance 6% to 7% CAGR
How accurate are analysts at forecasting KEYUF’s growth?
Smoothing for outliers, analyst margins of error on KEYUF are 20% to the downside and 5% to the upside.
-
7% to 11% CAGR margin-of-error adjusted growth consensus range (including management guidance)
Analysts expect the long-term boom in gas production to restore KEYUF to its historical growth rates of the last 16 to 17 years.
|
Investment Strategy |
Yield |
LT Consensus Growth |
LT Consensus Total Return Potential |
Long-Term Risk-Adjusted Expected Return |
Long-Term Inflation And Risk-Adjusted Expected Returns |
Years To Double Your Inflation & Risk-Adjusted Wealth |
10-Year Inflation And Risk-Adjusted Expected Return |
|
Keyera (Analyst Consensus) |
6.2% |
10.6% |
16.8% |
11.8% |
9.5% |
7.6 |
2.47 |
|
Keyera (Management Guidance) |
6.2% |
6.5% |
12.7% |
8.9% |
6.6% |
10.9 |
1.89 |
|
High-Yield (SCHD) |
3.4% |
8.7% |
12.1% |
8.5% |
6.2% |
11.7 |
1.82 |
|
Dividend Aristocrats |
2.4% |
8.6% |
11.0% |
7.7% |
5.4% |
13.4 |
1.69 |
|
S&P 500 |
1.7% |
8.5% |
10.2% |
7.1% |
4.9% |
14.8 |
1.61 |
|
Nasdaq |
0.9% |
11.8% |
12.7% |
8.9% |
6.6% |
10.9 |
1.89 |
(Source: DK Research Terminal, Morningstar, Factset, Ycharts)
Management guidance is for 12.7% long-term total returns, matching the Nasdaq and beating the S&P, SCHD, and the dividend aristocrats.
Analysts expect a return to historical Nasdaq and market-smashing returns.
Total Returns Since November 2003
KEYUF has been one of the best-performing high-yield blue-chips of the last 19 years, with consistent 15% average 15-year rolling returns and average annual returns of 20%.
Inflation-Adjusted Consensus Total Return Potential: $1,000 Initial Investment
|
Time Frame (Years) |
7.9% CAGR Inflation-Adjusted S&P 500 Consensus |
8.7% Inflation-Adjusted Dividend Aristocrats Consensus |
10.4% CAGR Inflation-Adjusted KEYUF Management Guidance |
Difference Between Inflation-Adjusted KEYUF Management Guidance And S&P Consensus |
|
5 |
$1,461.18 |
$1,516.17 |
$1,640.75 |
$179.57 |
|
10 |
$2,135.06 |
$2,298.77 |
$2,692.06 |
$557.00 |
|
15 |
$3,119.71 |
$3,485.33 |
$4,416.99 |
$1,297.28 |
|
20 |
$4,558.47 |
$5,284.36 |
$7,247.17 |
$2,688.70 |
|
25 |
$6,660.75 |
$8,012.00 |
$11,890.78 |
$5,230.02 |
|
30 (retirement time frame) |
$9,732.58 |
$12,147.56 |
$19,509.78 |
$9,777.19 |
|
35 |
$14,221.09 |
$18,417.77 |
$32,010.64 |
$17,789.55 |
|
40 |
$20,779.62 |
$27,924.49 |
$52,521.41 |
$31,741.80 |
|
45 |
$30,362.83 |
$42,338.29 |
$86,174.43 |
$55,811.61 |
|
50 |
$44,365.65 |
$64,192.09 |
$141,390.59 |
$97,024.93 |
|
55 |
$64,826.35 |
$97,326.17 |
$231,986.41 |
$167,160.06 |
|
60 Bond market time frame, investing lifetime |
$94,723.18 |
$147,563.10 |
$380,631.38 |
$285,908.20 |
|
100 institutional time frame |
$1,968,311.27 |
$4,120,623.88 |
$19,991,297.77 |
$18,022,986.50 |
(Source: DK Research Terminal, FactSet)
Using management’s more conservative return guidance, KEYUF is potentially capable of a 20X inflation-adjusted return over the next 30 years.
Over an investing lifetime, it could deliver 380X real returns.
|
Time Frame (Years) |
Ratio KEYUF Management Guidance/Aristocrat Consensus |
Ratio Inflation And Inflation-Adjusted KEYUF Management Guidance vs. S&P consensus |
|
5 |
1.08 |
1.12 |
|
10 |
1.17 |
1.26 |
|
15 |
1.27 |
1.42 |
|
20 |
1.37 |
1.59 |
|
25 |
1.48 |
1.79 |
|
30 |
1.61 |
2.00 |
|
35 |
1.74 |
2.25 |
|
40 |
1.88 |
2.53 |
|
45 |
2.04 |
2.84 |
|
50 |
2.20 |
3.19 |
|
55 |
2.38 |
3.58 |
|
60 |
2.58 |
4.02 |
|
100 |
4.85 |
10.16 |
(Source: DK Research Terminal, FactSet)
Over the next 30 years, KEYUF could potentially double the market’s real returns and beat the aristocrats by 60%.
Reason Four: A Wonderful Company At A Wonderful Price
Over the past 7 to 16 years, millions of income investors, outside of bear markets and bubbles, have consistently paid between 11X and 12.5X cash flow for KEYUF.
-
90% statistical probability this range includes intrinsic value
|
Metric |
Historical Fair Value Multiples (all Years) |
2021 |
2022 |
2023 |
2024 |
12-Month Forward Fair Value |
|
5-Year Average Yield |
6.36% |
$23.74 |
$22.91 |
$22.91 |
$24.69 |
|
|
13-Year Median Yield |
4.39% |
$34.40 |
$33.19 |
$33.19 |
$35.76 |
|
|
P/OCF |
12.36 |
$26.08 |
$36.59 |
$36.59 |
$37.95 |
|
|
Average |
$27.39 |
$29.67 |
$29.67 |
$31.64 |
$29.67 |
|
|
Current Price |
$23.46 |
|||||
|
Discount To Fair Value |
14.34% |
20.93% |
20.93% |
25.85% |
20.93% |
|
|
Upside To Fair Value (NOT Including Dividends) |
16.74% |
26.47% |
26.47% |
34.86% |
26.47% (33% including dividend) |
|
|
2022 OCF |
2023 OCF |
2022 Weighted OCF |
2023 Weighted OCF |
12-Month Forward PE |
12-Month Average Fair Value Forward P/OCF |
Current Forward P/OCF |
|
$2.96 |
$2.96 |
$0.74 |
$2.22 |
$2.96 |
10.02 |
7.93 |
We conservatively estimate KEYUF is worth about 10X cash flow, factoring in historical dividend yields.
Today it trades at 7.9X, an anti-bubble valuation.
The purpose of the margin of safety is to render the forecast unnecessary. – Ben Graham
|
Rating |
Margin Of Safety For Low Risk 13/13 Quality Ultra SWANs |
2022 Fair Value Price |
2023 Fair Value Price |
12-Month Forward Fair Value |
|
Potentially Reasonable Buy |
0% |
$29.67 |
$29.67 |
$29.67 |
|
Potentially Good Buy |
5% |
$28.19 |
$28.19 |
$28.19 |
|
Potentially Strong Buy |
15% |
$25.22 |
$25.22 |
$25.22 |
|
Potentially Very Strong Buy |
25% |
$21.14 |
$22.25 |
$22.25 |
|
Potentially Ultra-Value Buy |
35% |
$19.29 |
$19.29 |
$19.29 |
|
Currently |
$23.46 |
20.93% |
20.93% |
20.93% |
|
Upside To Fair Value (Not Including Dividends) |
26.47% |
26.47% |
26.47% |
For anyone comfortable with its risk profile, KEYUF is a potentially strong buy.
Risk Profile: Why Keyera Isn’t Right For Everyone
There are no risk-free companies, and no company is right for everyone. You have to be comfortable with the fundamental risk profile.
KEYUF’s Risk Profile Includes
-
economic cyclicality risk: relatively volatile cash flow for a midstream (30% commodity exposure)
-
M&A execution risk: from future industry consolidation
-
regulatory risk: specifically for new project approvals (Keystone XL is a good example of what can go wrong)
-
failure of the green energy transition plan
-
talent retention risk in the tightest job market in 50 years
-
cyber-security risk: hackers and ransomware (Colonial pipeline hack is an example of what can happen)
-
currency risk: including the dividend
-
the highest volatility on the safe midstream list
KEY’s average annual volatility since the oil crash began in 2014 (the 1st one of the last decade) has been 52%. In the last year, it’s come down to 28%, but it’s by far the most volatile midstream blue-chip.
-
but EPD’s volatility in the last year is 25%
-
ENB’s is 21%
The volatility of any stock, but especially midstreams, tends to be a function of the:
-
market cap
-
cash flow stability
At $7 billion, this is a midcap midstream and at 30% commodity sensitivity, 2X that of EPD, and 15X that of ENB; it’s not surprising that KEYUF can swing violently even if the thesis remains completely intact.
How do we quantify, monitor, and track such a complex risk profile? By doing what big institutions do.
Long-Term Risk Management Analysis: How Large Institutions Measure Total Risk Management
See the risk section of this video to get an in-depth view (and link to two reports) of how DK and big institutions measure long-term risk management by companies
Keyera Long-Term Risk-Management Consensus
|
Rating Agency |
Industry Percentile |
Rating Agency Classification |
|
MSCI 37 Metric Model |
78.0% |
A, Above-Average, Positive Trend |
|
Morningstar/Sustainalytics 20 Metric Model |
92.2% |
22.7/100 Medium-Risk |
|
Reuters’/Refinitiv 500+ Metric Model |
71.4% |
Good |
|
S&P 1,000+ Metric Model |
38.0% |
Below-Average, Stable Trend |
|
FactSet |
50.0% |
Average, Positive Trend |
|
Morningstar Global Percentile (All 15,000 Rated Companies) |
65.5% |
Above-Average |
|
Consensus |
66% |
Low Risk, Above Risk-Management, Stable Trend |
(Sources: Morningstar, MSCI, S&P, Reuters, Just Capital)
KEYUF’s Long-Term Risk Management Is The 218th Best In The Master List (56th Percentile)
|
Classification |
Average Consensus LT Risk-Management Industry Percentile |
Risk-Management Rating |
|
S&P Global (SPGI) #1 Risk Management In The Master List |
94 |
Exceptional |
|
Strong ESG Stocks |
78 |
Good – Bordering On Very Good |
|
Foreign Dividend Stocks |
75 |
Good |
|
Ultra SWANs |
71 |
Good |
|
Low Volatility Stocks |
68 |
Above-Average |
|
Dividend Aristocrats |
67 |
Above-Average |
|
Keyera |
66 |
Above-Average |
|
Dividend Kings |
63 |
Above-Average |
|
Master List average |
62 |
Above-Average |
|
Hyper-Growth stocks |
61 |
Above-Average |
|
Monthly Dividend Stocks |
60 |
Above-Average |
|
Dividend Champions |
57 |
Average bordering on above-average |
(Source: DK Research Terminal)
KEYUF’s risk-management consensus is in the top 44% of the world’s highest quality companies and similar to that of such other blue-chips as
-
Illinois Tool Works (ITW): Ultra SWAN dividend king
-
Coca-Cola (KO): Ultra SWAN dividend king
-
PPG Industries (PPG): Ultra SWAN dividend king
-
Nike (NKE): Ultra SWAN
The bottom line is that all companies have risks, and KEYUF is above-average at managing theirs.
How We Monitor Keyera’s Risk Profile
-
14 analysts
-
2 credit rating agencies
-
6 total risk rating agencies
-
20 experts who collectively know this business better than anyone other than management
“When the facts change, I change my mind. What do you do, sir?” – John Maynard Keynes
There are no sacred cows at iREIT or Dividend Kings. Wherever the fundamentals lead, we always follow. That’s the essence of disciplined financial science, the math behind retiring rich and staying rich in retirement.
Bottom Line: Keyera Is A 6.2% Yielding Monthly Dividend Blue-Chip Made For Turbulent Times
Let me be clear: We’re NOT calling the bottom in KEYUF.
Ultra SWAN doesn’t mean “can’t fall hard in a bear market.”
Fundamentals are all that determine safety and quality, and my recommendations.
-
over 30+ years, 97% of stock returns are a function of pure fundamentals, not luck
-
in the short term; luck is 33X as powerful as fundamentals
-
in the long term, fundamentals are 33X as powerful as luck
While we can’t predict the market in the short term, here’s what we can tell you about Keyera.
-
One of the highest quality, safest, and most dependable high-yield monthly paying stocks.
-
6.2% very safe yield, paid monthly and growing at 3.6% over the coming years
-
12.7% CAGR long-term total return consensus, 16.8% CAGR total return potential, better than the Nasdaq, aristocrats, S&P 500, and SCHD.
-
21% historically undervalued, a potentially strong buy
-
7.9X cash flow, anti-bubble valuation
-
160% consensus return potential over the next five years, 20% CAGR, about 3X more than the S&P 500
-
2X better risk-adjusted expected returns of the S&P 500 over the next five years.
-
Almost 4X better income potential over the next five years
Are you worried about stagflation?
Well Keyera is an inflation-resistant business with a great balance sheet, capable management, and a track record of income dependability.
Are you worried about recession?
Keyera’s dividend has remained safe even in the two worse recessions in 75 years.
Are you worried that the green energy transition might destroy pipelines?
The bond market, rating agencies, and 14 analysts are confident that KEYUF will still be around in 60 years.
If you are tired of the market’s wild swings, it’s time to turn off CNBC and focus on safe dividends.
If you’re terrified of soaring interest rates, it’s time to trust the world’s best blue-chips.
If you’re despairing that this bear market will never end, remember that this too, shall pass.
We can’t tell you when the market or how far below us the market will bottom, but we can promise you it’s coming sooner than you think.
And when the bottom is finally in, no one will ring a bell and tell you it’s safe to get back into the market.
Avoiding risk is impossible; managing risk is crucial to achieving your retirement dreams.
World-class blue-chips like Keyera are the kind of high-yield monthly payers we love recommending in turbulent times like these.
They are battle-tested income and wealth compounding titans that can help you not just sleep well at night today while retiring in safety and splendor in the years and decades to come.
Be the first to comment