

South_agency/E+ via Getty Images
Introduction
Every year the Russell Indexes are rebalanced to bring in new stocks and remove underperforming stocks. The FTSE Russell calls this event the annual reconstitution process. It begins with evaluations and “rankings” in May and moves to the June-transition month. For 2022, beginning on June 3rd, the preliminary selection lists are communicated to the markets. Updates are provided following on June 10, 17, and 24th with the reconstituted indexes taking effect after the close on June 24 this year.
FTSE Russell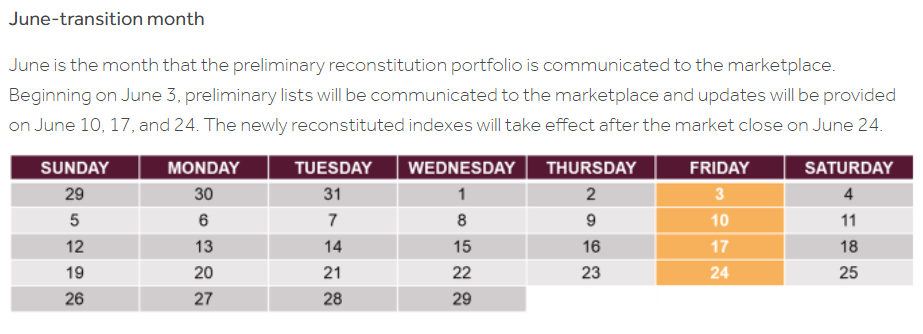
Over the years I have tested many published scholarly studies in simulated trading portfolios to measure the claimed abnormal excess returns. These investigative bonus articles include much more detail for members of my marketplace service, but samples and summaries of different prior test results can be read here:
Testing Abnormal Reconstitution Returns for 2022
The current multi-level study began from the June reconstitution period and has run through July for the first 1-month of analysis. Most publish research finds that the strongest effects of the index anomaly occur in the one to three month period after reconstitution. I am taking a moment to share with you some of the first month findings of the different tested research as summarized below:
1. Cai and Houge (2018) multi-year findings that in the long term a buy/hold Russell 2000 portfolio significantly outperforms any new addition stock portfolios. They found that a buy-and-hold portfolio significantly outperformed the annually rebalanced index by an average of 2.22 percent over one year and by 17.29 percent over five years.
2. Zdorovtsov, Tang, and Onayev (2017) evaluated 14 years of Russell 3000 reconstitution behavior between 2000 and 2013 and observed strong positive post-event returns for additions to the index. The strongest results were found out to the longest measured post-event period of 21 days with average value-weighted gains of +7.46%.
3. Most recently according to Chinco & Sammon (2022), they document the strongest post reconstitution positive return comes from stocks that move up to the larger cap Russell 1000 index from the 2000 index.
Chinco & Sammon (2022)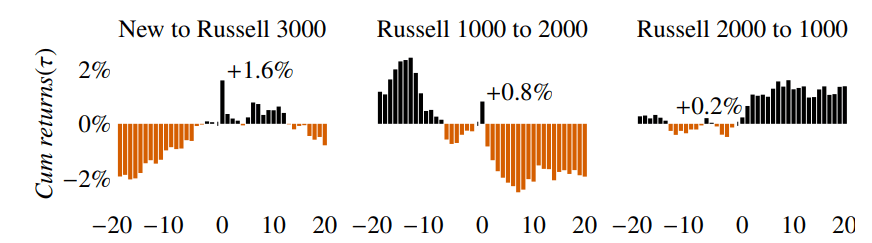
4. In the Madhavan (2003) study he found several profitable anomalies in the reconstitution data between 1995 through 2001. One element was that the mean return in the month of July for the spread portfolio produced negative -7% average returns following the reconstitution date, suggesting a strong mean reversion. In other words, strong average +6.8% gains in the long additions/short deletions portfolio for June reverted to -7% for July across his seven year study.
Current 1-Month Russell Anomaly Results
It is too soon to draw conclusions from many of the published anomalies in the financial literature, but the results in the first month test are showing very strong validation of several documented abnormal returns.
1. Cai and Houge (2018) study focused more on the 1-year returns and supports my previous research articles that various index anomalies do not typically sustain beyond six-months. The Russell 2000 index is up +10.75% in a very strong July start that may later support their research that a 1-year buy/hold approach significantly outperforms the reconstitution anomaly portfolios in the long term.
2. Zdorovtsov, Tang, and Onayev (2017) research is strongly validated in my current test. The strongest results in their study were found out to the longest measured post-event period of 21 days. While they did not measure full month post-event results we can see that of the +10.75% gains in the Russell 2000 for July, nearly half the returns, +4.31% were achieved just in the past week. 3. Chinco & Sammon (2022) study is evaluated in much more detail in a separate section below due to the complexities involved in measuring the Rising 1000 portfolio and the Lowering 2000 portfolio explained below. The 1-month results are highly significant and validate their research in this measured time period.
4. The Madhavan (2003) seven year study observed very strong mean reversion between June/July in the pre-constitution period and post-event month. That effect is extremely clear in 2022 even if we did not apply the exact same portfolio test as published in the journal research.
FinViz.com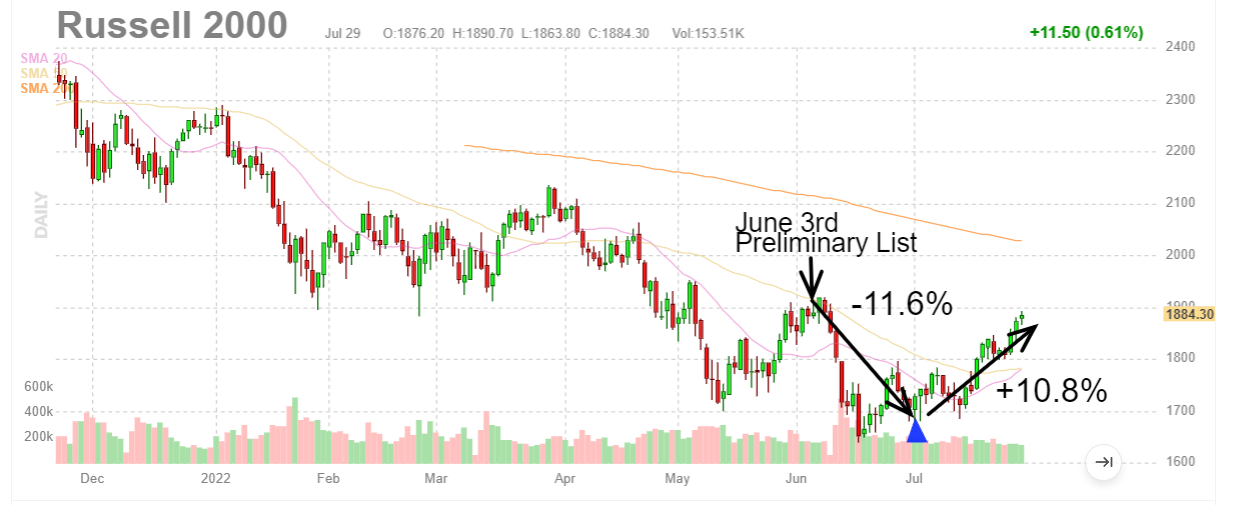
You can review some of the prior June/July mean reversion patterns from this long term chart and try to extrapolate possible future return patterns. The chart may support prior research that most anomalies tend not to sustain beyond six months.
FinViz.com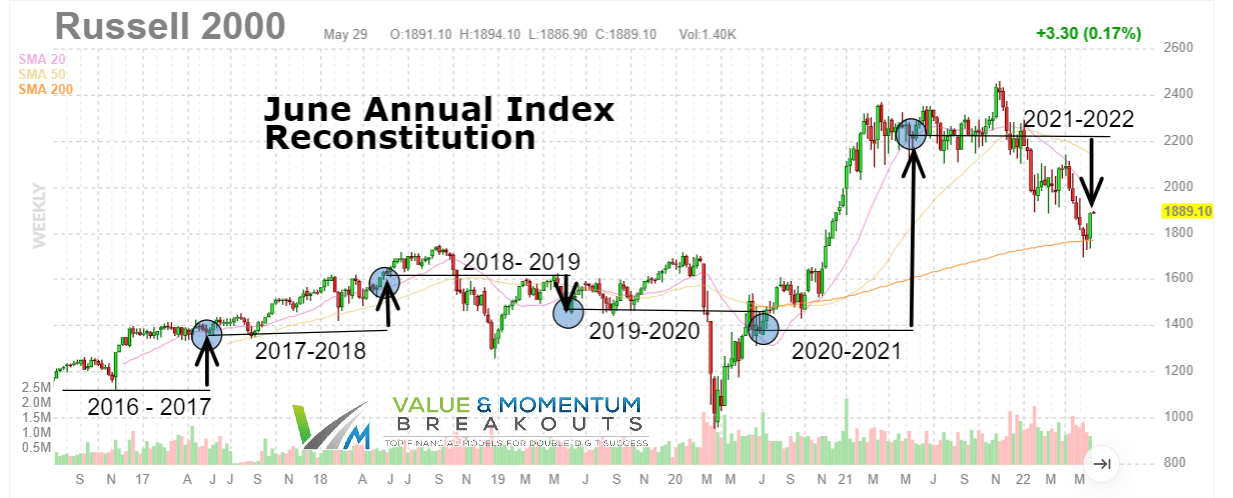
Chinco & Sammon (2022) results for July
The Chinco & Sammon (2022) study found statistically significant results that the stocks switching from the Russell 2000 to the larger cap Russell 1000 index greatly outperformed those stocks switching in the opposite direction on the reconstituted index.
Chinco & Sammon (2022)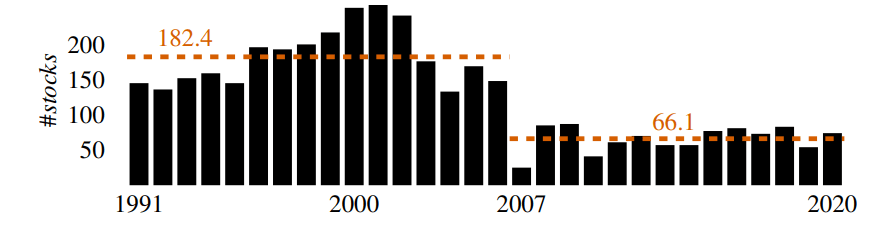
Since the 2007 FTSE/Russell bandwidth rule, there has been a significant decline in the average number of qualified switchers from 182 stocks down to 66 stocks. For 2022 only 50 stocks migrated between the two indices. To test the Chinco and Sammon research results I constructed two portfolios of the “Rising 1000 Index stocks” and the “Lowering 2000 Index stocks.” Comparing the two portfolio results are highly significant for July and clearly validate the published findings.
The Z-score test of the two populations different returns for July, delivered statistically significant results. The value of z is 2.7221. The value of p is .00652. The result is significant at p < .05.
The Rising 1000 portfolio had 18 out of 21 (85.7%) stocks with positive returns and average gains for July of +8.71%. The Lowering 2000 portfolio has 14 out of 29 (48.2%) stocks with positive returns and average July gains of +1.91%.
VMBreakouts.com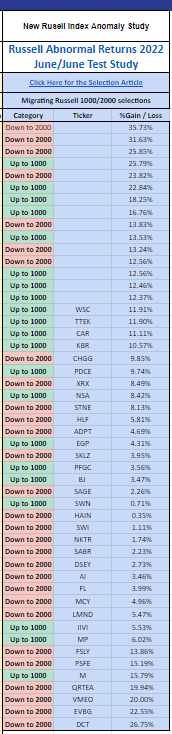
You can see clearly from the portfolio tracker just how negatively skewed the Lowering 2000 portfolio compares to the Rising 1000 index portfolio on the table above. These results strongly validate the Chinco & Sammon (2022) in the first month of testing. The best performing stocks are reserved for members of my community, but other top performers that should continue to do well include:
| Symbol |
Company Name |
1-month Return |
| (WSC) |
Willscot Mobile Mini Holdings Corp |
11.91% |
| (TTEK) |
Tetra Tech, Inc. |
11.90% |
| (CAR) |
Avis Budget Group Inc |
11.11% |
| (KBR) | KBR, Inc. | 10.57% |
| (CHGG) | Chegg Inc | 9.85% |
| (PDCE) |
PDC Energy Inc |
9.74% |
| (XRX) |
Xerox Holdings Corp |
8.49% |
| (NSA) |
National Storage Affiliates Trust |
8.42% |
| (STNE) | StoneCo Ltd | 8.13% |
| (HLF) |
Herbalife Nutrition Ltd |
5.81% |
| (ADPT) |
Adaptive Biotechnologies Corp |
4.69% |
| (EGP) |
EastGroup Properties Inc |
4.31% |
| (SKLZ) | Skillz Inc | 3.95% |
| (PFGC) |
Performance Food Group Co |
3.56% |
| (BJ) |
BJ’s Wholesale Club Holdings Inc |
3.47% |
| (SAGE) |
Sage Therapeutics Inc |
2.26% |
| (SWN) |
Southwestern Energy Company |
0.71% |
Conclusion
Many scholarly research studies have been published about reconstitution anomalies surrounding the FTSE Russell, S&P 500 and other major indices. The annual reconstitution process of the Russell index lends itself well to research and thorough analysis every June. Over the years I have tested many different published claims in a live market environment to see if members of my community can leverage these abnormal returns in their own portfolios. I hope this new research review among many since 2017 provides you with additional insight in your own trading!
All the very best!
JD Henning, PhD, MBA, CFE, CAMS
References
Cai, J. & Houge, T. (2018). Long-Term Impact of Russell 2000 Index Rebalancing. Long-Term Impact of Russell 2000 Index Rebalancing
Chinco, A. & Sammon, M. (2022). Excess Reconstitution-Day Volume. Available at http://dx.doi.org/10.2139/ssrn.3991200
Zdorovtsov, V., Tang, O. & Onayev, Z., Predatory Trading Around Russell Reconstitution (2017). Available at http://dx.doi.org/10.2139/ssrn.3021022
Be the first to comment