

da-kuk/E+ via Getty Images
Written by Nick Ackerman, co-produced by Stanford Chemist. A version of this article was originally published to members of the CEF/ETF Income Laboratory on June 9th, 2022.
Nuveen Real Asset Income and Growth Fund (NYSE:JRI) has been holding up relatively well this year. The fund’s exposure to energy and other infrastructure has a natural inflation hedge, boosting the performance. Unfortunately, the higher interest rates are hurting the fixed-income sleeve of this fund. It takes a hybrid approach to investing across the capital structure of companies. That being said, they have taken steps to mitigate some of the negative effects here.
The real estate exposure via REIT holdings has also been an additional downward pressure. Despite the natural inflation hedge of appreciating property values, they just haven’t been able to hold up well.
At the same time, the actual price performance of the fund has been lackluster relative to its total NAV return. This means that the fund continues to be heavily discounted in an environment when it has actually been performing better than the “market.” For context, I’ve included the YTD performance of SPDR S&P 500 ETF (SPY). It is not an appropriate benchmark.
Ycharts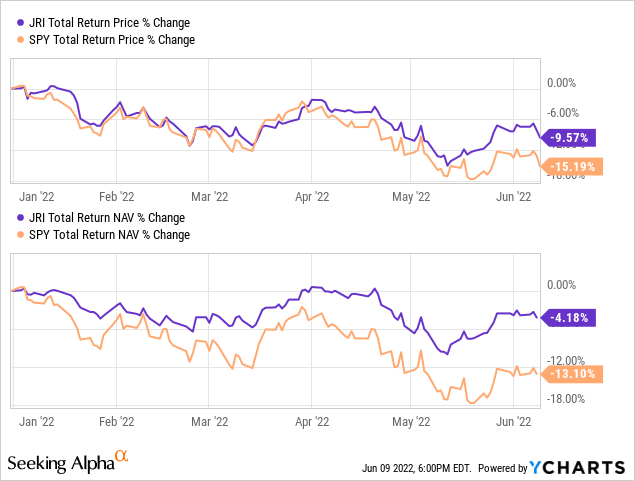
While negative returns are certainly not something we aim for, this fund would have offered some relief relative to the broader markets. Given the fund’s attractive discount, there could be some more upside potential too. At the very least, I don’t believe that we should see the discount widen significantly for a meaningful period from here, even if we experience further volatility.
The Basics
- 1-Year Z-score: -1.37
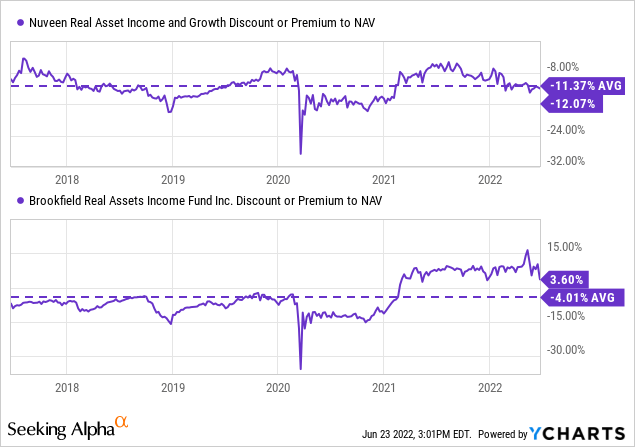
- Discount: 12.07%
- Distribution Yield: 9.08%
- Expense Ratio: 1.78%
- Leverage: 30.95%
- Managed Assets: $639.5 million
- Structure: Perpetual
JRI seeks “to deliver a high level of current income and long-term capital appreciation by investing in real asset-related companies across the world and the capital structure, including common stocks, preferred securities, and debt.” They define real asset-related companies as “those engaged in owning, operating, or developing infrastructure projects, facilities, and services, as well as REITs.”
Further, they invest “up to 40% of its assets may be debt securities, all of which may be rated below investment grade, though no more than 10% of its assets may be invested in securities rated CCC+/Caa1 or lower at any time. Non-U.S. exposure represents 25% to 75% of the Fund’s managed assets.”
As we mentioned above, this means they are quite flexible to invest where they see fit, as long as it is within the “real asset” space. The real asset space can be quite broad, including real estate/REITs and infrastructure plays through midstream companies and utility companies.
Leverage Discussion – Partially Hedged
The fund takes a fairly elevated approach to leverage. This has hurt them in the past, as I’ve discussed previously the 2020 COVID-pandemic crash and deleveraging more extensively. The logic here seems that since they have a meaningful allocation to bonds and preferred investments, higher leverage shouldn’t be a problem. Except, it did turn into a problem during the crash.
Since then, they’ve been boosting that leverage back up, but it isn’t quite where it was previously. This can be a double-edged sword. As underlying assets appreciate, it can certainly help generate excess returns. It works against the fund during downturns, as it amplifies the downside.
JRI Annual Report (Nuveen)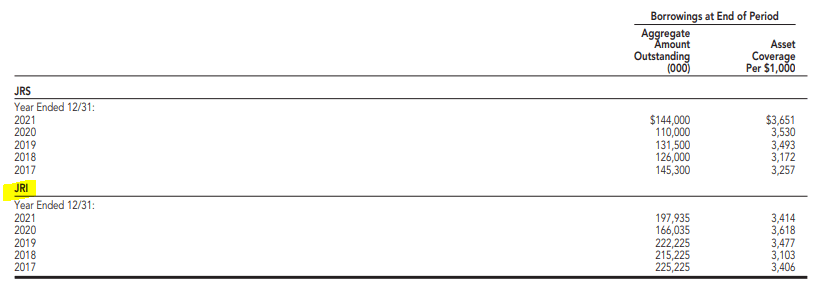
This is something to continue to watch. I wouldn’t complain if they let up on adding leverage into the fund if it continues to appreciate from here. That would naturally bring down that leverage ratio.
This is particularly noteworthy for an additional point that their borrowings are based on a variable rate of 1 month LIBOR plus 0.70%. They renewed their borrowings through July 20th, 2022. Since LIBOR is going away, it is most likely they will be based on SOFR (secured overnight financing rate) going forward when they renew again. This will also be something to watch going forward.
However, this being said, they aren’t completely exposed to the higher interest rates. This is because they are partially hedged with interest rate swaps.
JRI Annual Report (Nuveen)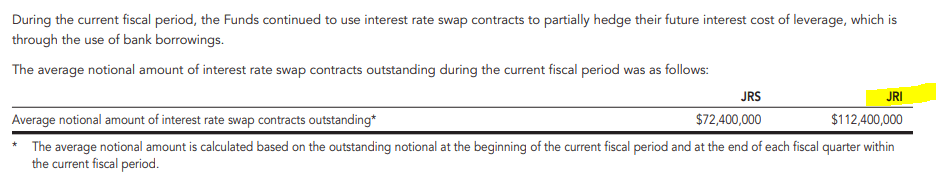
That being the case, when we look at the expense ratio of 1.78%, it goes to 2.14% when including the financing expenses. We often disregard this figure because, generally, this is a cost that improves returns going forward. Since they are partially hedged, the expenses shouldn’t rise as much, relatively speaking. The notional amount outstanding for their hedge was as of the end of fiscal 2021 – which lines up with calendar year-end. Meaning that this could be higher or lower at this point.
To sum up, I wish they would lighten up on some leverage. They’ve shown how it can be damaging when it is too high. At the end of the day, though, the higher the AUM, the higher the fees for the manager and sponsor. They are incentivized to run it right up to the limit.
Performance – Attractive Discount
We highlighted above that the fund had done fairly well on a YTD basis, at least relative to the market. However, to highlight the damage caused by 2018’s downturn and, in particular, 2020 deleveraging, we can look at the annualized returns. They aren’t necessarily going to be anything to write home about.
JRI Annualized Returns (Nuveen)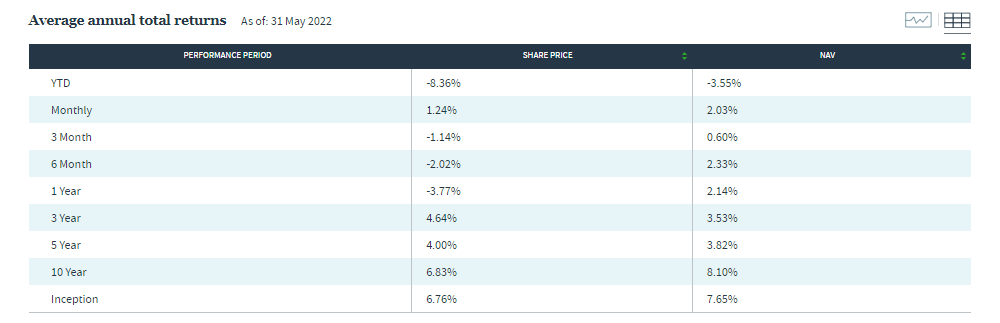
This is generally where most investors will turn away from the fund. When looking at the more recent annualized returns of three or five years, they have been lackluster compared to what we are used to seeing in other more diversified funds. That being said, there is another fund out there that is quite similar that we can compare. It, too, invests across the capital spectrum and in the real assets space. That is the Brookfield Real Assets Income Fund (RA).
When comparing the total NAV returns of these funds, we can see that they’ve come in quite similar over the last five years. On a total price return basis, RA has outperformed considerably. However, that has simply come from RA becoming expensive and JRI becoming incredibly cheap.
Ycharts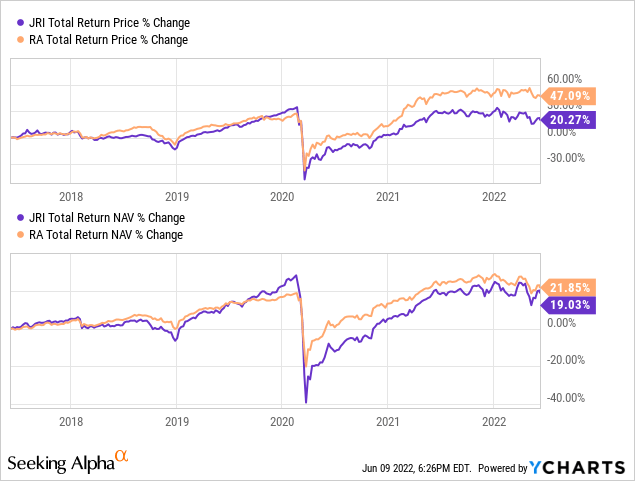
We can see the impact of that on a YTD basis too. JRI has performed slightly better than RA, but the share price has been performing much better. That has resulted in the appearance that RA has been the superior fund in this sort of niche space, but the portfolio hasn’t actually done any better.
Ycharts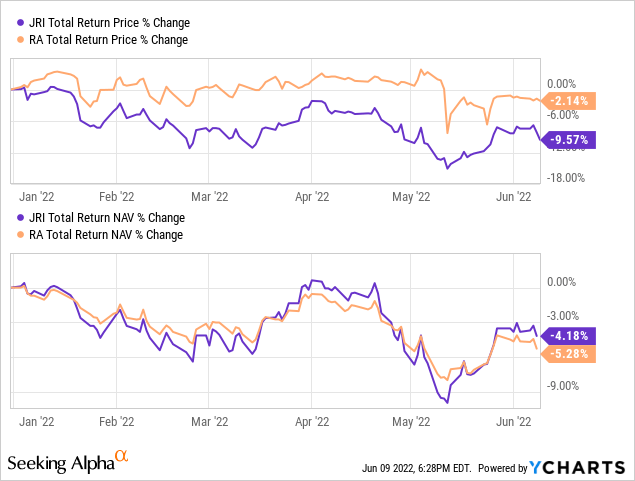
I held RA previously but would continue to be cautious at the current level. I fear the distribution yield is what is catching most of the investor’s attention. For what it’s worth, I believe both funds could do fairly well in the current environment.
Given the current valuations relative to their historical discount/premium, I think there is a clear winner here.
Distribution – Monthly Pay
The fund trimmed its distribution in 2020 and also on a couple of occasions in the 2015/16 area. That’s the other time when energy was taking a big hit, and it had impacted JRI with its weighted exposure to that sector.
JRI Distribution History (CEFConnect)
The latest distribution yield comes to 9.08%. On a NAV basis, it works out to 7.99%. Given these reasonable levels and the fund holding up relatively well, I don’t see a need to cut the distribution.
To some degree, they rely on capital gains to cover their distribution, but net investment income coverage comes in at a strong 86% in their last report. We covered their coverage for the 2021 year previously. They aren’t reporting their next Semi-Annual Report for a couple of months yet.
For tax purposes, the bulk of JRI’s distribution over the last two years has been ordinary income, and return of capital has also been present.
JRI Annual Report (Nuveen) Taking a look at the more detailed breakdown provided for 2021, we can see that 36.58% was ordinary income, 43.69% qualified dividend income, 12.11% section 199A income, and then 7.62% return of capital. This seems to be one of those funds that wouldn’t be a bad idea if you can hold it in a tax-sheltered account. At the same time, a sizeable portion is classified as qualified dividends that can reduce an investor’s tax obligations in a taxable account.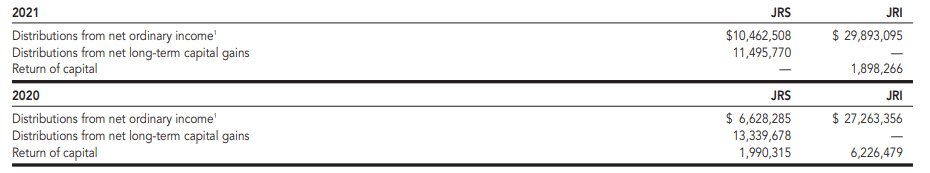
JRI’s Portfolio
It’s always worth noting that JRI is very active in its portfolio. The turnover reported last year was 73%. That was a quiet year as it reached up to 102% in 2020 and 100% turnover reported in 2017.
The portfolio breakdown is led by infrastructure and real estate common stock. It is then closely followed by infrastructure preferred exposure. To a lesser degree, we have infrastructure debt, real estate preferred and real estate debt. While minor relative to the leading asset compositions, those three areas are still quite meaningful in combination.
JRI Asset Allocation (Nuveen)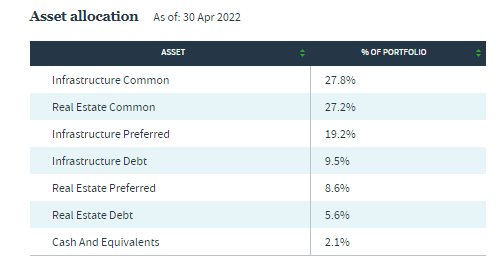
Preferred and bond exposure is going to be sensitive to interest rate increases. I believe that is what is negating some of the upside potential that we should otherwise be seeing. In addition to that, we know that the real estate sector hasn’t been performing all that well in 2022. Taking a look at the Real Estate Sector SPDR (XLRE), we are down over 18% on a total return price basis.
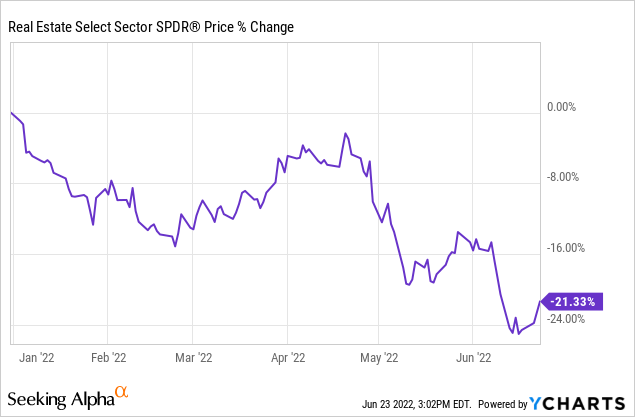
So while the fund is fighting against that, it still has the largest exposure in terms of sectors to pipelines and electric and gas utilities.
JRI Top Sectors (Nuveen)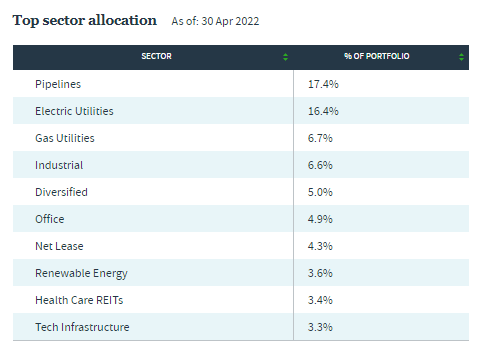
Energy and utilities, at this point, are the leaders for the year. Though utilities have slipped into negative territory more recently.
U.S. Equity Sectors (Seeking Alpha)
Switching over to look at the credit quality of the fixed income portion of the portfolio, we actually see an interesting split between investment grade and below-investment grade. Again, this highlights why higher leverage shouldn’t be a problem in theory, but we know it was an issue in practice.
JRI Credit Quality (Nuveen)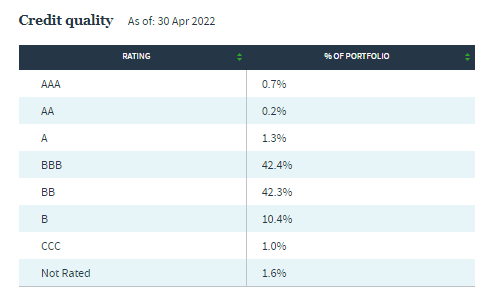
To be clear, it is only one rung into the investment-grade category but is investment-grade nonetheless. Given that exposure, it is natural for JRI to have a relatively higher interest rate sensitivity relative to something that was holding only junk. Especially when we take a look at the maturity breakdown, with a high allocation to 30+ year bonds, that’s significant.
JRI Maturity Breakdown (Nuveen)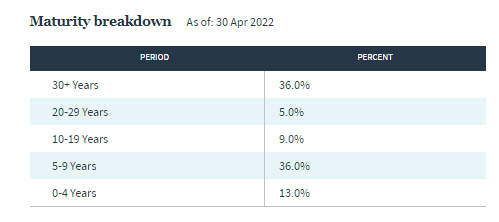
Summing it all up, the average effective duration is 1.94 years. Lower than I would have assumed at first, just based on the maturity and the credit quality.
Nuveen Fund Characteristics (Nuveen)
Looking at their portfolio closer in their last Annual Report, we can see around 7% is in convertible preferred, convertible bonds and senior loans. These types of securities are less interest-rate sensitive.
They are also short future contracts of U.S. Treasuries; as prices decline, these contracts will offset some of the declines from their fixed-income sleeve. I believe that is why we see such a low effective duration for the fund.
Looking at the top ten holdings, it appears that they don’t make up an overwhelming allocation to the fund.
JRI Top Ten (Nuveen)
Given that they have 466 total positions, this would make sense. The top ten is also loaded up with pipeline and utility names, which would coincide with the sector breakdown of the fund too.
That being said, we also see VICI Properties (VICI) in there, the one REIT showing up as the top allocation and not being an energy infrastructure company or utility company. However, the position doesn’t look out of place at all, given the real asset approach of JRI. It also is a strong yielding REIT, which is another characteristic of these top ten; either higher-yielding investments or histories of regular dividend raises.
Conclusion
JRI has an attractive and reasonable yield; the discount is quite attractive at this time too. The discount isn’t as deep as it has been before but is right around its average of the last five years. Given the discount has widened considerably already to this level, further widening could be limited despite the greater market volatility we have been experiencing. At the same time, the portfolio it is holding has been working in its favor to hold up relatively well. The performance detractors seem to come from the real estate sector and fixed-income exposure primarily.
Be the first to comment