


Richard Drury
Author’s note: This article was released to CEF/ETF Income Laboratory members on August 29th, 2022.
The SPDR S&P 500 Trust ETF (NYSEARCA:SPY) is the largest, most well-known ETF in the market, tracking the S&P 500, the benchmark U.S. equity index. SPY invests in most large-cap U.S. equities, which comprise most of the U.S. equity market. The fund’s total returns are outstanding, but its dividend yield is a meager 1.5%. Valuations are currently at historically average levels, perhaps a bit elevated.
The iShares Russell 2000 ETF (NYSEARCA:IWM) is a smaller, less well-known ETF. It tracks the Russell 2000, the benchmark U.S. small-cap equity index. IWM invests in most small-cap U.S. equities, which comprise a small, unrepresentative section of the broader U.S. equity market. IWM has outperformed SPY since inception, but returns are volatile, and performance inconsistent. IWM also yields a meager 1.2%. Valuations are currently at historically below-average levels, although conditions are in flux.
In my opinion, IWM’s stronger performance track-record and slightly more competitive valuation make it the better buy. Nevertheless, IWM is a riskier, less diversified choice, and so might be less appropriate for more risk-averse investors.
Index Comparison – No Clear Winner
SPY – S&P 500 Index Fund
SPY tracks the S&P 500 index, the benchmark U.S. equity index.
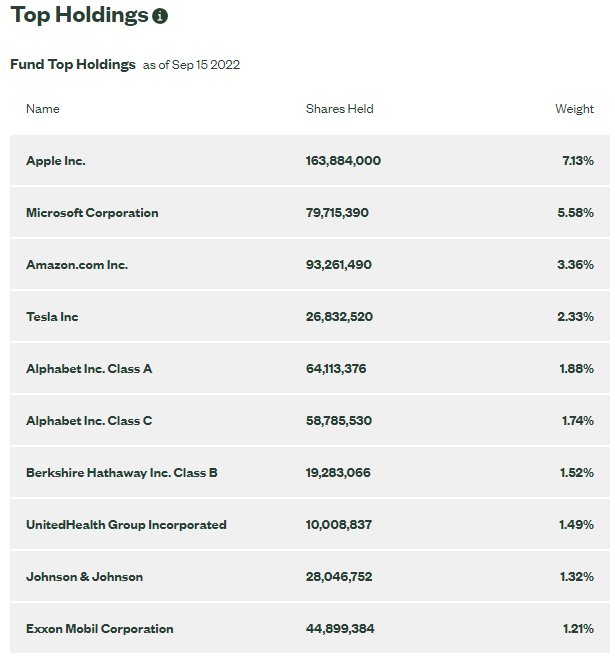
It is a relatively simple index, and includes the 500 largest U.S. companies, subject to a basic set of quantitative criteria. It is a market-cap weighted index, so larger companies have greater weights. Currently, this mostly means mega-cap tech stocks, including Apple (AAPL), Microsoft (MSFT), and Google (GOOG). SPY’s largest holdings are as follows.
SPY
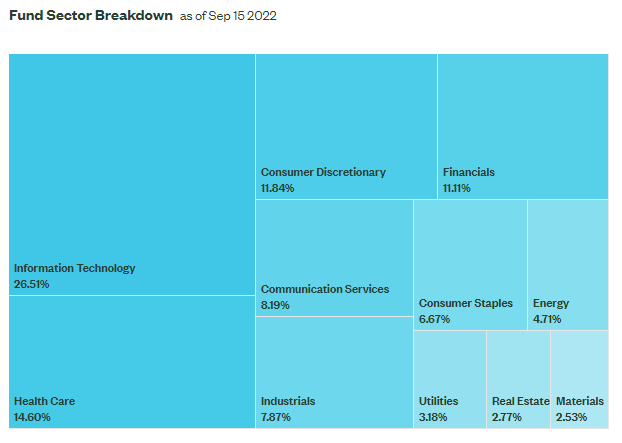
The S&P 500 is an incredibly well-diversified index, with exposure to hundreds of securities from all relevant industry segments. The index is somewhat overweight tech, due to the aforementioned mega-cap tech stocks. Industry exposures are as follows.
SPY
SPY’s holdings cover 75% of the U.S. equity market, by market-cap. Only notable exclusion is mid-cap and small-cap companies, but these are comparatively small companies, encompassing just 25% of the market.
In general terms, the S&P 500 adequately tracks the U.S. equity market, sans the aforementioned smaller, less representative companies. As such, the fund could function as a core portfolio holding, even as an investor’s only equity holding. Mid-cap, small-cap, and international exposure would be ideal, but is not strictly necessary, in my opinion at least.
IWM – Russell 2000 Index Fund
IWM tracks the Russell 2000 index, the benchmark small-cap U.S. equity index.
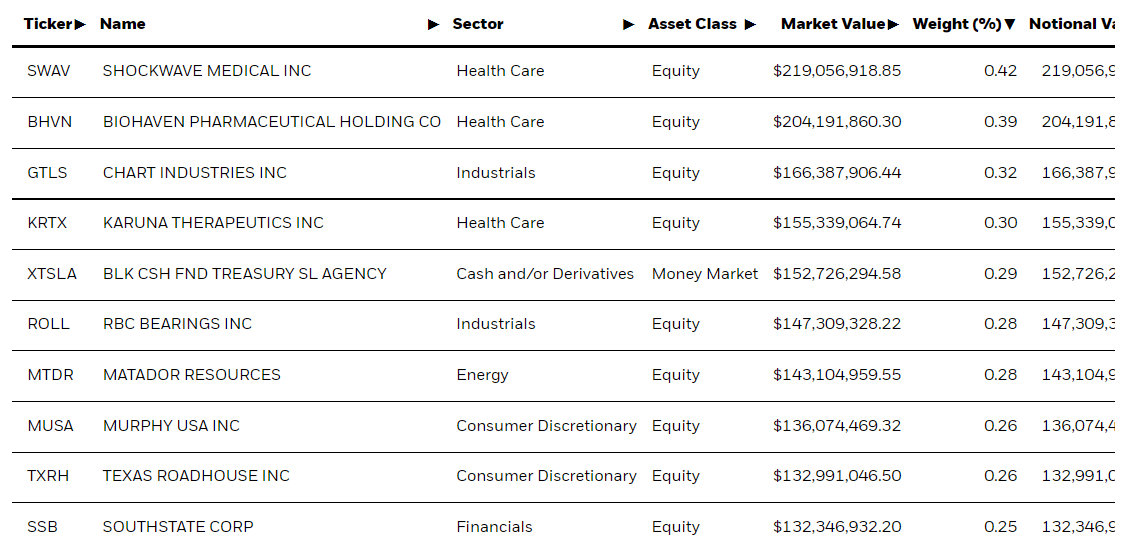
It is a simple index, investing in U.S. companies ranked 1001st-3000st by market-cap, subject to a basic set of inclusion criteria. So, the index starts with the 3000 largest companies, excludes the 1000 largest, and invests in the rest. IWM’s holdings are mostly less well-known mid-cap and small-cap U.S. companies. Largest holdings are as follows, I only recognize one name, Matador Resources (MTDR).
IWM
IWM is also a reasonably well-diversified fund, with exposure to thousands of securities from all relevant industry segments. IWM’s industry exposures are more evenly distributed relative to the S&P 500, due to the exclusion of mega-cap tech stocks. Industry exposures are as follows.

IWM
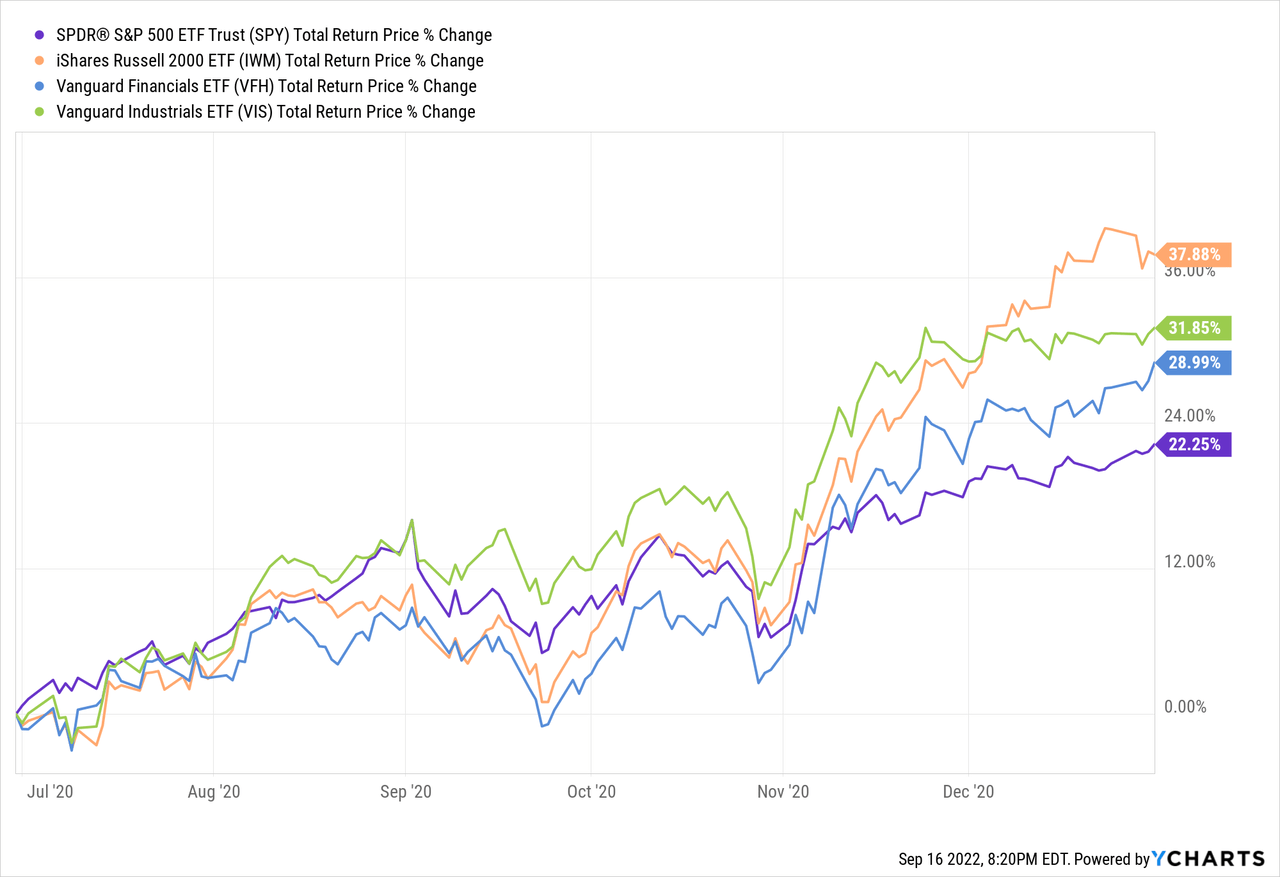
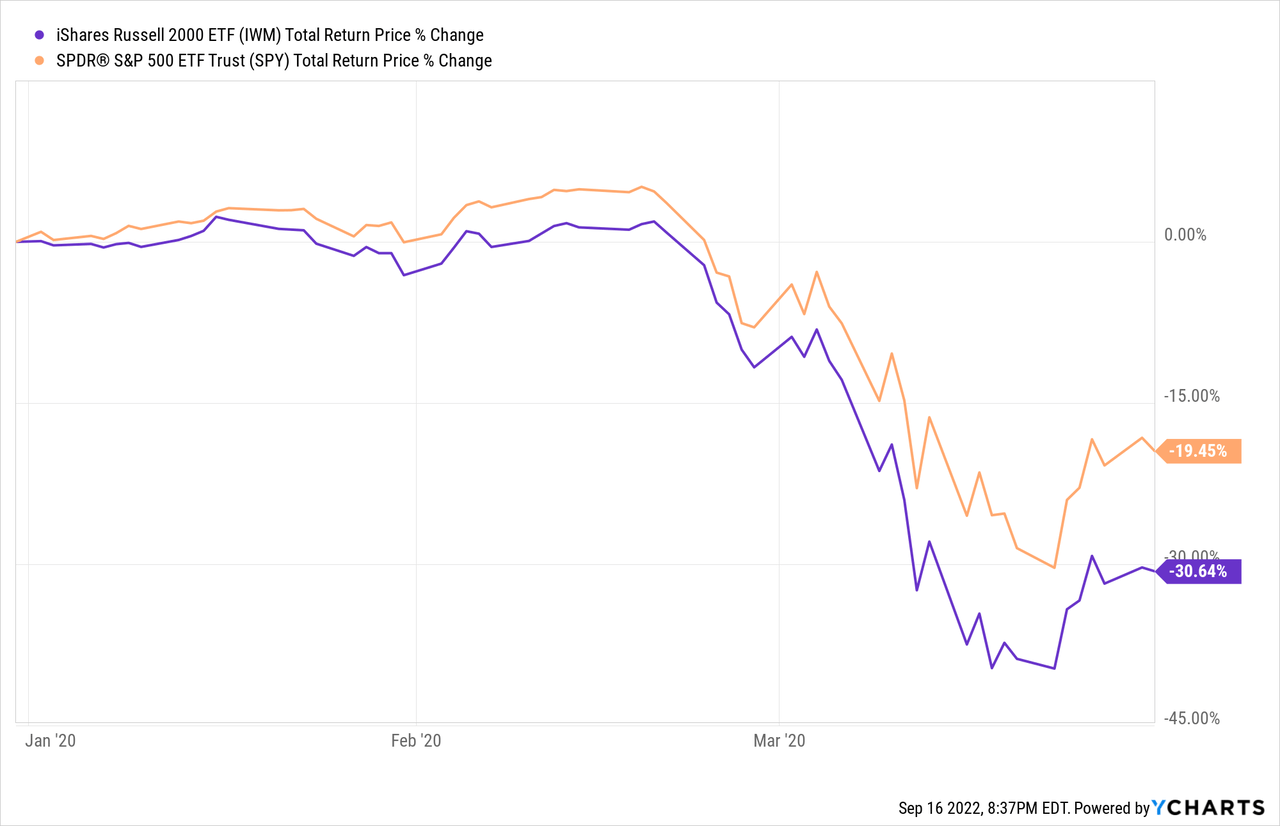
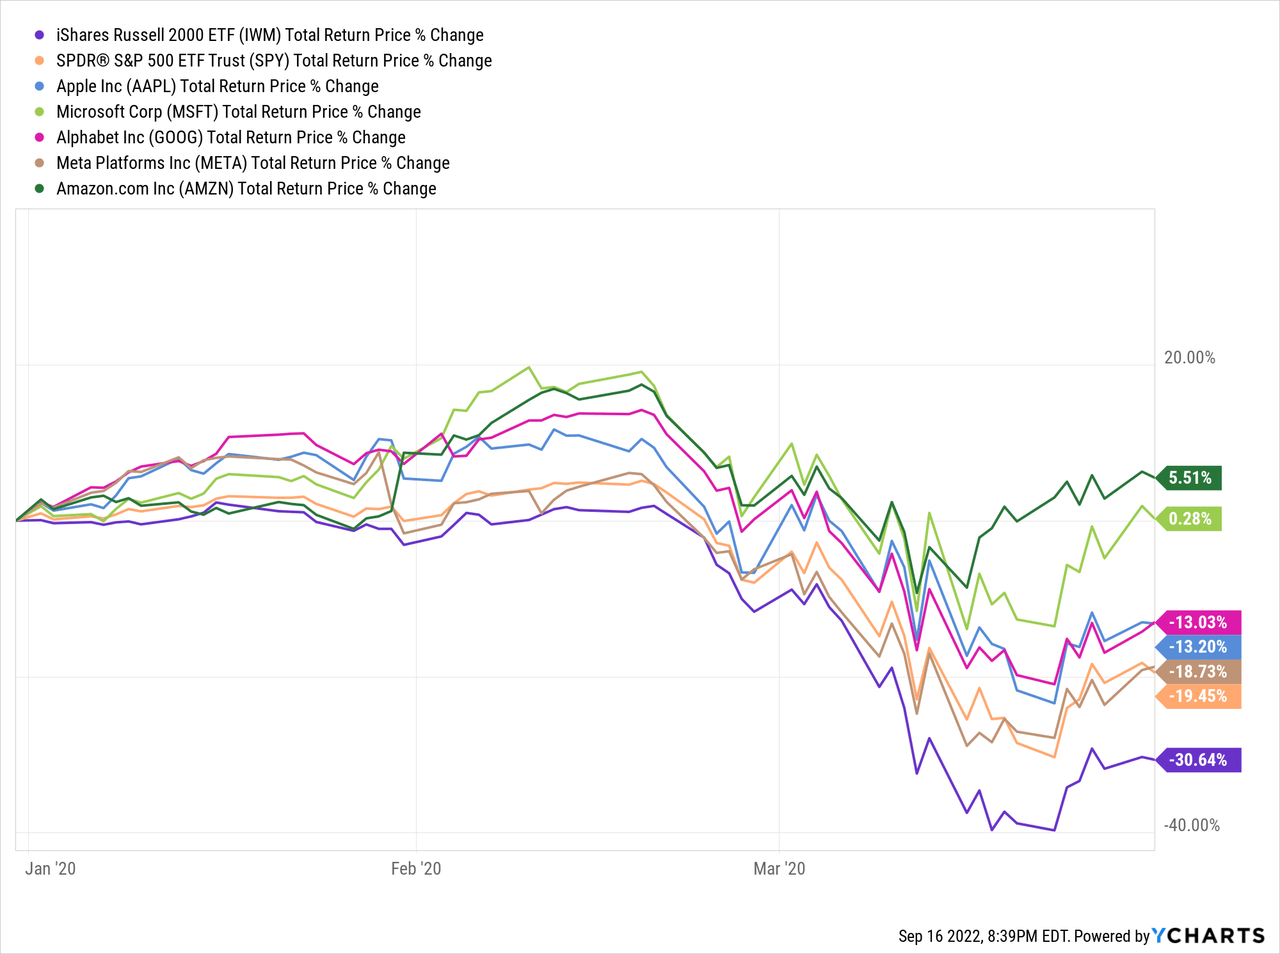
In general terms, SPY leans more towards high-growth tech names, while IWM leans more towards old-economy industries and companies. As such, the relative performance of these two funds is somewhat dependent on the relative performance of these sectors. SPY tends to outperform when tech outperforms, as was the case during the first half of 2020, the onset of the coronavirus pandemic.
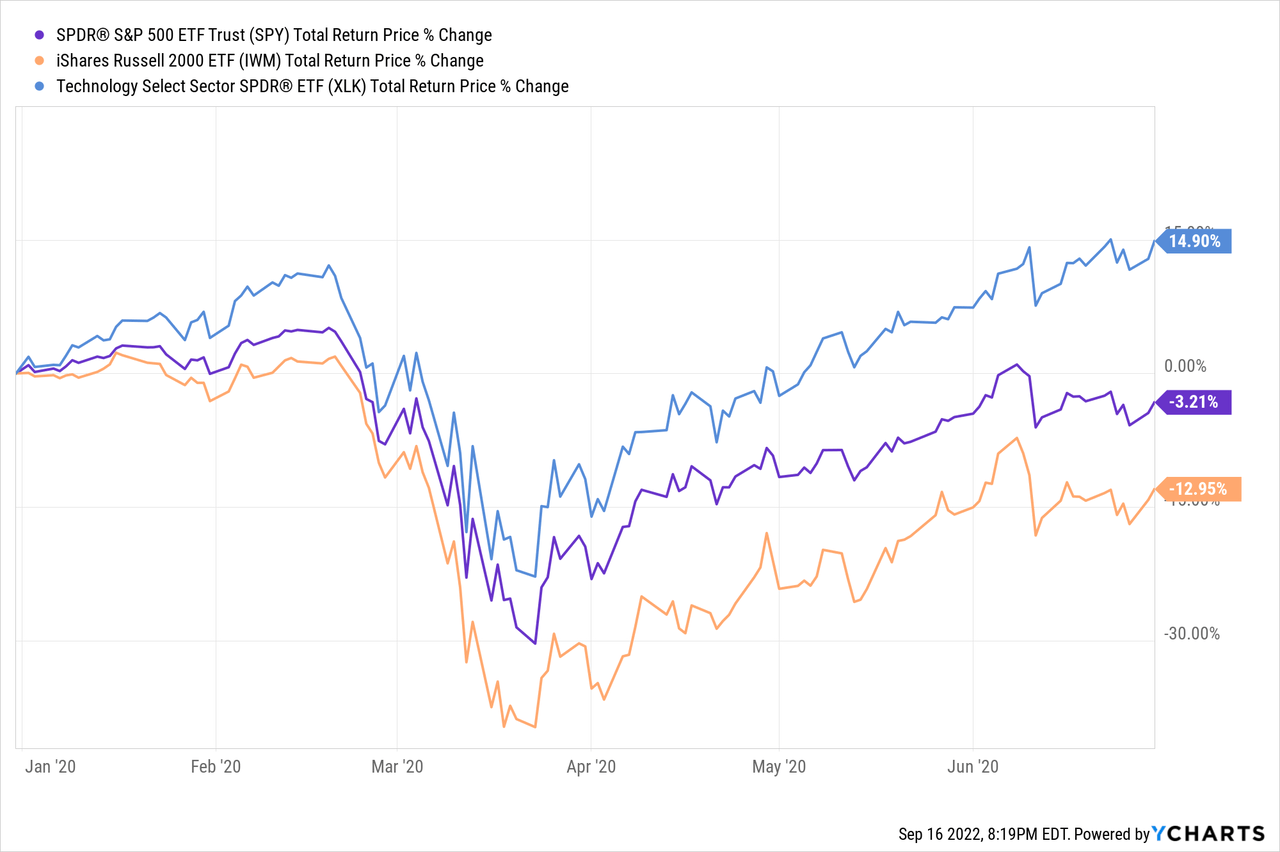
IWM tends to outperform when old-economy industries outperform, as was the case during the second half of 2020, as economic conditions and investor sentiment improved.
IWM’s more balanced holdings means performance is less dependent on the performance of a specific industry, or small number of holdings. SPY, on the other hand, is somewhat more dependent on the performance of mega-cap tech stocks. As such, and in my opinion, IWM’s more balanced holdings are a positive for investors, and an advantage relative to SPY. It is a small advantage, both funds are very diversified, but an advantage nonetheless.
IWM’s holdings cover approximately 25% of the U.S. equity market, by market-cap. This is a much lower percentage when compared to SPY, which covers 75% of the market. IWM cannot be said to track the broader U.S. equity market, as the fund simply lacks exposure to most of the same. In my opinion, IWM is diversified enough that it could function as a core portfolio holding, but exposure to large-cap equities is incredibly important, and so investing in other equity funds besides IWM is necessary.
As IWM does not invest in most U.S. equities, it cannot be said to track U.S. equity markets, and so fund performance could materially differ from the same. If the U.S. stock market goes up, then SPY will go up, because SPY more or less is the U.S. stock market, but the same is not necessarily true for IWM, an important fact for investors to consider.
In my opinion, and considering the above, SPY is a more appropriate investment for investors desiring greater diversification, market exposure, and market average returns. If you are looking for a fund with broad-based exposure to U.S. equities as a whole, SPY is the more appropriate choice, in my opinion at least. IWM is a bit more targeted, with more niche holdings, and so less appropriate for these investors.
Performance Comparison – IWM Winner
Both funds have similar performance track-records, as both invest in the same assets: diversified U.S. equities. Performance track-records for both funds are quite strong, as U.S. equities have seen outstanding returns for decades, especially since the financial crisis of 2008-2009. U.S. equities are probably the best asset class in the world, and these are both strong, diversified U.S. equity funds, with the performance one would expect from such a fund.
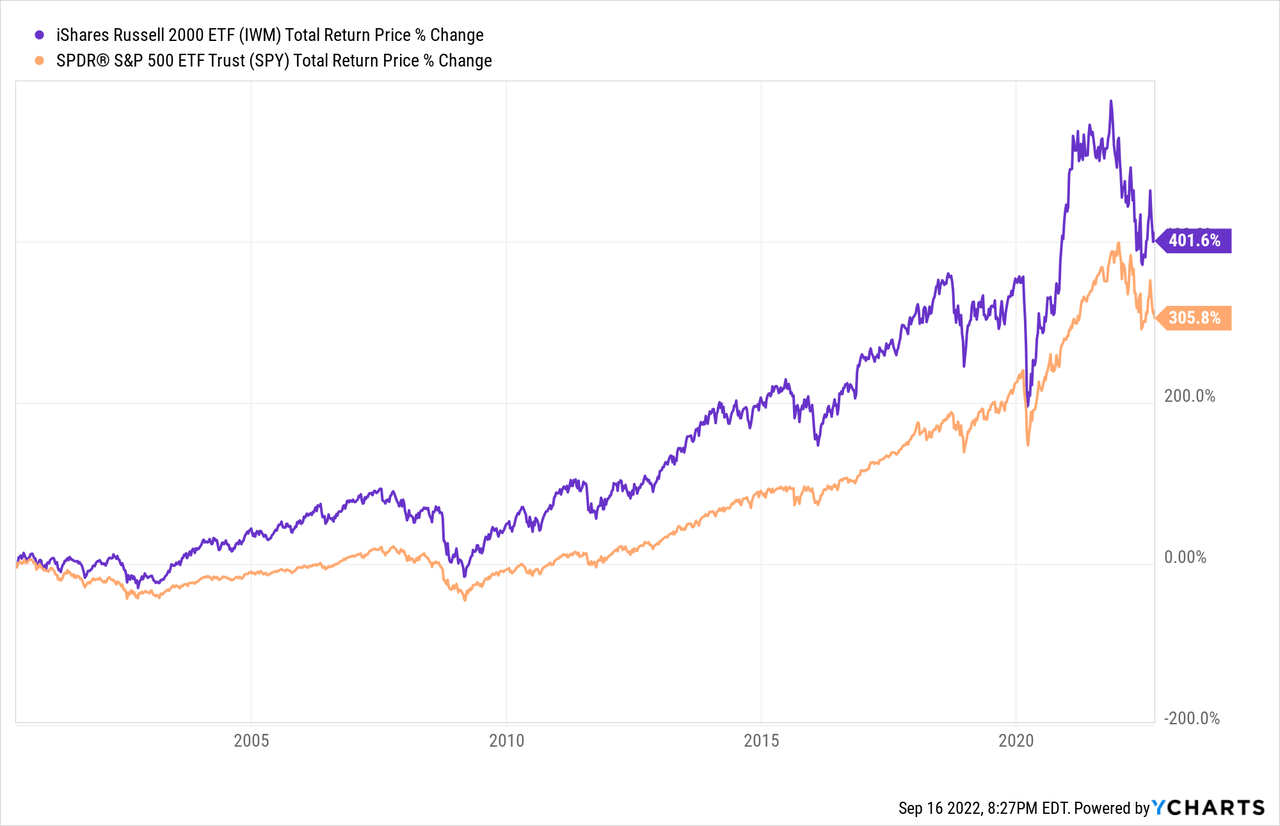
IWM’s long-term performance track-record is slightly stronger than that of SPY. IWM has outperformed SPY by about 1% since inception, in early 2000. Small differences in annual performance compound through the years, leading to significant differences in total long-term performance. That 1% in annual returns compounded into almost 100% in total returns during the past two decades or so, an incredibly large, significant difference.
IWM’s stronger long-term returns are due to the fund’s small-cap equity focus. Research has shown that there exists a size premium for U.S. equities, with smaller companies generally outperforming their larger peers. As an example, MSCI consistently finds that (smaller) size is a strong predictor of future returns:
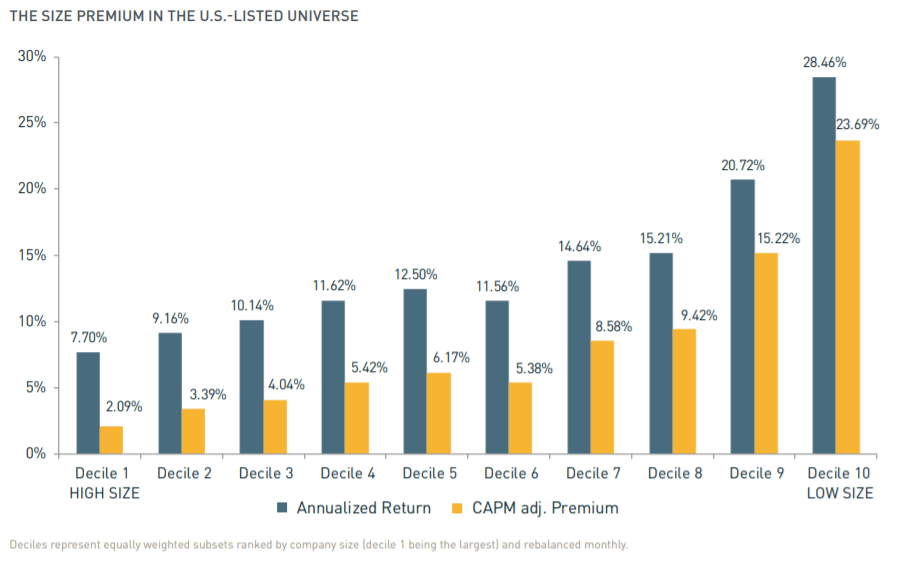
MSCI
MSCI has also shown that portfolios constructed so as to focus on small-cap equities consistently outperform the broader equity universe, albeit at a higher level of risk:
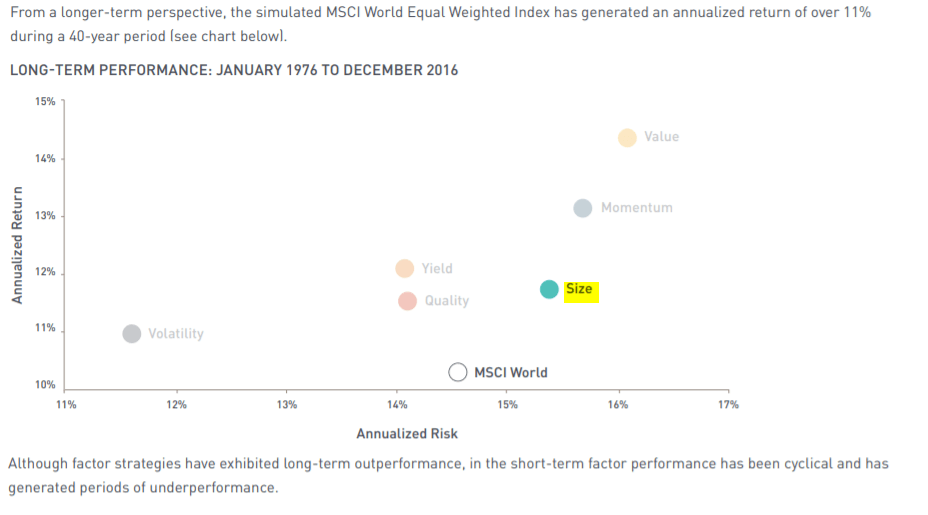
MSCI
Small-caps outperform for two key reasons.
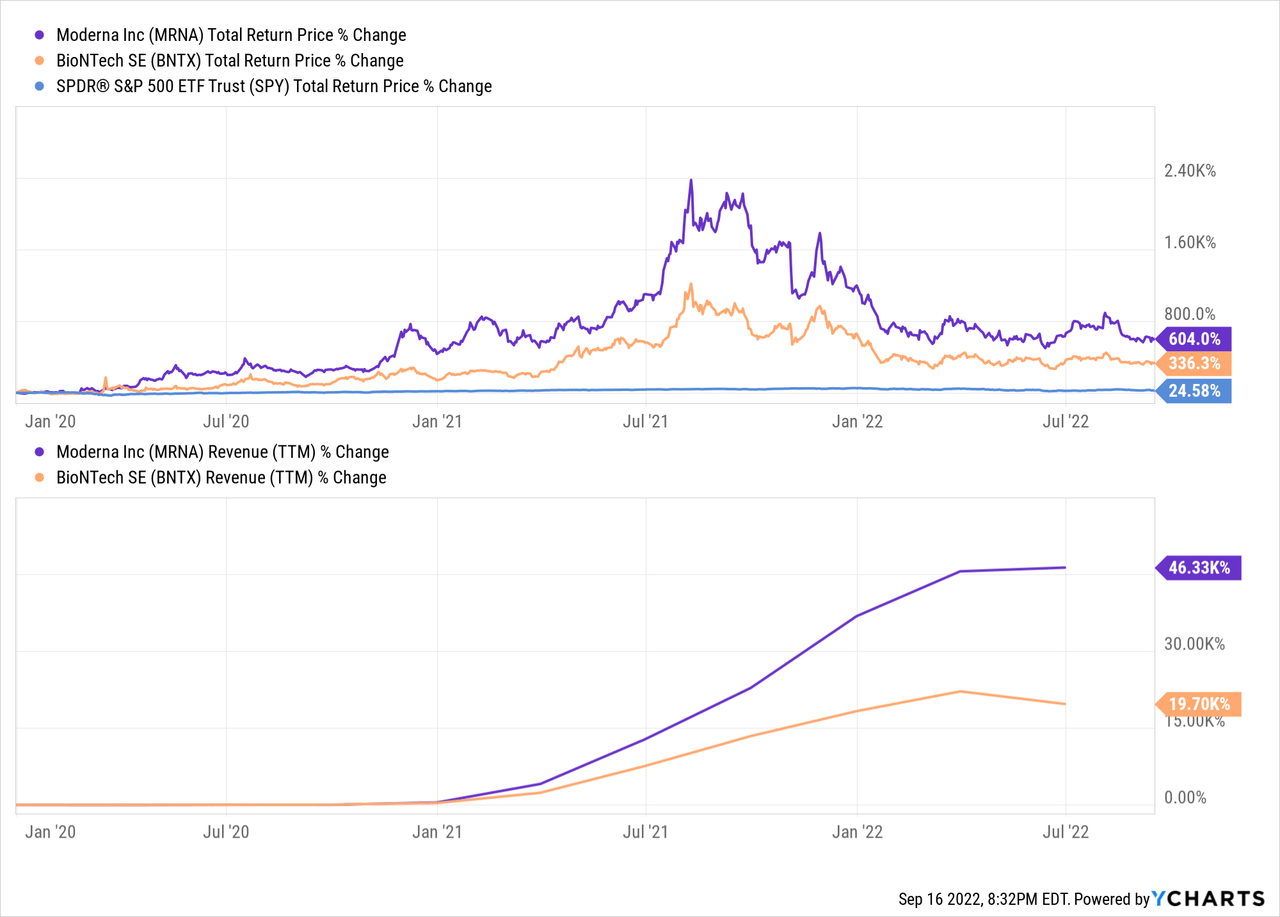
Small-caps can, potentially, see much higher growth rates than large-caps, due to their small size/low starting base. As an example, when Moderna (MRNA) and BioNTech (BNTX), two erstwhile small-caps, successfully developed a coronavirus vaccine, their revenues shot up by more than 10,000%. Growth was partly due to the great need for vaccines to stem the tide of the pandemic, and partly due to the fact that these were relatively small companies, with few products and sales before the vaccines. Outstanding growth led to outstanding shareholder returns, with both companies significantly outperforming since 2020.
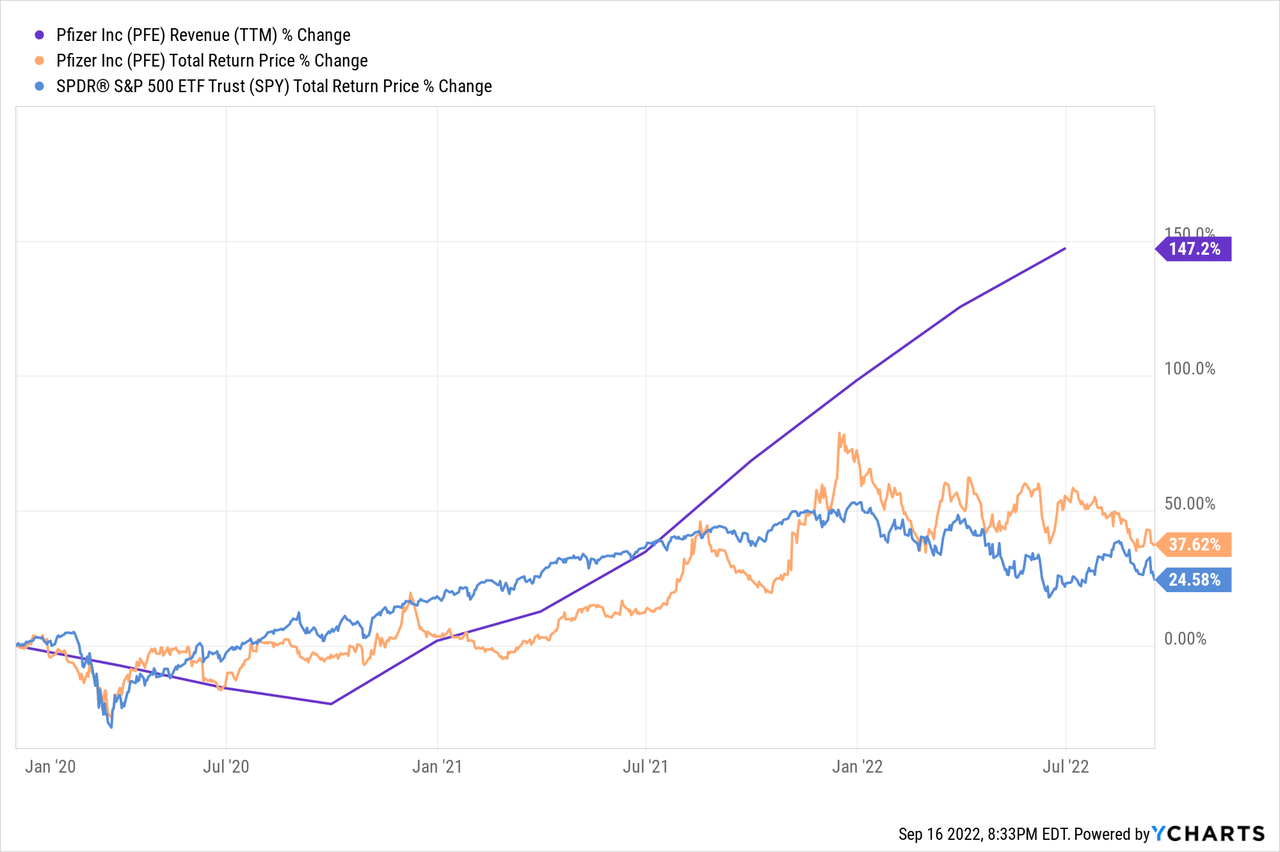
Pfizer (PFE) co-developed one of the vaccines with BioNTech, but saw much lower growth rates, as the vaccine was simply a much smaller part of the company’s portfolio. Pfizer did benefit from co-developing the vaccine, but the impact was much more muted, and did not necessarily lead to outperformance.
Small-caps also outperform as these companies are (rightfully) perceived as risky, and so tend to trade with comparatively cheap valuations. Cheap valuations means higher returns, all else equal, so cheap small-caps tend to outperform expensive large-caps, and IWM tends to outperform SPY.
IWM’s slightly stronger performance track-record is a benefit for all investors, particularly important for long-term buy-and-hold investors, and a key advantage of the fund relative to SPY. As IWM’s stronger performance is based on fundamental fund characteristics, outperformance is set to continue, in my opinion at least.
Although IWM tends to outperform relative to SPY, it does not do so consistently. During most time periods, both funds have broadly similar performance, as was the case from 2010 until 2018.
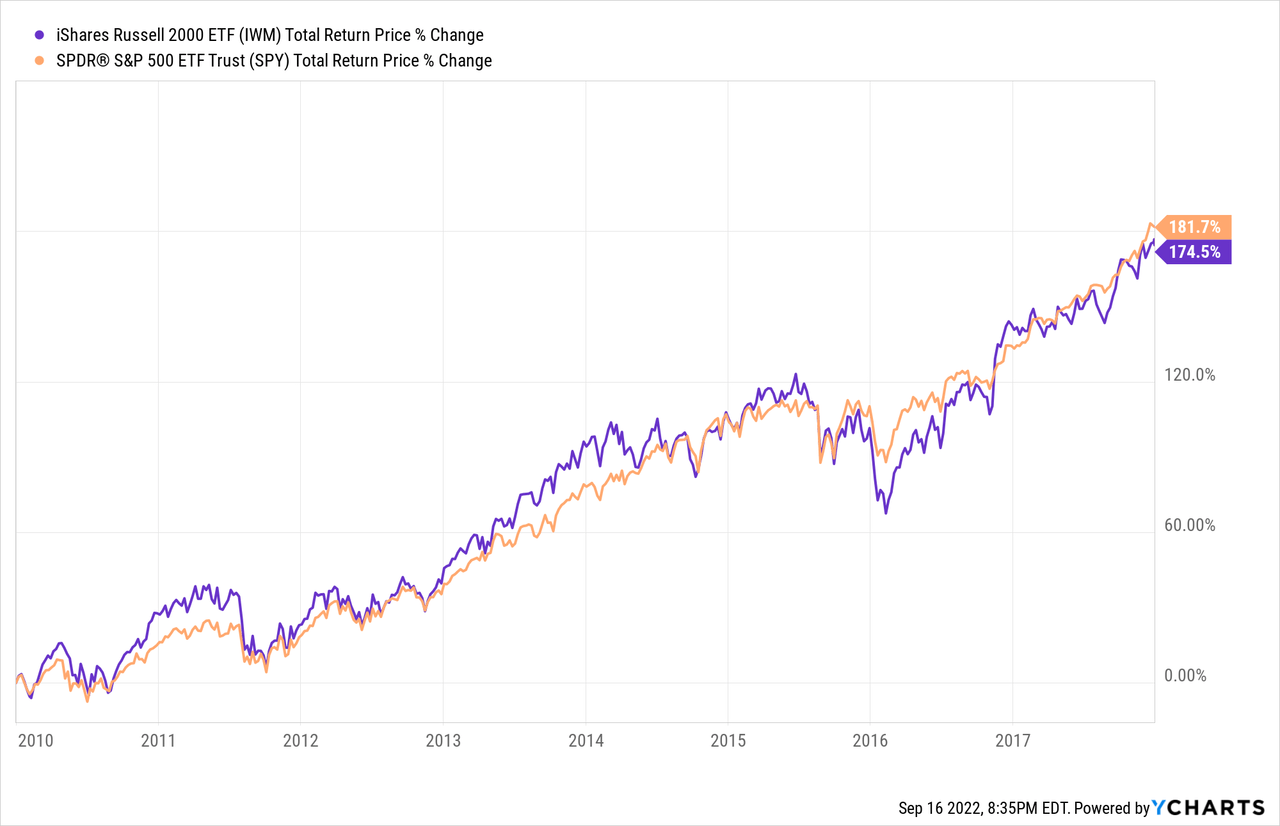
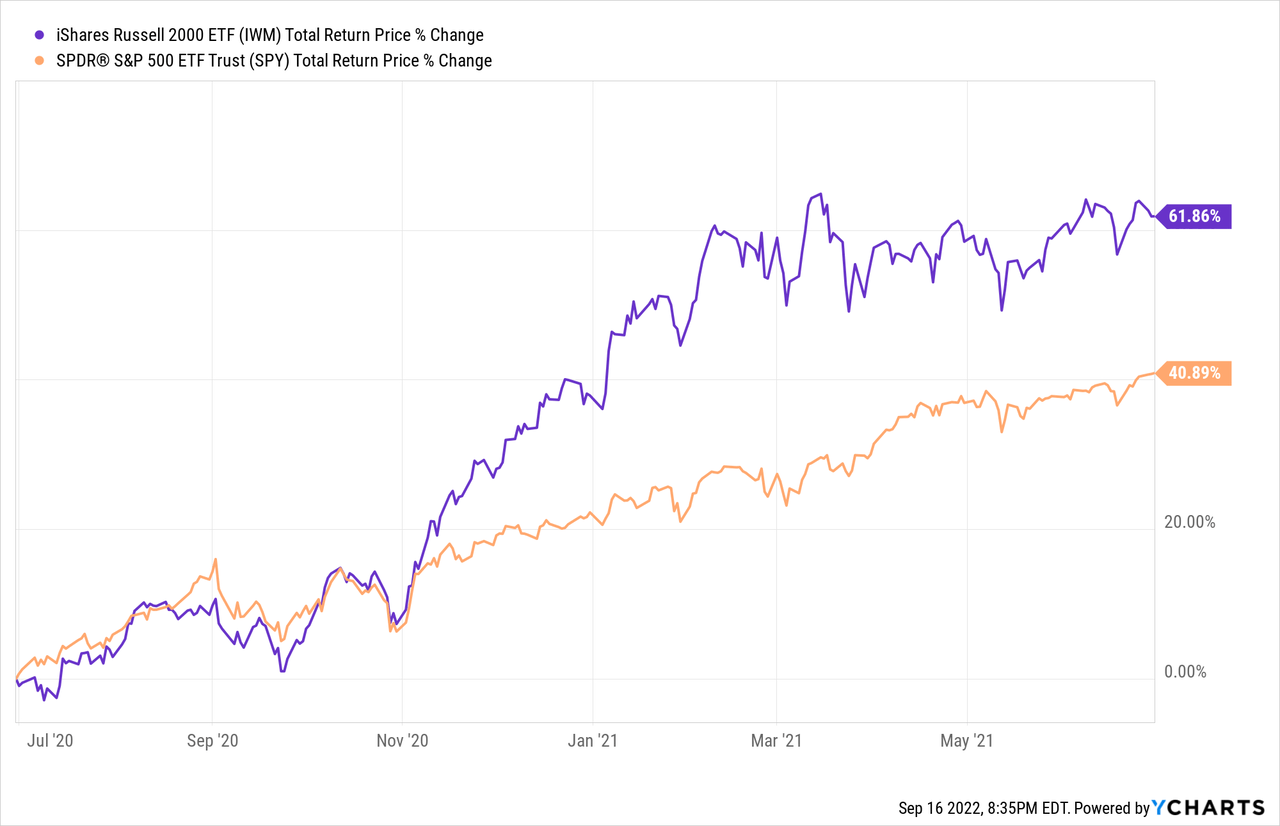
Sometimes SPY outperforms, and as with IWM, these periods tend to be short, and somewhat random, due to shifting investor sentiment. Reversals are common too, for the same reason. As an example, SPY outperformed from mid-2019 to mid-2020, but underperformed in the time period immediately after (see above).

IWM does tend to outperform SPY in the long-term, but it does not do so consistently.
IWM’s performance is also somewhat more volatile, more inconsistent, than that of the SPY, for two reasons.
First, IWM focuses on smaller companies, which tend to be riskier than SPY’s larger, more mature large-cap holdings. Smaller companies tend to have less diversified revenue streams and weaker balance sheets, and so have more difficulties navigating recessions and downturns. Smaller companies are also perceived to be riskier by most investors, and so tend to see higher selling pressure and above-average losses during bear markets. For example, IWM underperformed during 1Q2020, the onset of the coronavirus pandemic.
Second, IWM only invests in 25% of U.S. equities by market-cap, while SPY invests in 75% of the same. IWM excludes many important companies from its holdings, which means the fund could underperform if a portion of these perform particularly well. That was the case during 1Q2020, during which mega-cap tech stocks outperformed the broader U.S. equity market. SPY holds these companies, which helped the fund weather the downturn. IWM does not hold these companies, and so suffered above-average losses.
Remember, IWM only invests in 25% of U.S. equities by market-cap. The fund is missing most U.S. equities from its holdings, so there is always the risk that the fund is excluding the best-performing U.S. equities from its holdings. SPY invests in 75% of U.S. equities by market-cap, so this is less of a concern.
In other words, SPY invests in most of the U.S. equity market, so it will almost certainly achieve market-like returns. IWM invests in a relatively small section of the U.S. equity market, and so the fund will not necessarily achieve market-like returns, opening the door to underperformance, losses, and the like.
Valuation Comparison – IWM Winner
IWM currently sports a PE ratio of 13.7x, and a PB ratio of 2.0x. Both figures are below-average on an absolute basis, and lower than those of SPY, with a PE ratio of 20.7x, and a PB ratio of 4.0x.
As per J.P. Morgan, small-cap U.S. equities (IWM) are currently trading with historically below-average valuations, while large-cap U.S. equities (SPY) are trading with average valuations.
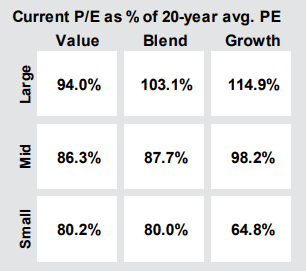
J.P. Morgan Guide to the Markets
IWM’s comparatively cheap valuation could lead to above-average capital gains and market-beating returns if valuations were to normalize. This is a significant benefit for the fund and its shareholders, and a key advantage of the fund relative to SPY. IWM has outperformed relative to SPY since inception, so there is definitely precedent for said gains, but I’m not seeing a potential catalyst. I still believe that IWM’s cheap valuation will ultimately lead to strong gains and returns, but have no reason to believe these will materialize any time soon.
Income Comparison – SPY Technical Winner
Both funds offer investors strong potential total returns, but mediocre yields.
SPY currently yields 1.5%, slightly higher than IWM’s 1.2% yield. Although SPY does yield a bit more than IWM, the difference does not materially impact the fund’s overall value proposition or viability as an income vehicle.
Both funds offer investors reasonably strong dividend growth track-records. SPY’s dividends have grown at an 8.3% CAGR for these past ten years, 7.2% for IWM. Although dividend growth figures are reasonably good, starting yields are so low that even long-term investors see subpar yield on cost figures. As per SeekingAlpha, SPY sports a 10Y yield on cost of 4.1%, IWM a 2.6%. Although SPY’s dividends do grow a bit faster relative to IWM, the difference is not material, in my opinion at least.
Both IWM and SPY are capital gains/total return investments, and broadly unsuitable for income investors. SPY does offer investors a slightly higher yield, and slightly stronger dividend growth track-record, but the fund remains a broadly unsuitable income vehicle. As such, I do not believe that these are material benefits for SPY and its investors, nor a material advantage of the fund relative to IWM.
Conclusion – Is SPY Or IWM The Better Buy?
SPY is an equity index ETF tracking the S&P 500, the benchmark U.S. equity index.
IWM is an equity index ETF tracking the Russell 2000 index, the benchmark small-cap U.S. equity index.
Both funds offer investors diversified exposure to U.S. equities, are strong investment opportunities, and buys. In my opinion, IWM’s stronger performance track-record and slightly more competitive valuation make it the better buy.
Be the first to comment